1. Main points
The level of self-employment in the UK increased from 3.8 million in 2008 to 4.6 million in 2015. While this strong performance is among the defining characteristics of the UK’s economic recovery, the recent rise in self-employment is the extension of a trend started in the early 2000s.
Full-time and part-time workers each account for around half of the rise in the absolute number of self-employed workers, but the growth rate of the part-time mode has been much stronger. Part time self-employment grew by 88% between 2001 and 2015, compared to 25% for the full-time mode. As a result, part-time self-employment accounts for 1.2 percentage points of the 1.6 percentage point increase in the self-employment share of all employment between 2008 and 2015.
The data presented here suggest that in general, self-employed workers are broadly content with their labour market status. Relatively few report negative reasons for becoming self-employed, few indicate that they are looking for alternative employment and among the part-timers, many respondents report that they would prefer not to work full-time. Evidence of under-employment is strongest among younger, male workers, who display a greater degree of dissatisfaction.
The number of self-employed workers has risen over the long term as a consequence of stronger in-flows from employment and unemployment offsetting a net out-flow to inactivity. These movements, as well as stronger intra-self-employment flows – movements from full-time to part-time self-employment in particular – suggest that recent growth in aggregate self-employment is in part related to workers managing their retirement in a different way to previously.
As groups, both the part-time and full-time self-employed have aged considerably over the last ten years and in excess of that indicated by simple demographics. The fraction employed in finance and business services has risen considerably, they are relatively concentrated in the South East and London, and changes in their usual hours worked have broadly followed trends for employees.
Nôl i'r tabl cynnwys2. Executive summary
The performance of the labour market and the growth of self-employment have been among the defining characteristics of the UK’s recent economic recovery. The headline employment rate – which fell from 73.0% in Q1 2008 to 70.1% in Q3 2011 – recovered relatively quickly, aided in part by strong growth in self-employment. The level of self-employment increased by around 730,000 between 2008 and 2015: rising from 3.8 million to 4.6 million. Around half of this absolute change was accounted for by full-time self-employment, and around half by part-time self-employment. Although the growth of self-employment may have accelerated in recent years, this paper finds that these trends are better seen as a continuation of an existing, pre-downturn trend, extending from the early 2000s, only part of which can be explained by the evolution of demographics (see Section 2).
While the absolute change in self-employment has been evenly divided between full- and part-time modes, the proportionate growth of the part-time mode, albeit from a lower base has been much stronger and has played an important role in raising the prevalence of self-employment overall. Part-time self-employment grew by 88% between 2001 and 2015 – compared with 25% for the full-time mode – and accounts for 1.2 percentage points of the 1.6 percentage point increase in the self-employment share of all employment between 2008 and 2015 (see Section 3). While full-time self-employment continues to account for the majority of self-employed workers, its share of employment and hours has grown somewhat less over the last 15 years (see Section 4).
Below the aggregate level, there are trends that are common to both full- and part-time self-employment. Both groups of workers have seen their age profile get markedly older in recent years, both are increasingly concentrated in the finance & business services industry, and changes in their average usual hours worked have broadly followed the trends of employees. Both groups are relatively concentrated in higher occupational groups and in the South East and London, with full-time self-employed workers in particular becoming more concentrated in the capital (Sections 3 and 4 ).
The evidence presented here suggests that, in general, self-employed workers are broadly content with their labour market status (Sections 3 and 4). Among older part-time self-employed workers in particular, there is little evidence of workers wanting a full-time position, of job search or of dissatisfaction with their self-employed status. Analysis also suggests that those moving from employee positions to self-employment tend to have somewhat higher pre-transition hourly earnings than workers moving to new employee positions: trends which are more consistent with workers making a positive choice, rather than being forced to be self-employed. Among younger and mid-aged self-employed women, in particular those working part-time, the growth in the incidence of self-employment has not been accompanied by growth in the number of people who would prefer to work full-time, nor a clear uptick in the number of workers seeking an alternative job. Among younger part-time self-employed men, however, the picture is less certain. Larger portions of these workers display a greater degree of dissatisfaction with their part-time status and appear to have come directly from unemployment – possibly indicating a choice made under economic hardship. It is among these workers that evidence of under-employment is strongest.
This paper also shows that self-employment has grown over the long term because the net in-flows from unemployment and other forms of employment have exceeded a net outflow to inactivity. During the economic downturn, the net flows from unemployment and from among employees fell markedly, but during the recovery which followed these net inflows grew in volume. The outflow to inactivity also declined markedly during the downturn – largely as a consequence of lower net outflows from part-time self-employment. This result is particularly striking given the age mix of the self-employed, which has shifted towards older workers over the recent years.
This paper also finds evidence of a growing number of workers moving between the full- and part-time modes of self-employment (Sections 3 and 4). While these growing intra-self-employment flows do not affect the headline number of self-employed workers, they are instructive. This may in part reflect changes in labour supply brought on by changes in demand conditions, as self-employed workers alter their hours in response to demand. However, older workers are also much more likely to make the transition from full-time to part-time self-employment than younger workers, and account for a large portion of the growth in this employment mode in recent years. These transitions appear to rarely involve a change of industry or occupation, and are consistent with workers choosing to manage their retirement in a different manner to previously. A larger number of older workers – and the full-time self-employed in particular – appear to be choosing to enter part-time self-employment, rather than retiring directly.
The results of this analysis broadly support and develop the findings of earlier papers, that the recent growth of self-employment is a continuation of a pre-existing, pre-downturn trend, but one which is only partly explained by demographics. Much of the growth in this mode of employment appears to be among workers managing their transition out of the labour market: choosing to work part-time for a period before moving to retirement. As a consequence, these data suggest that the growth of self-employment is a structural feature of the UK labour market which is unlikely to unwind with the economic recovery. Among younger workers the evidence is less clear. Although a relatively small component of self-employment, to the extent that the increase in dissatisfaction among younger male self-employed workers reflects under-employment, some of this labour supply may in time be redeployed to different uses as the recovery progresses.
Nôl i'r tabl cynnwys4. Introduction
The performance of the labour market and trends in self-employment are among the defining characteristics of the UK’s recent economic recovery. The headline employment rate – which fell from 73.0% in Q1 2008 to 70.1% in Q3 2011 – recovered relatively quickly, aided in part by strong growth in self-employment (Figure 1). By Q1 2016, the employment rate had risen to a record high of 74.2%, and just over 4.7 million workers were self-employed . These trends, and in particular the strength of employment relative to GDP and the resulting weakness of productivity, have posed a challenge to economists’ understanding of the labour market (ONS, 2016a). Unprecedented in the UK’s post-war economic experience, these developments have raised questions about the extent to which the shift towards self-employment is a structural or a cyclical phenomenon, the degree to which it reflects “disguised unemployment” and about the changing nature of the UK labour market.
Figure 1: Number of self-employed workers
Quarter 1 (Jan to Mar) 1993 to Quarter 1 (Jan to Mar) 2016
Source: Office for National Statistics, Labour Force Survey
Notes:
- Throughout this article, Q1 to Q4 will be used to refer to the first (January to March) to fourth (October to December) quarters of the calendar year.
- A person is self-employed if they run their business for themselves and take responsibility for its success or failure. Self-employment can be in the form of a sole trader, a partnership (two or more people who run a business) and an owner of a limited liability company (also responsible running the business). The split between full-time and part-time self-employment is based on respondents' self-classification.
- This estimate measures the number of people who are self-employed, so it differs from the estimate self-employed jobs in the workforce jobs series.
Download this chart Figure 1: Number of self-employed workers
Image .csv .xlsThis paper sets out to explore these questions, drawing on official sources of information on the self-employed and proceeds as follows. The first section of the paper summarises headline trends, identifying several important characteristics of the recent growth in self-employment. The second and third sections examine trends in part- and full-time self-employment respectively. They examine the characteristics of self-employed workers in different modes and how these have changed through time, in an effort to identify the drivers of the growth. They examine how the in-flows and out-flows to and from self-employment have contributed to recent developments, and they present some evidence on the earnings of individuals moving between employment and self-employment in an effort to identify the nature of recent changes. A final section offers some discussion and conclusions.
Notes:
Throughout this article, Q1 to Q4 will be used to refer to the first (January to March) to fourth (October to December) quarters of the calendar year.
A person is self-employed if they run their business for themselves and take responsibility for its success or failure. Self-employment can be in the form of a sole trader, a partnership (two or more people who run a business) and an owner of a limited liability company (also responsible running the business). The split between full-time and part-time self-employment is based on respondents' self-classification.
5. Headline trends in self-employment
Both the number of self-employed workers and the share of all employment accounted for by self-employment have risen steadily over the past 15 years (Figures 1 and 2). The number of self-employed workers drifted gently downwards during the late 1990s, touching a low of 3.2 million in Q4 2000. However, it has grown fairly consistently since this low-point – punctuated by periods of strong growth in 2003 and 2014 – and as a result just, over 4.7 million workers were self-employed in early 2016. Around half of the growth in the absolute number of self-employed workers between 2001 and 2015 is accounted for by full-time self-employment, while the remainder is accounted for by growth in part-time self-employment. Between 2008 and 2015, the level of self-employment has risen by around 730,000 – again split evenly between the full-time and part-time modes.
As the prevalence of total self-employment has risen more quickly than the number of employees, its share of all employment has also risen over this period: growing from close to 13.0% in 2008 to 14.9% in the most recent quarter (Figure 2). This recent rise is also largely consistent with the pre-downturn trend: the self-employment share has risen by around 3 percentage points since its low of 11.9% in 2000.
Figure 2: Share of self-employed workers in total employment and self-employed hours in total hours
Quarter 1 (Jan to Mar) 2000 to Quarter 1 (Jan to Mar) 2016
Source: Office for National Statistics, Labour Force Survey, cross sectional datasets, author’s calculations
Download this chart Figure 2: Share of self-employed workers in total employment and self-employed hours in total hours
Image .csv .xlsWhile the share of employment accounted for by self-employment has risen fairly consistently over the last 15 years, the ratio of self-employed hours to total hours has risen more slowly (Figure 2), providing a first clue about the nature of this development. Through much of the early 2000s, self-employment accounted for a much larger share of hours worked than employment. Over this period, the longer average hours worked by the self-employed ensured that their share of hours was around 0.8 to 1.1 percentage points higher than thier share of employment. However, the gap between these shares has gradually fallen and was eliminated almost entirely by 2014, reflecting the fall of average self-employed hours worked relative to the average for employees.
Figure 3 examines this development in more detail, showing the change in the self-employment share of total employment accounted for by full- and part-time workers. Although the full- and part-time modes have accounted for similar fractions of the absolute change in self-employment, the number of part-time workers has grown much more quickly than the full-time mode. The number of part-time self-employed workers has risen by 88% between 2001 and 2015, compared with 25% for the full time mode. This faster growth has enlarged its share of total employment at the expense of other, slower-growing employment modes. Figure 3 indicates that between 2007 and 2015, the self-employment share increased by 1.6 percentage points, of which 1.2 percentage points were accounted for by part-time self-employment. Figure 3 shows that this is not only a recent phenomenon, but a longer-term trend. The part-time share has been rising consistently since the early 2000s, and accounts for the majority of the growth in the self-employment share over the last 15 years. The share of employment accounted for by full-time self-employment has grown relatively modestly, and accounts for a relatively small portion of the growth since the economic downturn.
Figure 3: Contributions to the change in the self-employment share of employment accounted for by full- and part- time self-employment
Change relative to 2001 average, Quarter 1 (Jan to Mar) 1999 to Quarter 1 2016
Source: Office for National Statistics, Labour Force Survey, cross sectional datasets, author’s calculations
Download this chart Figure 3: Contributions to the change in the self-employment share of employment accounted for by full- and part- time self-employment
Image .csv .xlsLong-term labour market changes – such as the growing prevalence of part-time self-employment – are often prompted by gradual demographic changes which have a small, but cumulative impact on labour market aggregates. The UK population has aged considerably over the last 15 years (ONS, 2016c), providing one such possible source of change. The average age of workers increased from 39 years to 41 years between 2001 and 2015, while the number of workers aged over 60 has grown from 1.5 million to 3.0 million over this period. If older workers are more likely to be self-employed, this gradual demographic drift can lead to movements in the headline number of self-employed workers, even in the absence of changes to the likelihood of workers in any given age group being self-employed.
Estimating the precise impact of demographics is not straightforward, but while it appears that the ageing population has had an impact on the level of self-employment (Tatomir, 2015), this analysis finds that other factors are considerably more important. To quantify the impact of the ageing population, Figure 4 decomposes cumulative growth in self-employment relative to 2001 into the estimated contributions of changing demographics, participation and employment rates, as well as changes in the self-employment propensity of workers . It shows that while population growth and the ageing of the population have made a positive contribution to the growth of self-employment over recent years, it accounts for a relatively small fraction of the overall growth. Changes in participation – reflecting greater attachment to the labour market in 2015 than in 2001 – and changes in the propensity of individuals of different ages to be self-employed have a bigger impact. Consequently, while the ageing of the population appears to have had an important impact on total self-employment, much of its growth is due to changes in participation and self-employment propensity.
Figure 4: Contributions to the cumulative growth of self-employment since 2001
1997 to 2015
Source: Office for National Statistics, Labour Force Survey, cross sectional datasets, author’s calculations
Download this chart Figure 4: Contributions to the cumulative growth of self-employment since 2001
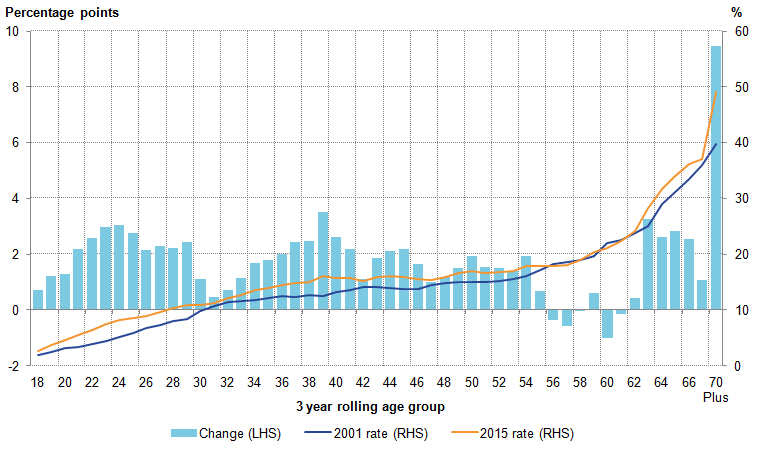
Image .csv .xlsThese changes in self-employment propensity also appear to be relatively broadly based across different age groups – although some of the largest changes are among the oldest workers. Figure 5 estimates the self-employment share of employment of each age group in 2001 and 2015 (lines, right hand axis) and the change between the two periods (bars, left hand axis). The lines on this chart indicate that in both 2001 and 2015, self-employment accounted for a larger share of total employment at older ages – rising to almost half of all those in employment aged over 70. However, it also shows that the “self-employment propensity” of almost all age groups has risen over this period, with the largest changes among those aged over 70.
Figure 5: Self-employment as a proportion of total employment, by age group
Percentage and percentage points, 2001 and 2015 (lines) and change between 2001 and 2015 (bars)
Source: Office for National Statistics, Labour Force Survey, cross sectional datasets, author’s calculations
Notes:
- A 3 year rolling age group is used at each age point, for example the point at age 18 represents the range 18 to 20 years old. Except at point 70 plus.
Download this image Figure 5: Self-employment as a proportion of total employment, by age group
.png (29.4 kB) .xls (32.8 kB)This change in self-employment propensity also appears to have been affected by a combination of stronger if volatile in-flows, and stable or weakening out-flows from self-employment. Figure 6 uses the Labour Force Survey (LFS) longitudinal datasets – which includes data from respondents aged 16 to 69 years old – and presents data on worker movements into and out of self-employment from one quarter to the next, expressed as a proportion of all self-employed workers. It shows that much of the rise in self-employment in the post-downturn period can be attributed to somewhat stronger inflows than out-flows.
Figure 6: Flows into and out of self-employment, proportion of all self-employed workers
4 quarter moving average, Quarter 1 (Jan to Mar) 1999 to Quarter 4 (Oct to Dec) 4 2015
Source: Office for National Statistics, Labour Force Survey, two-quarter longitudinal dataset, author’s calculation
Notes:
- Changes in the aggregate flows sourced from the longitudinal LFS may be different to changes measured in stock of self-employed workers. This is due to methodological and sampling differences in the datasets. Prior to Q3 2001 the age for women in the longitudinal datasets was 16-59 and men 16-64. From Q3 2001 onwards, the age range for all is 16-69.
Download this chart Figure 6: Flows into and out of self-employment, proportion of all self-employed workers
Image .csv .xlsConclusions
The data in this section present several “stylised facts” about the recent rise in self-employment, which the following two sections examine in more detail. Firstly, the number of self-employed workers has risen rapidly over the last 15 years – reflecting a mixture of growth in the size of the population and growth in the propensity for workers to be self-employed.
Secondly, the self-employment share of all employment has risen more quickly than its share of total hours worked, highlighting the importance of part-time self-employment in supporting recent trends. Although the part-time and full-time modes each account for around half of the absolute growth in the number of self-employed workers since 2001, the growth rate of the former group has been much faster. As a consequence, part-time self-employment accounts for more than half of the growth in the self-employment share of all employment since 2001, and closer to 75% of the growth observed since the onset of the economic downturn.
Thirdly, while demographic change – and in particular an ageing population – has been an important driver of self-employment, analysis suggests that worker choices about participation and the nature of their employment are considerably more important. Finally, the rise in self-employment appears largely a consequence of a rising, if volatile, inflow and a stable or falling outflow.
Notes:
This analysis sets out from the observation that the number of self-employed workers in a given period equals
where SE is total self-employment, P is the population, A is the economically active population, E is the number of people in employment and i and t index age groups and time periods respectively. This analysis uses discrete age groups between 18 and 79, and a composite for individuals aged 80 and above, uses annual frequency data and generates estimates for full- and part-time self-employment separately before aggregating to the totals displayed. The effects presented in the chart hold the ratios on the right hand side of 1 constant from 2001 sequentially. For instance, the impact of demographics is measured by holding the three right-hand side ratios constant at their 2001 levels and allowing the population age structure to evolve. The impact of participation rates is addressed by holding the final two ratios constant at their 2001 levels and allowing labour market participation to evolve. The final, ‘self-employment propensity’ effect is calculated by residual. Note that these effects may not be independent: the likelihood of participation may be affected by the relative attractiveness of self-employment, for example. These results are similar to those produced in a recent Bank of England analysis, which uses 2004 as its reference year. Here, for consistency with the rest of the piece, 2001 is the chosen reference year.Due to these sampling and other methodological differences, changes in the aggregate flows sourced from the longitudinal LFS may be different to changes measured in stock of self-employed workers (ONS, 2015a).
6. Trends in part-time self-employment
Part-time self-employment accounted for around half of the absolute growth in the number of self-employed workers between 2001 and 2015. While the number of part-time employees has risen by 7.9% since the onset of the economic downturn in 2008, and the number of full-time self-employed workers has risen by 10.9%, the number of self-employed part-timers has risen by 46.6% over the same period. While it is tempting to ascribe this difference to the factors which surrounded the economic downturn, an examination of the longer-term series suggests that recent developments are better seen as a continuation of an existing, pre-downturn trend. Between 2001 and 2015, part-time self-employment grew by around 88% in total, while the number of employees working part-time grew by 25% in total.
As a consequence of this strong growth in the number of part-time self-employed workers, its share of total employment and hours has risen over the 15 years between 2000 and 2015. Figure 7 shows that the employment share of part-time self-employment grew from around 2.6% in 2001 to 3.1% just before the downturn, before rising to around 4.3% in 2015. During the same period, the share of total hours worked by part-time self-employed workers increased by 0.8 percentage points. As it is this changing prevalence of part-time self-employment which accounts for much of the growth in the aggregate self-employment share over this period, understanding developments in part-time self-employment are key to understanding this feature of recent labour market behaviour.
Figure 7: Part-time self-employment share of total employment and hours
Quarter 1 (Jan to Mar) 2000 to Quarter 1 (Jan to Mar) 2016
Source: Office for National Statistics, Labour Force Survey, cross sectional datasets, author’s calculations
Download this chart Figure 7: Part-time self-employment share of total employment and hours
Image .csv .xlsWho are the part-time self-employed?
One approach to understanding changes in this part of the UK’s labour market is to examine how the characteristics of the part-time self-employed have varied through time. This approach uses the repeated snap-shots of data from the Labour Force Survey (LFS) to understand the starting composition of the group, as well as how it has developed over time. Figures 8 to 14 present some of these key characteristics and how they have developed between 2001 and 2015 – encapsulating both the sustained long-term growth in part-time self-employment and the growth observed during the economic recovery.
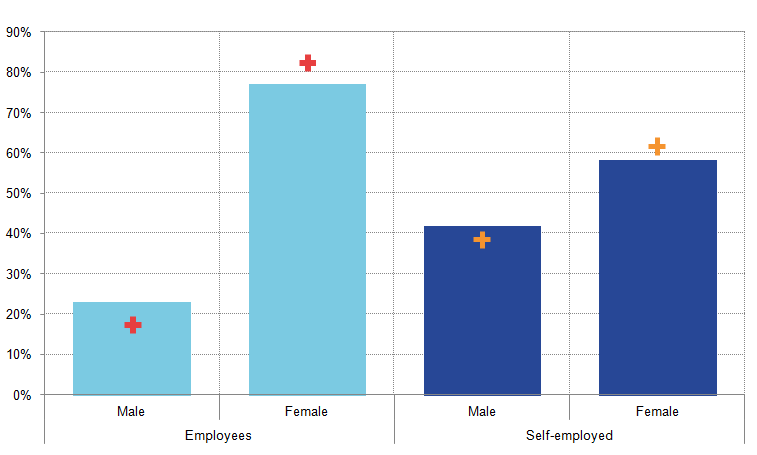
Perhaps the most natural starting point is the age and sex mix of the part-time self-employed, which differs markedly from that of part-time employees. The ratio of female to male workers in the former group (Figure 8) was around 3:2 in 2015 – considerably more balanced than among part-time employees (3:1 in the same period). The composition of both these groups is marked by the larger number of female workers who opt to work part-time, likely reflecting household choices about labour supply (Craig, et al., 2012). However, both part-time employees and self-employed workers have become more gender balanced over the last 15 years, as the share of female workers in both groups contracted slightly between 2001 (points) and 2015 (bars), with a corresponding uplift in the share of men working part-time over the period.
Figure 8: Proportion of part-time employees and part-time self-employment accounted for by males and females 2001 (crosses) and 2015 (bars), percentage
Source: Office for National Statistics, Labour Force Survey, cross sectional datasets, author’s calculations
Download this image Figure 8: Proportion of part-time employees and part-time self-employment accounted for by males and females 2001 (crosses) and 2015 (bars), percentage
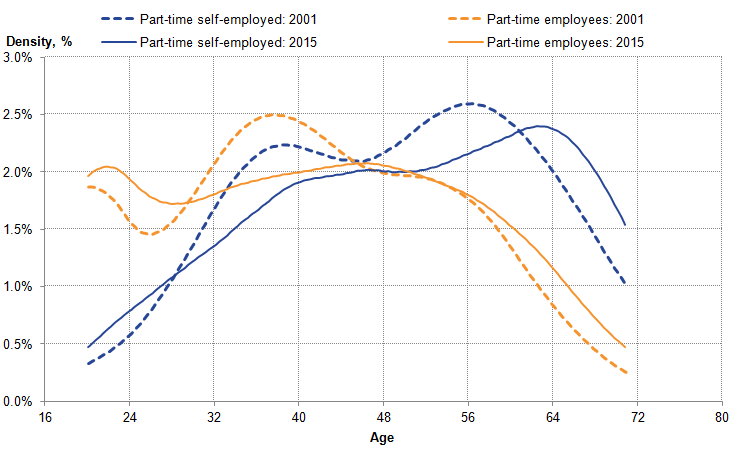
.png (13.8 kB) .xls (26.1 kB)The age profile of part-time self-employed workers reveals that they tend to be older than part-time employees. Figure 9 plots the age distribution for part-time self-employment (blue lines) and part-time employees (red lines) – showing the proportions of each group which are composed of workers of specific ages. Among employees, the age distribution in 2015 was bimodal, with a concentration among younger workers around 20 year olds, likely composed of students and early-career workers. The second concentration lies among workers in their mid-40s, this second mass occurs later and is less pronounced than in 2001. Among self-employed workers, the distribution also appears to have two, broad concentrations – with a mass around workers in their mid-40s, and another around 60 to 65. The distributions for both cohorts relative to 2001 show a general shift towards older aged workers, but this shift is more striking among part-time self-employed workers. The 65 plus age group accounted for 22% of all part-time self-employment in 2015, up from 14% in 2001.
Figure 9: Distribution of part-time self-employment and part-time employees by age
2001 and 2015
Source: Office for National Statistics, Labour Force Survey, cross sectional datasets, author’s calculations
Notes:
- This analysis is based on a kernel density, using a bandwidth parameter of 3.5. Points at which an unweighted density implies an observation size of less than 10 have been excluded to avoid disclosure.
Download this image Figure 9: Distribution of part-time self-employment and part-time employees by age
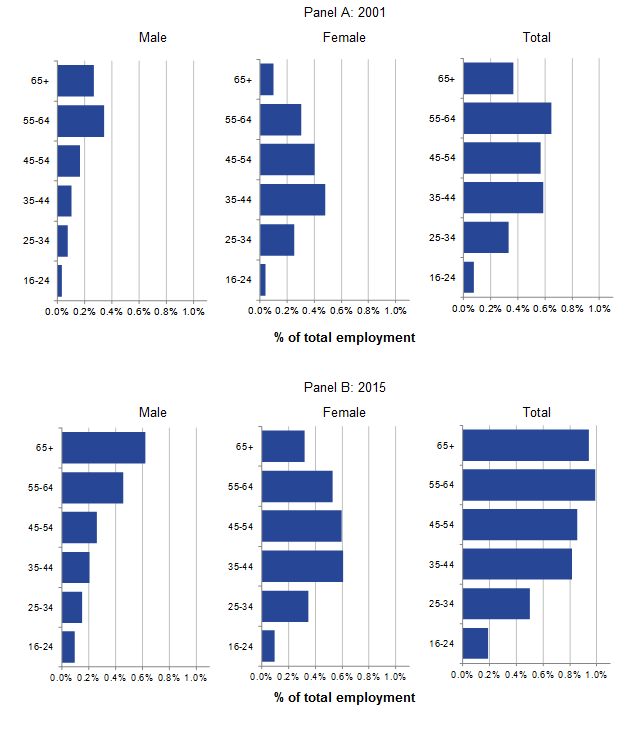
.png (27.3 kB) .xls (97.3 kB)Combining these two characteristics – age and sex – reveals that the part-time self-employed are composed of several different groups whose attraction to this mode of working are likely to vary. In 2001, the part-time self-employed population was broadly a combination of older men and a mixture of younger and mid-aged women (Figure 10, Panel A). This may reflect the choices of women with families to work in a more flexible way, and a choice among older men to delay retirement through self-employment. Comparing the equivalent distributions of part-time self-employment in 2015 with this 2001 baseline suggests that the growing prevalence of this mode of working is particularly due to a larger number of part-time self-employed older men and women (see Figure 10, Panel B), as well as to growth among younger and mid-aged women. While younger and mid-aged men have also made a contribution to the growth in part-time self-employment, this effect appears relatively modest next to the contribution of older workers and younger and mid-aged women.
Figure 10: Share of total employment by sex and age group accounted for by part-time self-employment males, females and total
Percentage, 2001 and 2015
Source: Office for National Statistics, Labour Force Survey, cross sectional datasets, author’s calculations
Download this image Figure 10: Share of total employment by sex and age group accounted for by part-time self-employment males, females and total
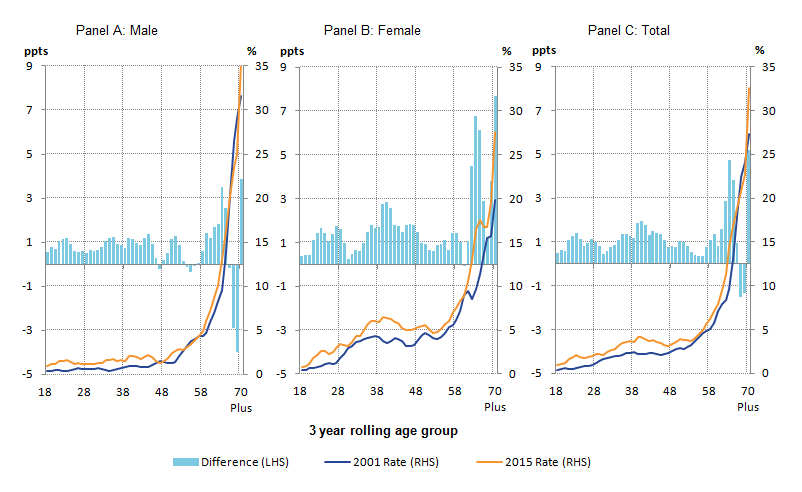
.png (22.8 kB) .xls (28.2 kB)While these trends partly reflect the demographic structure of the UK population – and in particular the larger number of older workers – there is also evidence that the “part-time self-employed propensity” has risen over this period. Figure 11 shows this propensity for men, women and all workers (Panels A, B and C respectively) in 2001 and 2015, as well as the difference between the two observation points. These data suggest that part-time self-employment is more prevalent among older workers, and that it has become more prevalent across most age groups over the last 15 years. As with total self-employment, some of the largest changes over the last 15 years are among the oldest workers: among older female workers in particular – who were more likely to be part-time self-employed than younger workers in 2001 – the self-employment propensity has risen.
Figure 11: Rate of part-time self-employment among total employment by age and sex
2001 and 2015 (lines): percentage, and change between 2001 and 2015 (bars): percentage points
Source: Office for National Statistics, Labour Force Survey, cross sectional datasets, author’s calculations
Notes:
- A 3 year rolling age group is used at each age point, for example the point at age 18 represents the range 18 to 20 years old. Except at point 70 plus.
Download this image Figure 11: Rate of part-time self-employment among total employment by age and sex
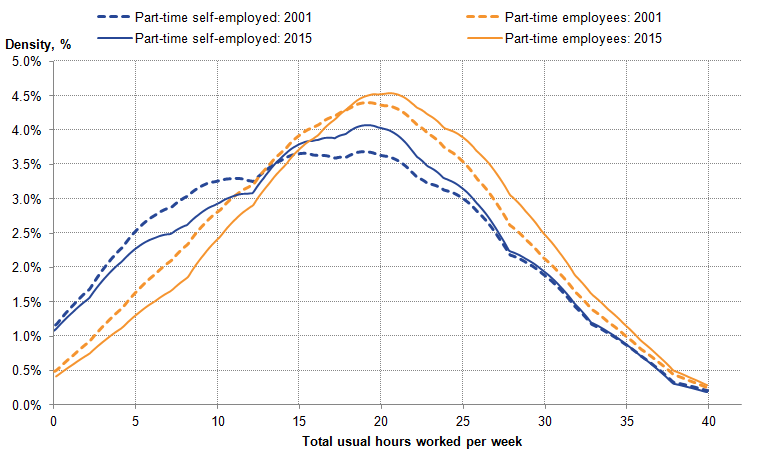
.png (34.9 kB) .xls (28.2 kB)The growing number of part-time self-employed workers has come alongside growth in the average length of the usual working week for this group. Figure 12 shows the distribution of usual hours worked by part-time self-employed workers and employees in 2001 and 2015. For both groups, the distribution of usual hours has shifted slightly higher since 2001 although, on average, the part-time self-employed tend to work fewer hours than part-time employees. This partly reflects the age-mix of the part-time self-employed. Older workers – defined as those aged 60 and above – tend to work shorter part-time weeks than younger part-time self-employed workers, and the behaviour of the latter group is much closer to employees of a comparable age.
Figure 12: Distribution of part-time hours, employees and self-employed
2001 and 2015
Source: Office for National Statistics, Labour Force Survey, cross sectional datasets, author’s calculations
Notes:
- This analysis is based on a kernel density, using a bandwidth parameter of 3.5. Points at which an unweighted density implies an observation size of less than 10 have been excluded to avoid disclosure.
Download this image Figure 12: Distribution of part-time hours, employees and self-employed
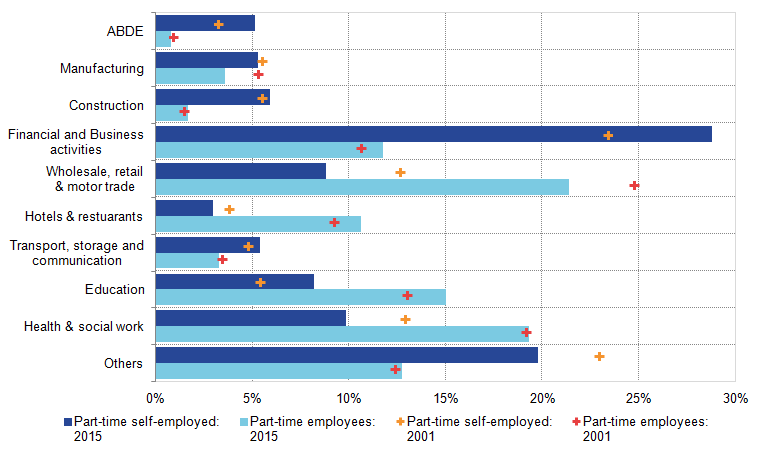
.png (43.8 kB) .xls (94.2 kB)Changes in the usual working patterns of part-time self-employed workers may also reflect the evolving mix of industries in which they work. Figure 13 shows the share of part-time self-employed workers and part-time employees by industry in 2001 (crosses) and 2015 (bars). It indicates that part-time self-employed workers are concentrated in the finance & business activities industries, whereas part-time employees are predominately in the wholesale, retail & motor trade, and health & social work industries. Part-time self-employed workers have also become more concentrated in the education and finance & business services industries over the last 15 years, shifting away from health & social work and wholesale & retail trade. There are some marked differences between the industries of part-time employees and self-employed workers.
Figure 13: Share of the part-time self-employed and part-time employees by industry
Percentage, 2001 and 2015
Source: Office for National Statistics, Labour Force Survey, cross sectional datasets, author’s calculations
Download this image Figure 13: Share of the part-time self-employed and part-time employees by industry
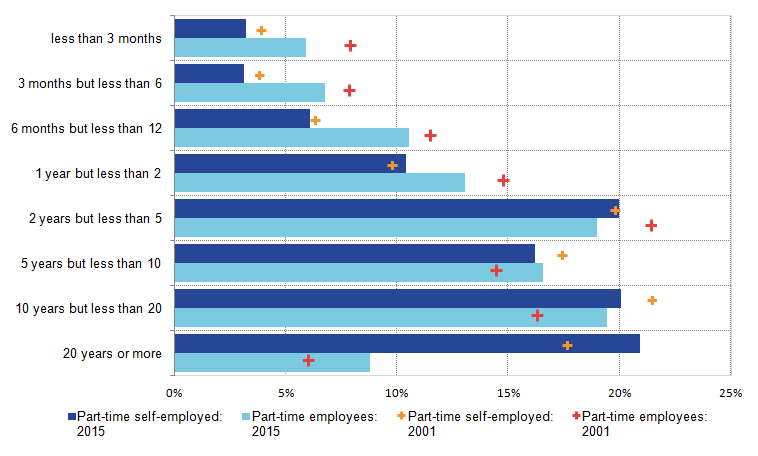
.png (14.7 kB) .xls (27.6 kB)Alongside these differences in industrial mix, there are also clear differences in the occupational structure and job-tenure of part-time self-employed workers relative to part-time employees. Part-time self-employed workers are more concentrated in higher occupational groups, and although part-time employees have risen in occupational stature since 2001, there is little change for the part-time self-employed. Figure 14 shows the share of self-employed and employee part-timers by job tenure. It indicates that over the last 15 years, part-time self-employed workers are also more likely to have been in their job for a longer period of time than their employee counterparts.
Figure 14: Share of the part-time self-employed and part-time employees by job tenure
Percentage, 2001 and 2015
Source: Office for National Statistics, Labour Force Survey, cross sectional datasets, author’s calculations
Download this image Figure 14: Share of the part-time self-employed and part-time employees by job tenure
.png (14.7 kB) .xls (27.6 kB)Finally, there are also differences in the regional spread of part-time self-employed workers. Part-time self-employed workers are relatively concentrated in the South East, London and the South West. These regions account for close to half of the part-time self-employed population: however, this pattern broadly follows the distribution of part-time employees – albeit slightly more concentrated in London and the South East. The share of part-time self-employed individuals in all regions has also changed very little since 2001, suggesting that other determinants are more important in explaining the growth of part-time self-employment.
Taken together, these data suggest that as a group the part-time self-employed have become older over the last 15 years, reflecting the growing popularity of this employment mode among older men and women and a group of younger and mid-aged women in particular. They suggest that the part-time self-employed are relatively concentrated in finance & business services – and that this concentration has risen over the last 15 years – that they tend to be in higher occupational positions, and that they have held their job for a relatively long period of time. Finally, consistent with changes in average part-time hours, the distribution of average usual weekly part-time self-employed hours has shifted up over the last 15 years, but remains below that of part-time employees.
Motivations for part-time self-employment
While changes in cross-sectional characteristics provide some clues about the reasons for the recent growth in part-time self-employment, it is difficult to establish precise causes with any certainty. This section steps beyond these characteristics by using a range of questions posed as part of the Labour Force Survey (LFS) to examine whether the part-time self-employed are broadly content with their employment mode. This analysis provides some information about the nature of the recent growth in self-employment.
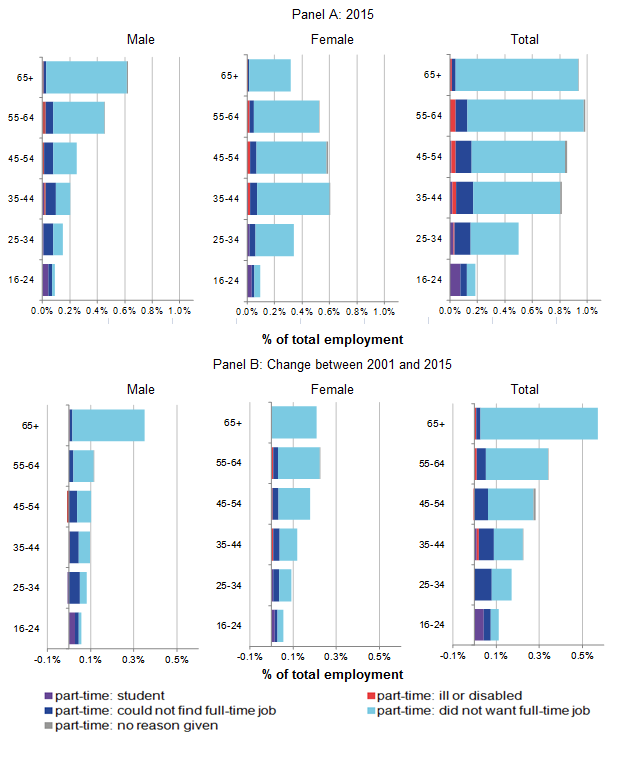
Addressing the question of whether part-time self-employed workers are content with their mode of employment is critical to recent debates about whether recent developments in the labour market are structural or cyclical, and provides insights about whether the mode is a form of "disguised unemployment". It can be approached from three different angles using questions directed to respondents in the LFS. Firstly, data from the LFS indicates that the vast majority of the part-time self-employed chose to work part-time because they did not want a full-time job. While the question posed here is backward looking – asking why a respondent took a part-time position, rather than why they are currently working part-time – the results provide a partial window on the choices of these workers. Panel A of Figure 15 uses the approach adopted above to divide respondents by age group and sex, and shows the reasons for part-time working provided by each group. A majority of part-time self-employed women of every age in 2015 report "not wanting a full-time job" as their reason for working part-time. Among men aged 55 and above, the part-time mode also appears to be the preferred option, with the fraction providing other reasons falling away to zero from those aged above 65. For these groups, this evidence suggests that part-time employment is preferred to a full-time role.
Among younger men – in particular those aged 25 to 34 – the evidence is more mixed. While among young women, the part-time option also appears to be a preference, among mid-aged and younger part-time self-employed men the "optimality" of their mode of employment is uncertain. For these workers, a large portion of the respondents suggest that they would prefer to work longer hours.
Figure 15: Part-time self-employment as a proportion of total employment, by age group, sex and reason for working part-time
Percentage and percentage points, 2015 and change between 2001 and 2015
Source: Office for National Statistics, Labour Force Survey, cross sectional datasets, author’s calculations
Download this image Figure 15: Part-time self-employment as a proportion of total employment, by age group, sex and reason for working part-time
.png (43.9 kB) .xls (32.8 kB)How have these data changed through time? Panel B of Figure 15 shows the growth of part-time self-employment by age, sex and the reason for working part-time between 2001 and 2015. As reported above, most of the growth of part-time self-employment has been among older workers, as well as some growth among women in their 40s and 50s. Panel B also suggests that among these groups, growth has been supported by growth in the fraction of people who report that they do not want a full-time position. Among mid-aged and younger men, however, most of the growth in part-time self-employment since 2001 has been accompanied by growth in the number of workers reporting that they cannot find a full-time position.
Combining these age and sex groups, Figure 16 highlights this point by showing the percentage change in part-time self-employment between 2001 and 2015, as well as the contributions from the reason for working part-time. It indicates that the majority of growth has been due to changes in the fraction who preferred a part-time position, with a smaller, if still substantial rise in those who could not find a full-time post.
Figure 16: Contribution to growth in part-time self-employment between 2001 and 2015, by reason for working part-time
Source: Office for National Statistics, Labour Force Survey, cross sectional datasets, author’s calculations
Download this chart Figure 16: Contribution to growth in part-time self-employment between 2001 and 2015, by reason for working part-time
Image .csv .xlsThe second way of approaching the ‘optimality’ of the part-time self-employment choice is to examine whether workers are "happily self-employed". The LFS recently introduced a question asking respondents why they chose this mode of employment, offering several possible pre-determined reasons. As before, this question is backwards looking – asking why respondents became self-employed – and its limited history reduces the potential for analysis through time. However, it does provide some sense of the reasons workers became self-employed (Department for Business, Innovation & Skills, 2016a). To draw some broad conclusions, Figure 17 aggregates these reasons into four subjectively defined groups: (a) broadly "positive" reasons (including making a choice about the nature of work desired or the identification of a niche in the marketplace), (b) "negative" reasons (including redundancy and not being able to find alternative employment), (c) "life-style choice" reasons (including to boost household income and as a form of working after retirement) and (d) broadly "neutral" reasons (including starting or joining a family business, or other reason).
Figure 17: Reasons for being self-employed among the part-time self-employed by age group
Percent of all employment, 2015
Source: Office for National Statistics, Labour Force Survey, cross sectional datasets, author’s calculations
Notes:
Groups defined as follows: Positive: (a) Saw the demand of the market, (b) Nature of job or chosen career, (c) Better work conditions or job satisfaction. Negative: (a) Redundancy, (b) Could not find other employment. Lifestyle choice: (a) To maintain or increase income, (b) Job after retirement. Neutral: (a) Other, (b) Started or joined a family business.
Points at which an unweighted density implies an observation size of less than 10 have been excluded to avoid disclosure.
Download this chart Figure 17: Reasons for being self-employed among the part-time self-employed by age group
Image .csv .xlsThe results from this analysis are difficult to interpret. Among the few conclusions which can be drawn confidently, these data suggest that the vast majority of part-time self-employed workers do not report negative reasons for their employment choice. Where negative reasons are reported – among older workers – this group accounts for a relatively small share, and is outweighed by the relatively narrowly defined ‘positive’ reasons – which are also concentrated among older workers. Among older workers, part-time self-employment also appears to have been used as a means of extending work beyond retirement and of supporting household income. However, it is difficult to establish workers’ motivations with any certainty as it is unclear whether these choices were driven by financial necessity and distress, or by a more positive choice. Among younger workers, the limited number of respondents also contributes to make it difficult to draw firm conclusions.
Thirdly, while questions on whether individuals are "happily part-time" or "happily self-employed" assess individual’s attitudes towards specific aspects of their labour market position, their degree of dissatisfaction might also be approximated by the fraction of individuals seeking alternative employment. Figure 18 shows how the part-time self-employed share of all employment has changed relative to 2007, including contributions from among workers who are, and who are not, seeking alternative employment. It indicates that the number of workers looking for another job grew following the economic downturn. However, this only accounted for a small proportion of this increase in part-time self-employment share: the majority of the increase has been among those who are not seeking a different job.
Figure 18: Change in part-time self-employment as a proportion of total employment, by job seeking status
Change relative to 2007, percentage points, Quarter 1 (Jan to Mar) 2007 to Quarter 4 (Oct to Dec) 2015
Source: Office for National Statistics, Labour Force Survey, cross sectional datasets, author’s calculations
Download this chart Figure 18: Change in part-time self-employment as a proportion of total employment, by job seeking status
Image .csv .xlsAnalysis of part-time self-employment flows
The final part of the analysis of trends in part-time self-employment uses the LFS longitudinal datasets, which track the detailed employment transitions of individuals over a period of 5 quarters. In contrast to the cross-sectional data presented above, these longitudinal data permit analysis of the labour market status of workers before they become part-time self-employed, as well as their employment choices after they leave.
Much of the growth in part-time self-employment appears to have been a consequence of a higher, if more volatile, inflow, and a relatively stable outflow. Figure 19, which shows the gross in-flows and outflows as a proportion of all in self-employment, indicates that the numbers of people entering and leaving part-time self-employment in each rolling 4-quarter period was close to 5% in 2015. It also shows that the gross inflow has exceeded the gross outflow in each quarter of the last 17 years, except in Q1 2009, although the difference between them broadened considerably between 2009 and 2014.
Figure 19: Gross inflow and outflow to and from part-time self-employment as a fraction of self-employed
4 quarter moving average, Quarter 1 (Jan to Mar) 1999 to Quarter 4 (Oct to Dec) 2015
Source: Office for National Statistics, Labour Force Survey, two-quarter longitudinal dataset, author’s calculations
Notes:
- Changes in the aggregate flows sourced from the longitudinal LFS may be different to changes measured in stock of self-employed workers. This is due to methodological and sampling differences in the datasets. Prior to Q3 2001 the age for women in the longitudinal datasets was 16-59 and men 16-64. From Q3 2001 onwards, the age range for all is 16-69.
Download this chart Figure 19: Gross inflow and outflow to and from part-time self-employment as a fraction of self-employed
Image .csv .xlsCombining these aggregate gross flows with information about the source and destination of individuals permits an analysis of the net flow into part-time self-employment from other labour market positions. Figure 20 shows contributions to the net flow into part-time self-employment from unemployment, inactivity, full-time self-employment and employees. Where a component makes a positive contribution to the net flow – such as the consistent, positive contribution from unemployment – Figure 20 implies that more individuals moved into part-time self-employment from that status than left part-time self-employment to join it.
Read in this way, it is clear that the long-term growth of part-time self-employment is largely a consequence of the net inflows from unemployment, employment and full-time self-employment consistently exceeding the net outflow to inactivity. The source of the sharp rise in the net inflow following the economic downturn is also somewhat clearer. During this period, the net inflows from full-time self-employment and unemployment increased relatively sharply, while the net inflow from inactivity – which had persistently dragged on the growth of part-time self-employment during the decade prior to 2000 – shrank and became slightly positive. This latter result is particularly striking given the ageing of the part-time self-employed population. All else equal, a greater flow to inactivity might be expected from a relatively older group of workers: the opposite of what is observed.
Figure 20: Composition of the net flow by previous labour market status, proportion of self-employed
Quarter 1 (Jan to Mar) 1999 to Quarter 4 (Oct to Dec) 2015
Source: Office for National Statistics, Labour Force Survey, two-quarter longitudinal dataset, author’s calculations
Notes:
- Changes in the aggregate flows sourced from the longitudinal LFS may be different to changes measured in stock of self-employed workers. This is due to methodological and sampling differences in the datasets. Prior to Q3 2001 the age for women in the longitudinal datasets was 16-59 and men 16-64. From Q3 2001 onwards, the age range for all is 16-69.
Download this chart Figure 20: Composition of the net flow by previous labour market status, proportion of self-employed
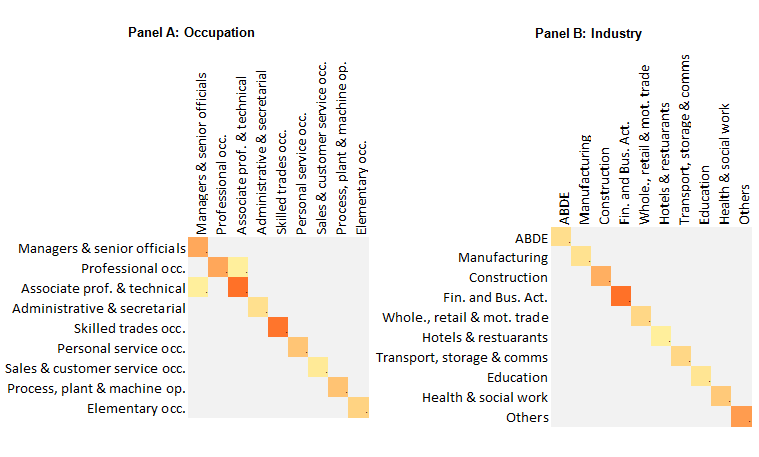
Image .csv .xlsWhile it is not possible to be sure of precise causes, these data are broadly consistent with three conjectures. Firstly, following the economic downturn a large number of full-time self-employed individuals either chose to become part-time, or found that meeting demand for their services no longer required full-time input. As a result, many of these workers shifted from a full-time mode to a part-time mode, but otherwise continued with their business. To explore the precise nature of these transitions, Figure 21 shows heat maps of the occupation (Panel A) and the industry (Panel B) of those full-time self-employed who transitioned to part-time self-employment between 2010 and 2015. On the vertical (horizontal) axis is plotted their occupation or industry before (after) transition, and the brighter colours indicate larger numbers. The concentration of workers along the diagonal – suggesting that individuals shifting from full-time to part-time self-employment change their occupation or industry relatively rarely – is indicative that these workers continued with broadly the same activities, but simply cut their hours.
Figure 21: Cross-tabulation of the composition of the inflow into part-time self-employment from full-time self-employment by Occupation (Panel A) and Industry (Panel B)
Source: Office for National Statistics, Labour Force Survey, two-quarter longitudinal dataset, author’s calculations
Notes:
- Brighter colours indicate larger numbers. Disclosive data are indicated by the light grey colouring.
Download this image Figure 21: Cross-tabulation of the composition of the inflow into part-time self-employment from full-time self-employment by Occupation (Panel A) and Industry (Panel B)
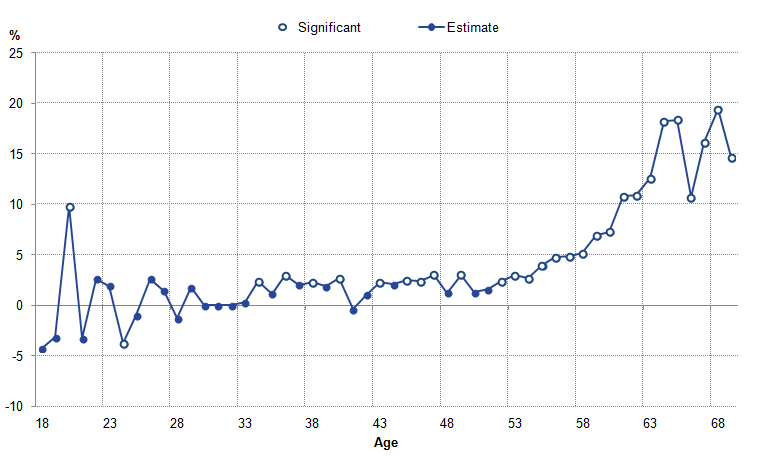
.png (27.1 kB) .xls (31.2 kB)Transitions from full-time to part-time self-employment also appear to be most prevalent among relatively older workers, suggesting that it is relatively experienced workers who make this move. Figure 22 reports the likelihood of a worker of a given age transitioning from full-time to part-time self-employment relative to workers aged 30 to 32, drawn from a regression-model with controls for other individual and time-period characteristics. It suggests that relative to a full-time self-employed worker in their early 30s, an equivalent individual aged in their late 50s and 60s is between 5% and 20% more likely to make the transition to part-time self-employment, suggesting that these moves are partly about managing the transition from employment to inactivity.
Figure 22: Impact of age on likelihood of transition from full-time self-employment to part-time self-employment
Percentage, 2002 to 2015
Source: Office for National Statistics, Labour Force Survey, five-quarter longitudinal dataset, author’s calculations
Notes:
- Figure shows the coefficients on individual age dummy variables from a linear regression model. The dependent variable is a binary variable in whether an individual transitions from full-time self-employment to part-time self-employment. The independent variables include individual age effects (base case: ages 30-32), sex, industry of employment (10 categories), occupation (10 categories), broad job-tenure (8 categories) and a set of annual time fixed effects. Regression is estimated using all full-time self-employed individuals from 2002 to 2015, including 24,480 observations and is weighted to reflect the population.
Download this image Figure 22: Impact of age on likelihood of transition from full-time self-employment to part-time self-employment
.png (20.5 kB) .xls (29.7 kB)A second conjecture which is consistent with these flows data is that part-time self-employment proved a relatively more attractive form of employment for some workers who found themselves unemployed during the economic downturn. Examining the gross flows, there is some evidence that the initial downturn was associated with more self-employed part-timers becoming unemployed. By mid-2010, however, this flow has broadly returned to its pre-downturn rate, and the flow from unemployment to part-time self-employment has picked up.
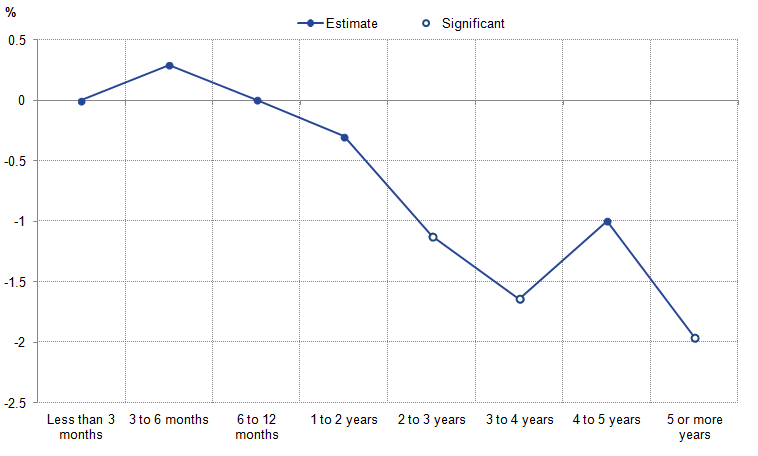
There is also some evidence that these transitions from unemployment to part-time self-employment were more likely among those who had been out of work for a relatively short period. Figure 23 shows the impact of several unemployment durations on the likelihood of making this transition, conditional on several individual characteristics. It suggests that workers who had beeen out of work for less than two years had broadly the same likelihood of transitioning to part-time self-employment, but that at longer-durations the probability of moving to part-time self-employment was significantly lower.
Figure 23: Impact of unemployment duration on the likelihood of transitioning from unemployment to part-time self-employment
Percentage, 2002 to 2015
Source: Office for National Statistics, Labour Force Survey, five-quarter longitudinal dataset, author’s calculations
Notes:
- Figure shows the coefficients on unemployment duration dummy variables from a linear regression model. The dependent variable is a binary variable in whether an individual transitions from unemployment to part-time self-employment. The independent variables include individual age effects (base case: ages 30-32), sex, duration of unemployment (8 categories) and a set of annual time fixed effects. Regression is estimated using all unemployed individuals from 2002 to 2015, including 11,790 observations and is weighted to reflect the population.
Download this image Figure 23: Impact of unemployment duration on the likelihood of transitioning from unemployment to part-time self-employment
.png (19.7 kB) .xls (19.5 kB)Examining the net flow from unemployment to part-time self-employment in more detail also suggests that the recent strength of this flow is due to relatively young workers. Figure 24 compares the net flows from unemployment to part-time self-employment by age group between 2002 and 2007 with the net flow between 2010 and 2015. The net flow from unemployment to part-time self-employment among workers aged 65 and over was virtually zero in both periods, but all other age groups show some growth over this time-frame. Among 16 to 24 year olds and among 35 to 44 year olds and the increase is particularly pronounced. The former flow rises from 5,300 to 16,100 over this period, with the latter increased from a net flow of 7,900 to 22,500 over this period.
Figure 24: Net flow from unemployment to part-time self-employment, by age group
2002 to 2007 and 2010 to 2015
Source: Office for National Statistics, Labour Force Survey, two-quarter longitudinal dataset, author’s calculations
Download this chart Figure 24: Net flow from unemployment to part-time self-employment, by age group
Image .csv .xlsThe third conjecture which is consistent with the net flows data is that relatively older workers who were part-time self-employed chose to continue working rather than retiring during the economic downturn. This can be seen in Figure 20 above, in which the consistent net outflow from part-time self-employment to inactivity declines to zero following the economic downturn, and even adds to the stock of self-employed part-timers in 2011 and 2013. This development is largely a consequence of a continued increase in the inflow from inactivity, and a broadly flat profile for the out-flow. Given the ageing of the part-time self-employed, this result is particularly noteworthy.
Finally, the longitudinal LFS data also permit some analysis of the earnings of employees moving into or from part-time self-employment. While measures of hourly self-employment income are not available from the LFS – in one of several areas where the measurement of income is particularly difficult (Department for Business, Innovation & Skills, 2016b) – it is possible to identify (a) the hourly earnings of employees prior to their move into self-employment, as well as (b) the hourly earnings of those moving from part-time self-employment into an employee job after their move. If earnings are a broad proxy for the skill, capability and productivity of an individual, then this approach permits the use of the broadly defined ‘quality’ of labour moving into or from part-time self-employment. While these results do not necessarily generalise – in particular, inferences cannot be drawn about the earnings of the part-time self-employed as a whole, and cannot account for short-run dynamics which might prompt individuals to change their labour market status – they are suggestive of the broad quality of labour involved in these movements.
This analysis suggests that in general, employees moving into part-time self-employment tend to earn more before making the transition than employees who transition to a new part-time employee job in the same time period. Figure 25 shows pre-transition median hourly earnings for those who move to new part-time self-employment and part-time employee positions each period between 2004 and 2015. In these years, it appears that individuals transitioning to new part-time self-employed positions earned relatively more than individuals transitioning to new part-time employee positions. To the extent that these data capture the quality of labour flowing to part-time employee and self-employed positions, they suggest that in most periods the workers entering part-time self-employment are relatively skilled or experienced, allowing them to command higher earnings.
Figure 25: Median hourly earnings prior to transitioning into part-time self-employment and part-time employee position, ages 16-69
2004 to 2015
Source: Office for National Statistics, Labour Force Survey, five-quarter longitudinal dataset, author’s calculations
Download this chart Figure 25: Median hourly earnings prior to transitioning into part-time self-employment and part-time employee position, ages 16-69
Image .csv .xlsA similar analysis can be conducted for workers who are leaving part-time self-employment. Figure 26 plots the post-move median hourly earnings for individuals who (a) move from part-time self-employment to an employee position, and (b) the earnings of individuals who move from one employee job to another. These estimates are more similar than those for the in-flow into part-time self-employment, but equally suggest that the flow of labour out of the part-time self-employed can command higher earnings as employees than individuals leaving part-time employee positions in the same period. This effect is particularly marked in 2009, 2010 and 2013 – periods in which new-starting employees who were previously self-employed earned considerably more than those who were previously employees. This may reflect a self-selection process in the choice to transition to new employee positions – in which only quite experienced self-employed workers moved to new employee positions during periods of labour market disquiet.
Figure 26: Median hourly earnings after transitioning from part-time self-employment and part-time employee positions to new employee positions
2004 to 2015
Source: Office for National Statistics, Labour Force Survey, five-quarter longitudinal dataset, author’s calculations
Download this chart Figure 26: Median hourly earnings after transitioning from part-time self-employment and part-time employee positions to new employee positions
Image .csv .xlsConclusion
This section has set out (a) the characteristics of the part-time self-employed, (b) how these characteristics have changed over the past 15 years and (c) some analysis of their satisfaction with and motivation for being part-time self-employed. It has (d) analysed the gross in-flow to, out-flow from and net flow to part-time self-employment, and provides (e) some descriptive work examining the quality of labour – as proxied by earnings – which has transitioned to and from part-time self-employment in recent years.
The data presented here indicate that part-time self-employment accounts for a large fraction of the growth in both the absolute number of self-employed workers, and the self-employment share of all employment over the last 15 years. This analysis suggests that the part-time self-employed are a relatively diverse group with differing aims and objectives. In particular, part-time self-employment appears to have become a positive choice for older workers who are apparently managing their transition out of the workforce. Although there is evidence of this process being underway from the early 2000s, the economic downturn in 2008 appears to have strengthened this trend. A large number of these older workers are similarly content to work part-time and be self-employed, and very few are seeking alternative work. In sum, the data presented here make it difficult – although not impossible – to characterise these older workers as suffering from a form of "disguised unemployment".
For other age groups and for younger men in particular, the picture is a good deal less clear. Among these workers there is more evidence of dissatisfaction with their labour market status, with a larger fraction reporting that they would prefer not to be part-time. A larger portion of these workers also appear to have moved directly from unemployment into part-time self-employment – which may be an indication of a choice made under difficult circumstances. However, this group has made a relatively modest contribution to the growth of part-time self-employment over recent years. Among younger women – who have made a larger contribution – the evidence is consistent with this group making a relatively positive choice about their employment mode. The precise reasons for this are difficult to establish, but it seems likely that the relative flexibility of part-time self-employment may play an important role.
Notes:
- For instance, workers may choose to become part-time self-employed on account of a recent fall in earnings which makes their economic position materially worse, or they may choose to become employees because their earnings potential is significantly greater within a corporate entity than running their own. In both cases, the ‘quality’ of labour transitioning to or from part-time self-employment would be understated.
7. Trends in full-time self-employment
Full-time self-employment accounted for around 78% of total self-employment in 2001, or around 2.6 million workers. Over the last 15 years, this number has increased by around 25% to 3.2 million, and as a result, full-time self-employment accounted for around half of the absolute growth in aggregate self-employment over this period. However, a large portion of this growth is explained by changes in the aggregate number of workers in the population. Full-time self-employment accounted for 9.2% of total employment in 2001 and on this basis has been fairly stable over the last 15 years. It increased steeply to 9.9% in 2004, before stabilising at around 10% for the 9 years between 2004 and 2013 (Figure 27). A further steep rise in 2014 has left the employment share of self-employment at 10.5% in Q1 2016, around 1.3 percentage points higher than 15 years earlier.
Figure 27: Full-time self-employed share of employment and hours
Quarter 1 (Jan to Mar) 2000 to Quarter 1 (Jan to Mar) 2016
Source: Office for National Statistics, Labour Force Survey, cross sectional datasets, author’s calculations
Download this chart Figure 27: Full-time self-employed share of employment and hours
Image .csv .xlsTotal hours worked by the full-time self-employed have broadly followed the trend set by the full-time self-employment share over this period. Unlike part-time self-employment – whose share of employment exceeds its share of hours worked – full-time self-employment accounts for a larger portion of hours than of employment as a consequence of the longer average hours of this group. The gap between these two shares of between 2.5 and 3.0 percentage points has also been fairly stable over this period, indicating that the trend in average hours worked has broadly followed average hours worked as a whole.
Who are the full-time self-employed?
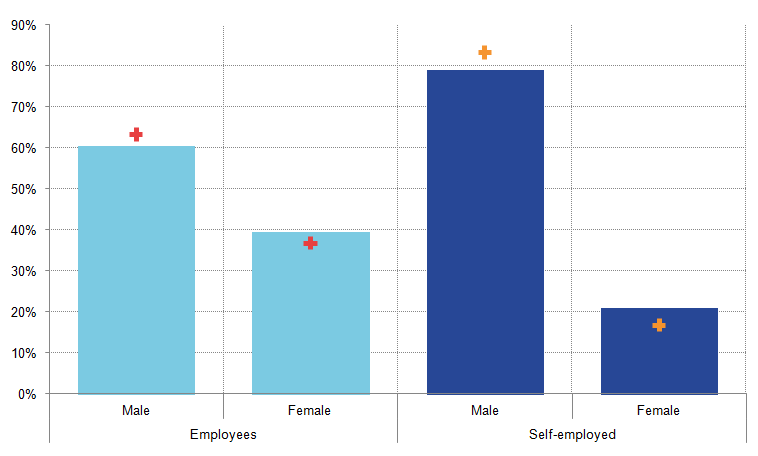
Full-time self-employment is composed of a much larger fraction of male workers than either full-time employees or the part-time self-employed (Figure 28). The ratio of male to female workers was approximately 2:1 for full-time employees in 2001, and around 2:3 for part-time self-employment, while the same ratio for full-time self-employment was closer to 4:1 in the same period. These ratios moderated slightly by 2015, although full-time self-employment remains highly skewed towards men.
Figure 28: Proportion of full-time employment and self-employment accounted for by males and females 2001 (points) and 2015 (bars), Percentage
Source: Office for National Statistics, Labour Force Survey, cross sectional datasets, author’s calculations
Download this image Figure 28: Proportion of full-time employment and self-employment accounted for by males and females 2001 (points) and 2015 (bars), Percentage
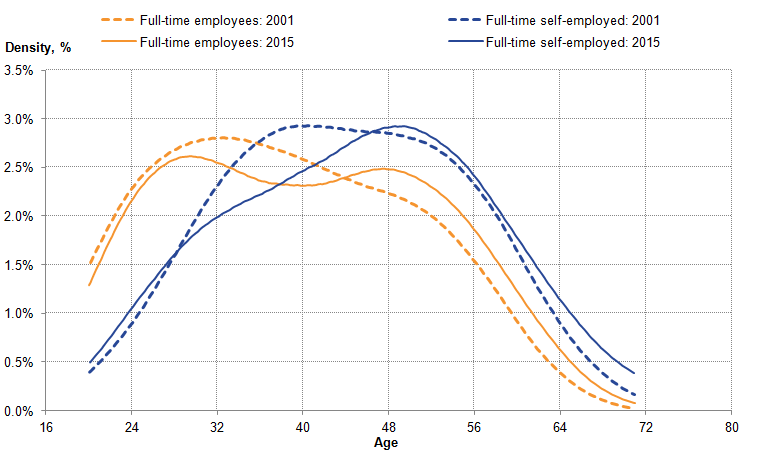
.png (12.7 kB) .xls (26.1 kB)The age profile for full-time self-employment suggests that this group is considerably older on average than full-time employment (Figure 29). Up to the mid-30s, the density of full-time employees was greater than the density of full-time self-employment in 2015, after which the effects switch around; Workers above this age account for a larger share of the full-time self-employed than the share of full-time employees. Between 2001 and 2015, both distributions have shifted to the right, indicating an ageing of both groups. While the story is less clear than among the part-time self-employed, the mass of the full-time self-employed distribution has clearly shifted from workers between 30 and 45 towards those aged 50 and above. Some portion of this ageing appears to have taken place during the recent economic recovery. The fraction of full-time self-employed workers aged 65 and above increased markedly around 2010 and has continued to grow. Conversely, the middle aged category (35-44) of full-time self-employed workers has followed a downward trend, declining following the economic downturn.
Figure 29: Distribution of full-time employment and full-time self-employment by age
2001 and 2015, Density, %
Source: Office for National Statistics, Labour Force Survey, cross sectional datasets, author’s calculations
Notes:
- This analysis is based on a kernel density estimate, using a bandwidth parameter of 3.5. Points at which an unweighted density implies an observation size of less than 10 have been excluded to avoid disclosure.
Download this image Figure 29: Distribution of full-time employment and full-time self-employment by age
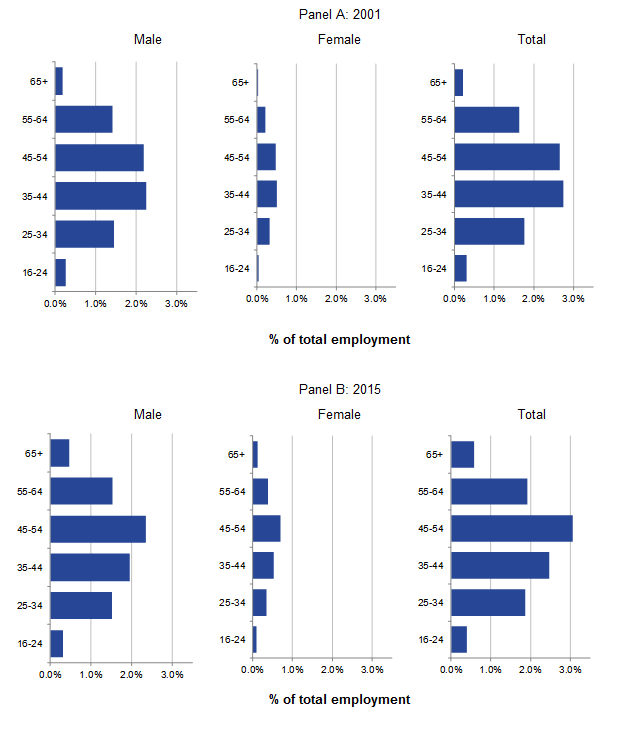
.png (29.0 kB) .xls (92.7 kB)While these trends are suggestive, combining the age and sex mix of the full-time self-employed workers is less revealing about the nature of full-time self-employment than the equivalent part-time self-employment picture (Figure 30, Panel A, vs Figure 10, Panel A). The dominance of males is clear, but the age distributions of men and women in 2001 are fairly well matched. Self-employment appears to peak for both groups at a broadly similar age – among workers in between their mid-30s and mid-50s. By 2015, the distribution has shifted slightly towards older age groups for both men and women (Figure 30, Panel B).
Figure 30: Share of total employment by age group accounted for by full-time self-employed males, females and total
Percentage, 2001 and 2015
Source: Office for National Statistics, Labour Force Survey, cross sectional datasets, author’s calculations
Download this image Figure 30: Share of total employment by age group accounted for by full-time self-employed males, females and total
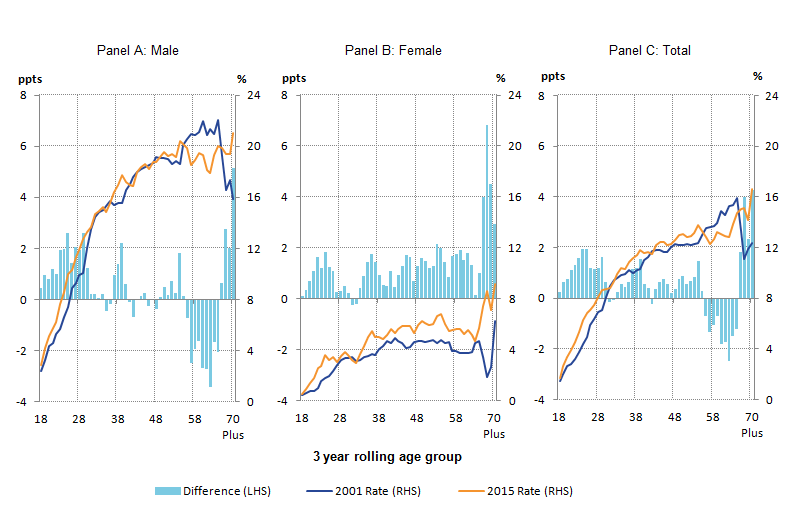
.png (19.8 kB) .xls (28.2 kB)While these developments partly reflect changes in the age and sex structure of the UK’s working population, there is also some evidence of a shift in the full-time self-employment propensity of different age groups. Figure 31 – which parallels Figure 11 – suggests that the propensity of people to be full-time self-employed tends to grow with age, with both the 2001 and 2015 profiles rising with the age of respondents. Among men, the ratio of full-time self-employment to total employment in 2015 is slightly higher than in 2001 among workers aged up to 30, and varies relatively little between the ages of 30 and 50. However, among older male workers, the prevalence of full-time self-employment appears to have varied considerably over this period. Among women, while the profile in 2015 is broadly similar to that in 2001, it is higher across all age groups, and particularly so among the oldest workers.
Figure 31: Rate of Full-time self-employment among total employment by age and sex
Percentage and percentage points, 2001 and 2015 (lines) and change between 2001 and 2015 (bars)
Source: Office for National Statistics, Labour Force Survey, cross sectional datasets, author’s calculations
Notes:
- A 3 year rolling age group is used at each age point, for example the point at age 18 represents the range 18 to 20 years old. Except at point 70 plus.
Download this image Figure 31: Rate of Full-time self-employment among total employment by age and sex
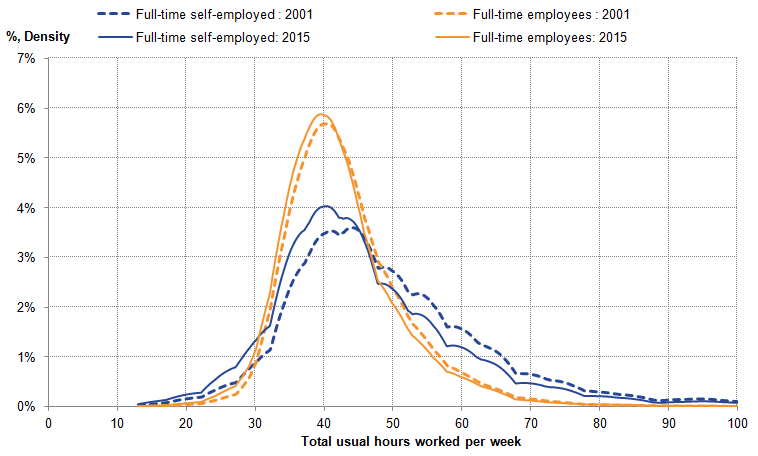
.png (39.3 kB) .xls (41.5 kB)The aggregate labour supply provided by the growing number of full-time self-employed workers is amplified by the relatively long average usual hours that these workers report. While the majority of full-time self-employed workers and full-time employees have usual working weeks of between 35 and 45 hours, a larger fraction of the full-time self-employed work longer weeks of between 50 and 70 hours (Figure 32). Between 2001 and 2015 these differences have narrowed slightly: the length of the working week for full-time employees has shifted leftwards marginally, while the density of full-time self-employed working less than 50 hours has increased at the expense of those working weeks of more than 50 hours. The reason for the longer average working weeks of full-time self-employed workers is difficult to establish, with the pattern cutting across workers in different industries and occupations, by age and sex.
Figure 32: Distribution of usual full-time hours, employees and self-employed
2001 and 2015, Density, %
Source: Office for National Statistics, Labour Force Survey, cross sectional datasets, author’s calculations
Notes:
- This analysis is based on a kernel density estimate, using a bandwidth parameter of 3.5. Points at which an unweighted density implies an observation size of less than 10 have been excluded to avoid disclosure.
Download this image Figure 32: Distribution of usual full-time hours, employees and self-employed
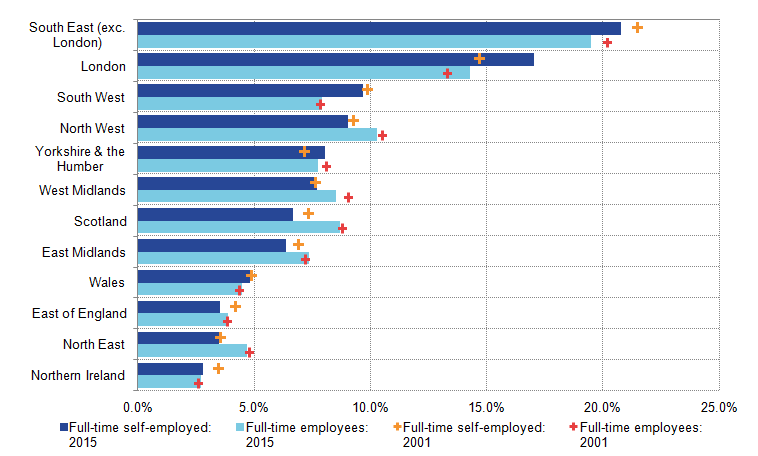
.png (38.2 kB) .xls (103.9 kB)The regional concentration of the full-time self-employed also broadly reflects the regional pattern of full-time employees (Figure 33). Around a third of full-time self-employed workers are located in the South East and London. The share of full-time self-employed accounted for by London has risen from 14.6% to 17.0% between 2001 and 2015. The share of full-time self-employment accounted for by Yorkshire and Humberside has also risen over this period, with corresponding falls in other regions – in particular in Scotland and the North West.
Figure 33: Share of the full-time self-employment and employees by region,
Percentage, 2001 and 2015
Source: Office for National Statistics, Labour Force Survey, cross sectional datasets, author’s calculations
Notes:
- Share of workers full-time self-employed higher among most female age groups, but varied for male.
Download this image Figure 33: Share of the full-time self-employment and employees by region,
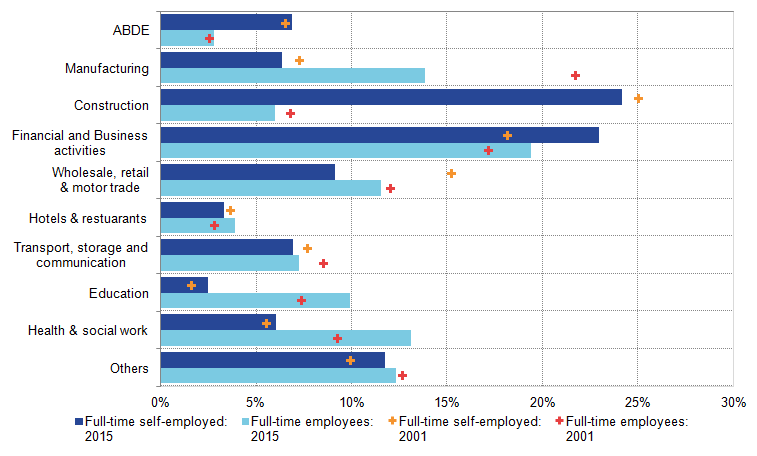
.png (15.3 kB) .xls (28.7 kB)The industrial composition of the full-time self-employed also suggests that, while there has been relatively little change in the aggregate number of these workers, there has been a reallocation of workers between industries (Figure 34). In 2001, the full-time self-employed were concentrated in the construction, financial & business services and wholesale, retail & motor trade industries, which accounted for almost 60% of all of these workers. By 2015, the fraction in finance & business services had grown considerably while the fraction accounted for by construction was little changed. As a result, most other industries saw their shares fall, with a particularly large fall in the wholesale, retail & motor trade industry.
Figure 34: Share of the full-time self-employment and employees by industry
Percentage, 2001 and 2015
Source: Office for National Statistics, Labour Force Survey, cross sectional datasets, author’s calculations
Download this image Figure 34: Share of the full-time self-employment and employees by industry
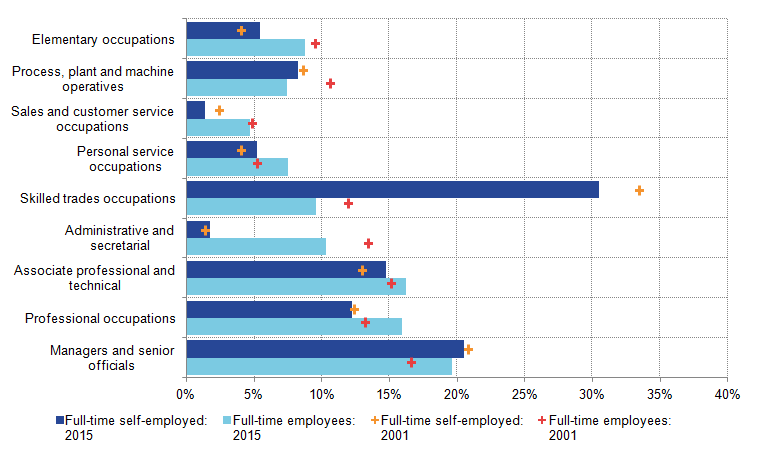
.png (15.0 kB) .xls (28.2 kB)Finally, the full-time self-employed are relatively more concentrated in skilled trades occupations compared with full-time employees (Figure 35). A majority of the full-time self-employed were skilled trades people (30%) or reported being in managerial occupations (20%) in 2015, likely reflecting the nature of their work, their position as businesses owners and their relatively long job-tenure. Markedly fewer full-time self-employed workers are in administrative roles, elementary occupations or sales and customer services occupations. These characteristics are broadly unchanged on the position in 2001.
Figure 35: Share of the full-time self-employment and employees by occupation
Percentage, 2001 and 2015
Source: Office for National Statistics, Labour Force Survey, cross sectional datasets, author’s calculations
Download this image Figure 35: Share of the full-time self-employment and employees by occupation
.png (19.6 kB) .xls (28.2 kB)In summary, this section has shown that number of full-time self-employed workers increased considerably between 2001 and 2015 – accounting for around half the growth in the absolute number of self-employed. However, as this growth rate is relatively close to that of employment as a whole, the full-time self-employed have accounted for a large, relatively stable proportion of total employment over this period. As group, there are many more male than female full-time self-employed workers, and the age composition has got older in recent years. Part of the explanation for this effect appears to have come through demographics, as the ageing population means that there are simply more relatively old workers in the labour market. However, there is also evidence of a rising full-time self-employment propensity among female workers of all ages, younger male workers and older workers of both sexes. While the employment share of full-time self-employment has been relatively stable in recent years, there is also some evidence of reallocation between industries and regions. These workers remain relatively concentrated in the construction trade, but are increasingly specialised in financial & business services. Geographically, a larger portion of them are in London than in 2001, while they remain concentrated in skilled trades occupations, in positions they have occupied – on average – for longer than the representative full-time employee.
Changes in motivation for self-employment
As with part-time self-employment, the Labour Force Survey (LFS) cross-sectional data permit an examination of the extent to which these workers are satisfied with their self-employed status, as well as changes in their job-seeking behaviour. Both of these metrics could permit a greater degree of confidence about the long-term sustainability of the current level of full-time self-employment: if recent growth in this employment mode has been associated with rising levels of worker dissatisfaction, then as the economy continues to recover these workers might be drawn into other forms of employment. By contrast, if workers appear to be relatively satisfied as full-time self-employed workers, then it seems likely that the choice is made on a more positive basis, or at least is serving workers’ objectives.
Figure 36 shows the decomposition of full-time self-employment by age and the reason given for a worker choosing to be self-employed in 2015. Similarly to the analysis in Figure 17 above, this question on the LFS asks why a worker chose to become self-employed – not why they are currently self-employed – and has only been included in the survey for a short period. This limits the analysis that can be conducted and the confidence that can be attached to the results. Among the clearest findings in Figure 36 is that while some workers of all ages report negative reasons for becoming self-employed, they were a minority in each group in 2015. Instead, a majority report positive or neutral reasons for choosing self-employment at every age group.
Figure 36: Reasons for being self-employed among full-time self-employment by age group
Percent of total employment, 2015
Source: Office for National Statistics, Labour Force Survey, cross sectional datasets, author’s calculations
Notes:
- Groups defined as follows: Positive: (a) Saw the demand of the market, (b) Nature of job or chosen career, (c) Better work conditions or job satisfaction. Negative: (a) Redundancy, (b) Could not find other employment. Lifestyle choice: (a) To maintain or increase income, (b) Job after retirement. Neutral: (a) Other, (b) Started or joined a family business.
- Points at which an unweighted density implies an observation size of less than 10 have been excluded to avoid disclosure.
Download this chart Figure 36: Reasons for being self-employed among full-time self-employment by age group
Image .csv .xlsThis absence of a large group of dissatisfied full-time self-employed workers is reflected in their job-seeking behaviour. Figure 37 shows the change in the employment share of full-time self-employment since 2007, as well as contributions to it from those either seeking or not seeking alternative employment. While the changes in the employment share for full-time self-employed workers are more modest than among part-time self-employment, the overall trend is similar: a relatively small proportion of the growth in full-time self-employment can be explained by growing numbers of workers who are seeking alternative jobs.
Figure 37: Change in full-time self-employment as a proportion of total employment, by job seeking status
Change relative to 2007, percentage points, Quarter 1 (Jan to Mar) 2007 to Quarter 4 (Oct to Dec) 2015
Source: Office for National Statistics, Labour Force Survey, cross sectional datasets, author’s calculations
Download this chart Figure 37: Change in full-time self-employment as a proportion of total employment, by job seeking status
Image .csv .xlsAnalysis of full-time self-employment flows
Finally, the longitudinal LFS datasets permit the analysis of flows into and from full-time self-employment, enabling researchers to identify where the inflow of workers arrives from, and to where the outflow is directed. Figure 38 plots the gross in-flow to and out-flow from full-time self-employment since 1999 among workers aged 16-69. It shows that among workers of these ages, the gross in-flows and out-flows have been relatively closely matched over this period, albeit with specific periods of divergence between 2008 and 2012 in particular. Over the period as a whole, Figure 38 suggests that there has been a modest net outflow from full-time self-employment among workers aged 16 to 69 – in contrast to the movement of the headline data. This difference between the net flow and the change in the stock is well known and due to differences in methodology, weighting and coverage. In particular, the longitudinal datasets exclude workers aged over 70 – which may have been particularly important for recent changes in full-time self-employment –helping to give rise to this discrepancy. Clearly, this constraint places limits on the conclusions that can be drawn for the full-time self-employed as a whole.
Focussing on the majority of full-time self-employment which is aged between 16 and 69, changes in full-time self-employment also appear to have been driven by movements in the outflow: while the inflow has risen gradually over the last few years, variation in the outflow has been considerable. Immediately following the economic downturn, the gross outflow increased considerably - largely as a consequence of a substantial number of full-time self-employed workers moving into unemployment. Of the almost 1.5 percentage point increase in the outflow, almost half is accounted for by changes in the gross outflow to unemployment. During the economic recovery which followed, the outflow moderated as the flow of full-time self-employed workers becoming unemployed returned to broadly its pre-downturn rate. Instead, the outflow was supported by a gross outflow from full-time to part-time self-employment.
Figure 38: Gross inflow and outflow to and from full-time self-employment as a fraction of all self-employed workers
Quarter 4 moving average, Quarter 1 (Jan to Mar) 1999 to Quarter 4 (Oct to Dec) 2015
Source: Office for National Statistics, Labour Force Survey, two-quarter longitudinal dataset, author’s calculations
Notes:
- Changes in the aggregate flows sourced from the longitudinal LFS may be different to changes measured in stock of self-employed workers. This is due to methodological and sampling differences in the datasets. Prior to Q3 2001 the age for women in the longitudinal datasets was 16-59 and men 16-64. From Q3 2001 onwards, the age range for all is 16-69.
Download this chart Figure 38: Gross inflow and outflow to and from full-time self-employment as a fraction of all self-employed workers
Image .csv .xlsFigure 39 examines the net-flows implied by these data. It shows contributions to the net flow into this mode of employment arising in the net movements from unemployment, employment and inactivity, paralleling Figure 20. It indicates that the steady net outflow over this period is a result of the net flows to inactivity and part-time self-employment exceeding the more modest net inflows from employment and unemployment – and of these the movement from employment is usually large relative to the movement from unemployment.
Figure 39: Composition of the net flow by previous labour market status, proportion of self-employed
Quarter 1 (Jan to Mar) 1999 to Quarter 4 (Oct to Dec) 2015
Source: Office for National Statistics, Labour Force Survey, two-quarter longitudinal dataset, author’s calculations
Notes:
- Changes in the aggregate flows sourced from the longitudinal LFS may be different to changes measured in stock of self-employed workers. This is due to methodological and sampling differences in the datasets. Prior to Q3 2001 the age for women in the longitudinal datasets was 16-59 and men 16-64. From Q3 2001 onwards, the age range for all is 16-69.
Download this chart Figure 39: Composition of the net flow by previous labour market status, proportion of self-employed
Image .csv .xlsThe clearest change in the net inflow to full-time self-employment occurred during the economic downturn, when flows from a range of different statuses changed. The usually positive flow of employees into full-time self-employment appears to have dried up over this period – possibly indicating the risk aversion of workers in the face of uncertainty about future demand – and growth in the number of full-time self-employed becoming unemployed more than offset the growing inflow from unemployment.
During more recent times, the recovery in the net flow has been a consequence of three developments. Firstly, employees started to move into full-time self-employment again in 2010 and 2011. Then following a brief fall, this flow has been larger in the last two years than at any point since 1999. Secondly and offsetting this development, the increased rate of churn between full-time and part-time self-employment has taken a considerable length of time to settle down following the downturn. Although it has now broadly returned to its pre-downturn rate, the net-outflow to part-time self-employment has held down the growth of this status in recent years. Thirdly, changes in the flow to inactivity have had a considerable bearing on the overall net inflow during this period – possibly reflecting the unwinding of deferred retirement during the economic downturn itself.
As with part-time self-employment, the longitudinal flows data also provide a means of examining the earnings of workers moving to and from full-time self-employment as a broad proxy for the skills, experience and earnings potential of this group. While inferences cannot be drawn about the earnings of the full-time self-employed as a whole, the results of these analyses can be instructive. Figure 40 shows the pre-transition median hourly earnings for (a) employees who move to a new full-time self-employed position within a year and (b) employees who move to a new employee position over the same time period. In the pre-downturn period, median hourly earnings for those moving to full-time self-employment were slightly higher but broadly comparable to that of individuals moving to new employee positions. However, with the exception of 2011, there is some evidence that higher earners continued to move into full-time self-employment – possibly capturing the willingness of more capable workers to take the risk of changing employment status during the downturn. This effect appears to have been reversed in 2014 and 2015 – with the two distributions moving back together. With the exception of this downturn period, the longitudinal data on earnings prior to transition for full-time self-employment suggest that – to the extent that earnings capture information about the quality of labour – the flow into full-time self-employment from employment is of a broadly similar calibre to those starting a new employee position.
Figure 40: Median hourly earnings prior to transitioning into full-time employee position and self-employment, ages 16 to 69
2004 to 2015
Source: Office for National Statistics, Labour Force Survey, five-quarter longitudinal dataset, author’s calculations
Download this chart Figure 40: Median hourly earnings prior to transitioning into full-time employee position and self-employment, ages 16 to 69
Image .csv .xlsFinally, Figure 41 shows similar median hourly earnings measures for the post-transition earnings of workers moving from full-time self-employment and full-time employee positions to new employee positions. They suggest that – consistent with the analysis above – these two groups of workers can command broadly similar earnings as employees, indicating that the quality of labour leaving full-time self-employment is similar to the quality of employee leavers in the same period.
Figure 41: Median hourly earnings for those moving to new employee positions from a full-time employee position and full-time self-employment, ages 16 to 69
2004 to 2015
Source: Office for National Statistics, Labour Force Survey, five-quarter longitudinal dataset, author’s calculations
Download this chart Figure 41: Median hourly earnings for those moving to new employee positions from a full-time employee position and full-time self-employment, ages 16 to 69
Image .csv .xlsConclusions
This section has set out (a) the characteristics of the full-time self-employed, (b) how these characteristics have changed over the past 15 years and (c) some analysis of their satisfaction with their labour market status. It has (d) analysed the gross inflow to, outflow from and net flow to full-time self-employment, and examines (e) the earnings of workers who have transitioned to and from full-time self-employment in recent years as a proxy for the broad ‘quality’ of the labour supplied.
The data presented in this section suggest that full-time self-employment grew considerably over the 2001 to 2015 period – accounting for close to half the absolute growth in total self-employment. However, as much of this growth is accounted for by growing number in employment, its share of total employment has been relatively stable over this period. Alongside these developments, there is some evidence that full-time self-employed workers have shifted in their composition over this period. As a group, the full-time self-employed are composed of more workers who are older and of slightly more female workers in 2015 than in 2001 – although males continue to dominate this form of employment. There is some evidence that they have shifted away from some traditional forms of self-employment – in particular in the wholesale, retail & motor trades industry – and towards finance & business services, although construction remains as important to this group in 2015 as it was in 2001. The full-time self-employed work relatively long hours – giving them a larger share of hours worked than employment – and are now more concentrated in London than in previous years.
These results also suggest that a majority of the full-time self-employed are broadly content with their labour market status. While some workers of all ages report negative reasons for being self-employment, a majority report either positive or neutral reasons for their choice and the degree of reported job-seeking behaviour is very small and little changed on its level in 2001, or compared with the pre-downturn period.
Analysis of the longitudinal data on full-time self-employment provide further evidence that, while the employment share of this group has changed relatively little over the last 15 years, there are some complex dynamics taking place under the surface. Among the clearest of these results is that full-time self-employment usually benefits from a net inflow from employees and from unemployment – although both of these flows were reversed during the economic downturn. Among workers aged 16 to 69, this inflow has been balanced by a larger net outflow to part-time self-employment and – more recently – to inactivity. The flows data also suggest that the earnings potential of workers joining the ranks of the full-time self-employed and those moving out of this status is broadly similar to employees starting new positions in the same time period.
Nôl i'r tabl cynnwys8. Conclusions & discussion
The performance of the labour market and growth of self-employment have been among the defining characteristics of the UK’s recent economic recovery. The headline employment rate – which fell from 73.0% in Q1 2008 to 70.1% in Q3 2011 – recovered relatively quickly, aided in part by strong growth in self-employment. By Q1 2016, the employment rate had risen to a record high of 74.2%, and just over 4.5 million workers were self-employed. This growth, the strength of employment relative to output and the resulting weakness of labour productivity pose a particular challenge to our understanding of the UK labour market. This paper examines the rise in self-employment through a range of official statistics with the aim of unpacking some of the key drivers of this phenomenon.
Taking the 2008 to 2015 period as a whole, the level of self-employment increased by around 730,000: from 3.8 million to 4.5 million. Of this increase, around half was accounted for by full-time self-employment, and around half was accounted for by part-time self-employment. While it is tempting to ascribe this development to the circumstances of the economic downturn and recovery – and it may have played a part – this paper finds that these trends are better seen as a continuation of an existing, pre-downturn trend. Taking the 2001 to 2015 period as a whole -when the level of self-employment increased from 3.2 million to 4.5 million – roughly half of the increase was accounted for by full-time, and around half by part-time self-employment.
Secondly, this paper finds that part-time self-employment has played an important role in raising the prevalence of self-employment as a whole. The number of workers in this mode of employment grew by 88% between 2001 and 2015 – compared with 25% for full-time self-employment. As a result, part-time self-employment accounts for 1.2 percentage points of the 1.6 percentage point increase in the share of all employment accounted for by self-employment between 2008 and 2015. While full-time self-employment continues to account for the majority of self-employed workers, but with the exception of a few, specific periods – in 2003 and 2014 in particular – its share of employment and hours has relatively stable over the last 15 years.
While part-time self-employment has become considerably more prevalent over the past 15 years, there are several trends which are common to both the full- and part-time modes. Both groups of workers have seen their age profile get markedly older in recent years. Among both sets of workers a growing number work in the finance & business services industry, with changes in usual hours worked following broadly the trends of employees. In both groups the incidence of higher occupations and long-tenures is above that of employees, and both groups are concentrated in the South East and London – with full-time self-employed workers in particular becoming more concentrated in the capital.
The evidence presented here also suggests that, in general, self-employed workers are broadly content with their labour market status. Among older part-time self-employed workers in particular, there is little evidence of workers wanting a full-time position, of job search or of dissatisfaction with their self-employed status. Analysis also suggests that those moving from employee positions to self-employment tend to have somewhat higher pre-transition hourly earnings than workers moving to new employee positions: trends which are more consistent with workers making a positive choice, rather than being forced through economic necessity to be self-employed. Among younger and mid-aged self-employed women – in particular those working part-time – the growth in the incidence of self-employment has not been accompanied by growth in the number of people who would prefer to work full-time, nor a clear uptick in the number of workers seeking an alternative job. Among younger part-time self-employed men, however, the picture is less certain. Larger portions of these workers display a greater degree of dissatisfaction with their part-time status and appear to have come directly from unemployment – possibly indicating a choice made under economic hardship. It is among these workers that evidence of under-employment is strongest.
The paper has also identified a range of labour market dynamics using the longitudinal component of the Labour Force Survey. These analyses suggest that self-employment as a whole tends to benefit from a net inflow from unemployment and from among employees, which offsets a net outflow to inactivity (Figure 42). During the economic downturn, the net flows from unemployment and from among employees fell markedly, leading to a brief net outflow from self-employment as a whole. During the recovery which followed, the net inflow from unemployment was larger – and focussed mostly on transitions to part-time self-employment – while inflows among former employees have been more focussed on transitions to full-time self-employment, and peaked during 2014. The outflow to inactivity has also declined markedly since the downturn – largely as a consequence of lower net outflows from part-time self-employment. This final result is particularly striking given the age mix of the self-employed, which has shifted towards older workers over the recent years.
Figure 42: Composition of the net flow to self-employment by former labour market status, proportion of all self-employed workers, ages 16 to 69
Quarter 1 (Jan to Mar) 1999 to Quarter 4 (Oct to Dec) 2015
Source: Office for National Statistics, Labour Force Survey, two-quarter longitudinal dataset, author’s calculations
Notes:
- Changes in the aggregate flows sourced from the longitudinal LFS may be different to changes measured in stock of self-employed workers. This is due to methodological and sampling differences in the datasets.
Download this chart Figure 42: Composition of the net flow to self-employment by former labour market status, proportion of all self-employed workers, ages 16 to 69
Image .csv .xlsAlongside these flows between other parts of the labour market and self-employment, the paper has also identified a range of intra-self-employment flows. In particular, the paper identifies rising "churn" between full-time and part-time self-employment, and while these movements do not affect the aggregate number of self-employed workers, they are instructive. To some extent, this development likely reflects changes in labour supply brought on by changes in demand conditions: in much the same way that some full-time employees worked shorter hours in response to a fall in demand during the economic downturn, self-employed workers appear to have done the same. However, older workers are also much more likely to make the transition from full-time to part-time self-employment than younger workers, and account for a large portion of the growth in this employment mode in recent years. These transitions rarely involve a change of industry or occupation, consistent with workers simply cutting their hours rather than seeking a new line of work. These trends suggest that some of the rise in part-time self-employment category is to do with workers managing their retirement in a different manner. A larger number of older workers – and the full-time self-employed in particular – appear to be choosing to enter part-time self-employment, rather than retiring directly. This in turn increases the level of participation – consistent with the analysis presented in Figure 4 – and the flow from full-time to part-time self-employment, while dragging on the out-flow to inactivity.
It is difficult to be sure whether these moves are a positive choice or a matter of economic necessity, but the evidence presented here is more consistent with the former.
What do these findings mean for the UK labour market and what implications are there for the degree of spare capacity? The results here broadly support and develop the findings of earlier papers (Tatomir, 2015), (ONS, 2014), that the recent growth of self-employment is a continuation or perhaps, an amplification, of a pre-existing, pre-downturn trend. Much of the recent growth is among a group of older workers – many of whom report broadly positive reasons for choosing to be part-time and self-employed. Much of the growth in this mode of employment also appears to be among workers managing their transition out of the labour market: choosing to work part-time for a period before moving to retirement. As a consequence, these data suggest that the growth of part-time self-employment, in particular among older workers, is a structural feature of the UK labour market which is unlikely to unwind as the economic recovery continues. Among younger workers the evidence is less clear. To the extent that the increase in dissatisfaction among younger male self-employed workers reflects under-employment, some of these efforts may in time be redeployed to different uses as the recovery progresses.
Nôl i'r tabl cynnwys9. References
Craig, L., Powell, A. & Cortis, N., 2012. Self-employment, work-family time and the gender division of labour. Work Employment & Society, 26(5), pp. 716-734.
Department for Business, Innovation & Skills, 2016a. Understanding self-employment. [Online] Available at: https://www.gov.uk/government/uploads/system/uploads/attachment_data/file/500305/understanding-self-employment.pdf [Accessed 15 June 2016].
Department for Business, Innovation & Skills, 2016b. The income of the self-employed. [Online] Available at: https://www.gov.uk/government/uploads/system/uploads/attachment_data/file/500317/self-employed-income.pdf [Accessed 15 June 2016].
ONS, 2014. [Online] Available at: http://webarchive.nationalarchives.gov.uk/20160105160709/http://www.ons.gov.uk/ons/rel/lmac/self-employed-workers-in-the-uk/2014/rep-self-employed-workers-in-the-uk-2014.html [Accessed 2016 June 2016].
ONS, 2015a. Labour Force Survey – user guidance. [Online] Available at: http://webarchive.nationalarchives.gov.uk/20160105160709/http://www.ons.gov.uk/ons/guide-method/method-quality/specific/labour-market/labour-market-statistics/index.html [Accessed 15 June 2016].
ONS, 2016a. Economic Review: January 2016. [Online] Available at: http://www.ons.gov.uk/economy/nationalaccounts/uksectoraccounts/articles/economicreview/january2016#distribution-of-productivity [Accessed 13 June 2016].
ONS, 2016b. GDP and the Labour Market: Q3 2015 quarterly update. [Online] Available at: http://www.ons.gov.uk/economy/economicoutputandproductivity/productivitymeasures/articles/gdpandthelabourmarket/q32015quarterlyupdate [Accessed 14 June 2016].
ONS, 2016c. Annual Mid-year Population Estimates: 2014. [Online] Available at: https://www.ons.gov.uk/peoplepopulationandcommunity/populationandmigration/populationestimates/bulletins/annualmidyearpopulationestimates/2015-06-25#how-does-the-population-structure-of-the-uk-compare-to-10-years-ago [Accessed 14 June 2016].
Tatomir, S., 2015. Self-employment: what can we learn from recent developments?. Bank of England Quarterly Bulletin 2015 Q1, pp. 56-66.
Nôl i'r tabl cynnwys
