Cynnwys
- Disclaimer
- Main points
- Transformation of population and migration statistics
- Creating admin-based population estimates (ABPE)
- Linkage of ABPE V3.0 2011 to 2011 Census records
- Potential overcoverage by activity type
- Reasons for overcoverage
- Potential ABPE inclusion rule changes
- Trialling inclusion rule changes
- Undercoverage in ABPE V3.0
- Coverage survey and estimation research
- Summary and next steps
- Related links
- Annex 1: Estimating the numbers of missed links
1. Disclaimer
These Research Outputs are not official statistics on the population nor are they used in the underlying methods or assumptions in the production of official statistics. Rather, they are published as outputs from research into a methodology different to that currently used in the production of population and migration statistics. These outputs should not be used for policy- or decision-making.
Nôl i'r tabl cynnwys2. Main points
Our latest version of the admin-based population estimates (ABPE) generally showed lower estimates than the 2011 Census, suggesting that the design had been successful in its main aim of reducing the overcoverage seen in earlier versions. Despite reducing the net overcoverage patterns seen in ABPE Version (V)2.0, our analysis finds there are still records in ABPE V3.0 that are not in the census estimates, suggesting overcoverage remains.
Some reasons for this overcoverage might be the inclusion of emigrants and short-term residents who have recent admin data activity but are either no longer resident or are not resident for sufficient time to meet the definition for inclusion in our population estimates.
Our rules using new registrations on NHS and higher education datasets appear to disproportionately introduce overcoverage. We have found that they are the main contributors to overcoverage caused by short-term residents.
Rule changes to target these causes appear to remove a substantial proportion of overcoverage, but introduce some further undercoverage as a result. There is potential in future for further optimisation of the rules, but additional data sources are also expected to be available, such as PAYE-RTI (Pay As You Earn - Real-Time Information), that will provide a greater level of detail on periods of activity such as employment.
We have also analysed groups of the working age population that are frequently missed from ABPE V3.0. Census characteristics show that substantial numbers of self-employed people and those in full-time education but not at higher education institutions are excluded, and we will aim to use additional data sources to cover these groups in future. People who are not working or studying because they are "looking after their home or family" according to the census, are less likely to be captured in our existing rules. Further understanding of how these people interact with admin sources, or how they are related to other household members who are interacting with them, may help us to improve our methods further.
Our analysis shows that overcoverage remains, and it is likely to be difficult to remove entirely. Therefore to address this we are undertaking research into a range of estimation methods, including different forms of dual-system estimation, that are more compatible with the ABPE coverage patterns. The analysis in this article and work to better understand the quality of the administrative data sources will inform this research.
Nôl i'r tabl cynnwys3. Transformation of population and migration statistics
We are transforming the way we produce population and migration statistics to better meet the needs of our users and to produce the best statistics from the best-available data. For information on this transformation see our overview of the transformation of the population and migration statistics system.
The analysis in this article advances the previous research we have undertaken to produce estimates on the size of the population using administrative data, previously known as a Statistical Population Dataset (SPD), but referred to as admin-based population estimates (ABPE) from our most recent publication onwards.
This article shares further analysis of the national coverage patterns for the ABPE Version (V)3.0 approach for producing admin-based population estimates using activity-based rules. We recognise that more work is required to refine and develop the methodology, and to understand the quality of estimates. A further analysis of the ABPE V3.0 estimates for lower geography levels is published alongside this article, and another report outlines research to determine uncertainty around the ABPE estimates. We also have a programme of future work designed to understand the quality of individual data sources and better understand linkage across sources.
As in our previous research, our methodology is based on anonymously linking person records on administrative datasets to construct administrative-based population estimates. For information about our previous methodologies, please see SPD V1.0 and SPD V2.0 methodology reports.
For further information on the data sources included in these Research Outputs see the data source overviews.
We welcome users providing feedback to us on their quality, value or the impact that using these figures would have if they were used in place of official statistics, please contact us: pop.info@ons.gov.uk.
Nôl i'r tabl cynnwys4. Creating admin-based population estimates (ABPE)
In June 2019 we published the results of a new way of creating admin-based population estimates (ABPE) using a wider range of data sources and an “activity”-based approach using recent signs of life in admin sources.
ABPE Version (V)3.0 uses a variety of “activity” sources including: health, tax, benefits and education data, to determine whether a record should be included in the estimate for the population. The aim was to reduce the overcoverage seen in previous ABPE versions, an artefact of people no longer being present in the population but having records remaining on admin data.
Our results showed the ABPE V3.0 generally has net undercoverage compared with official population estimates, and the results are comparable with unadjusted counts of census responses. Aggregate comparisons will not reveal competing undercoverage and overcoverage patterns that underlie the net coverage patterns, however. Understanding these is crucial for further ABPE development.
We previously outlined our intention to combine the ABPE with a population coverage survey (PCS) and an estimation method to correct for coverage errors and produce high-quality estimates. One option for estimation is the existing dual-system estimation (DSE) method used for the census. This would require an ABPE containing negligible incorrectly included records (overcoverage), so analysis is needed to determine if this assumption could plausibly be met . As discussed in Section 11 , we are also investigating alternative estimation methods, which may have different assumptions. Gaining understanding of the likely coverage patterns will aid in the selection and development of feasible methods and indicate the likely quality of the population size estimates from different approaches.
Over the longer-term, given access to new data sources and improved methods, it may be feasible to produce accurate population estimates using an ABPE without estimation applied. Analysis of undercoverage and overcoverage is also essential for this aim, to ensure that the correct records are included. Even if accurate population estimates can be produced, any records incorrectly included or excluded are likely to cause inaccurate results if the ABPE is used as a basis for more detailed statistics such as population characteristics.
In this article, we focus on understanding the gross patterns of undercoverage and overcoverage in ABPE V3.0, using record-level linkage to census responses to do this. We then aim to modify the ABPE inclusion rules to understand how far overcoverage can be minimised using the current data. We then discuss ABPE undercoverage and the development of a population coverage survey and estimation methodology to enable us to produce population estimates that meet the needs of our users.
Nôl i'r tabl cynnwys5. Linkage of ABPE V3.0 2011 to 2011 Census records
We have linked records in admin-based population estimates (ABPE) Version (V)3.0 2011 to the 2011 Census responses and analysed the linked and unlinked records in both datasets. Linkage is subject to errors where links are incorrectly made between unrelated records (false positives) and where links between related records are missed (false negatives).
Previous evaluation of linking Patient Register and census records showed false positive rates usually below 0.5%, with false negatives usually above 2% (PDF, 319KB). In future, planned improvements to our linkage methods and refinements of our “activity” based rules are likely to result in lower error rates.
Creating an ABPE dataset, and subsequently linking it to census, is the result of combining links from multiple pairs of sources in a way that resolves inconsistencies, as described in the ABPE V2.0 methodology report. Linkage errors from each pair of sources will accumulate, but the combination process allows many to be discovered and resolved. Therefore the error rates for the linkage between ABPE V3.0 and census are likely to differ to those mentioned previously, but false negatives are expected to be considerably higher than false positives. As discussed later, some estimates of false negatives can be made and this is essential to estimate overcoverage in the ABPE. In the current scenario, however, there is no method to estimate the false positives and these must be assumed to be negligible.
The linkage used all available census responses to link to ABPE V3.0, the vast majority of which are usual residents who are included in the official census population estimates. In addition, there are two types of non-usual resident records included. Students and schoolchildren who live at different addresses during term-time and holidays are recorded as usually resident at their term-time address, but an additional record is also collected at their non-term-time address. It is possible that either of these two records could be linked to an ABPE V3.0 record, so both types were included.
The census also collected responses from short-term residents, who are not usual residents, and these were also included in the linkage to investigate their presence in ABPE V3.0.
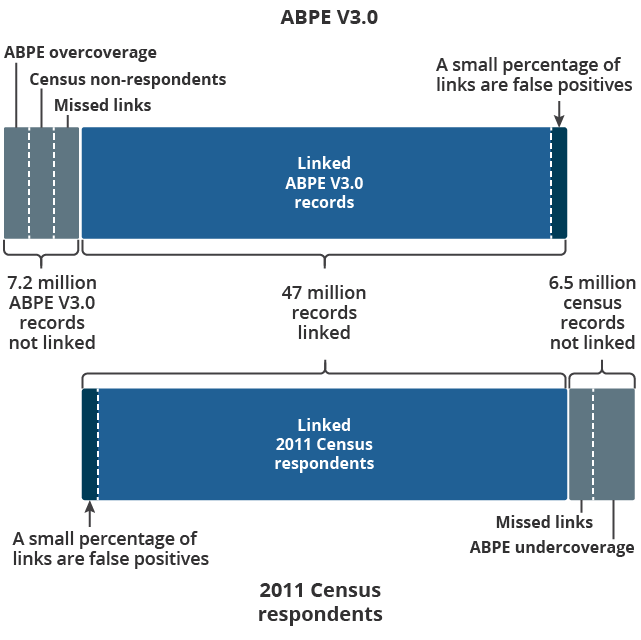
Apart from a small number of short-term residents, which are discussed later, where records appear in both the census responses and ABPE we therefore assume our inclusion rules have worked correctly. If no census response is found for an ABPE record, however, this may be because of one of three possibilities:
missed links (false negatives) between census and admin sources as discussed previously
census non-respondents: the census responses are not a record of the full population, and the admin data and ABPE will capture many of those who did not respond
ABPE overcoverage: record is incorrectly included in the ABPE, and refers to someone who was not a usual resident at the reference date
Figure 1 illustrates these scenarios, showing the numbers of linked and unlinked records.
Figure 1: Illustration of the outcomes of linking ABPE V3.0 records to census respondents
Source: Office for National Statistics
Notes:
- ABPE – Admin-Based Population Estimates
- All census respondents are candidates for linking to ABPE V3.0. As well as usual residents, this includes records for students at their non-term-time address, and short-term residents.
Download this image Figure 1: Illustration of the outcomes of linking ABPE V3.0 records to census respondents
.png (33.0 kB)
Figure 1 shows that no record can be attributed to ABPE overcoverage or undercoverage with certainty, because of the contributions of missed links and census non-respondents. To estimate the size of the ABPE overcoverage at the top-left of the diagram, it is first necessary to understand the approximate contributions from census non-respondents and missed links.
Census non-respondents
The census non-respondents are the best-understood group. They are estimated from the Census Coverage Survey (CCS). Figure 2 shows the differences between the rounded census response counts (shown in this spreadsheet (XLS, 784KB) and rounded final estimates for five-year age groups for males (XLS, 366KB) and females (XLS, 366KB) in England and Wales. Therefore this shows the effect of all post-enumeration adjustments. This contains 1.98 million males (7.2% of the final estimate) and 1.46 million females (5.1% of the final estimate).
Figure 2: 3.4 million people are estimated to have not responded to the census in 2011
2011 Census adjustment for non-response by five-year age group and sex, England and Wales
Source: Office for National Statistics
Download this chart Figure 2: 3.4 million people are estimated to have not responded to the census in 2011
Image .csv .xlsFor these five-year age groups by sex, the final census estimates have 95% confidence intervals of up to 0.61%, with the largest being for males aged 20 to 24 years. This implies that the census non-respondents in this group are likely to be as much as 11,600 higher or lower than estimated. This uncertainty gradually decreases in size for older groups, to around 1,300 records for males aged 85 years and over. The uncertainty for non-responding females varies from around 9,700 records for ages 20 to 24 years, down to around 2,600 for ages 80 to 84 years.
Most of those who did not respond to the census are expected to appear in at least one admin data source, especially sources with high coverage such as the Patient Register (PR) and Customer Information Sytem (CIS). In theory it should therefore be possible for an ABPE to include a large majority of this group, if inclusion rules are chosen to minimise undercoverage. ABPE V3.0 is designed to limit overcoverage, however, and this will mean lower numbers of census non-respondents are likely to be included.
For the remaining analysis of ABPE V3.0, however, we will assume that the census non-respondents captured follow the distributions in Figure 2. This will allow an initial minimum estimate of the amount of overcoverage in ABPE V3.0 to be made.
Missed links between ABPE V3.0 and census
Figure 1 shows that missed links between the ABPE and census must also be accounted for before an estimate of the true ABPE overcoverage can be made. Since the missed links also appear in the unlinked census records on the right side of the diagram, this provides an opportunity to estimate their numbers using unlinked census records if ABPE undercoverage can first be accounted for.
Census usual resident records that link to any of the admin data sources but are not included in the ABPE can easily be identified as undercoverage and removed. The remaining census usual residents that have no links to admin data could all be assumed to be missed links, but this would likely give an overestimate because of some people not appearing on any of the admin sources used.
Alternatively, characteristics variables on the census records can be used to determine if a person is likely to appear on one of the admin sources, and hence is likely to be a missed link. This is not possible for all types of characteristics though, so this method is likely to underestimate the missed links. Since a single precise estimate is not possible, we estimated the missed links using these two methods to show a plausible range of estimates. More detail on these estimates can be found in Annex 1. The age distributions of these two estimates are shown in Figure 3.
Figure 3: Two different estimates of missed links give likely ranges for their numbers
High and low estimates by single year of age for the numbers of missed links between 2011 Census and ABPE V3.0
Source: Office for National Statistics
Notes:
- ABPE – Admin-Based Population Estimates.
- Ages 18 years and below are excluded because of lower confidence in estimating missed links.
Download this chart Figure 3: Two different estimates of missed links give likely ranges for their numbers
Image .csv .xlsFigure 3 indicates total numbers of missed links for adults aged 19 years and over of 1.44 million (3.5% of the ABPE population) for the lower estimate and 1.99 million (4.8% of the ABPE population) for the upper estimate. These two estimates are now used to make corresponding high and low estimates of the ABPE overcoverage.
The missed links peak sharply for student ages, but numbers for students are likely overestimated because of students who live in different addresses in term-time and out-of-term having two census records as discussed earlier. Cases in which a student’s out-of-term record has been linked to the ABPE instead of their usual resident record will appear as missed links in this analysis. A further extension to the analysis is required to determine how often this has occurred and correct for this effect to produce more precise missed links estimates for students.
Estimating overcoverage in ABPE V3.0
Figures 4a and 4b show the numbers of ABPE V3.0 records not linked to census usual residents by five-year age groups for males and females. The estimated contribution of census non-respondents from Figure 2 is also included, and high and low estimates for the combination of census non-respondents and missed links are shown.
For ages 20 to 24 years, the contribution of missed links and census non-respondents appears to be close to or exceeding the total, giving further evidence that the missed links are overestimated for this group. For all other age groups, the numbers of ABPE records not linked to census and not accounted for by census non-response or missed links give an estimate of the overcoverage in the ABPE. This suggests that overcoverage in total is between 1.22 and 1.71 million records for ages 25 years and over.
Although it is difficult to make precise estimates of overcoverage, this analysis suggests that there is a substantial amount, and this must be reduced considerably for compatibility with dual-system estimation. If efforts to remove overcoverage are sufficiently successful, they should result in total numbers of unlinked records lying somewhere below the upper estimate of non-respondents and missed links.
Figure 4a: Census non-response and missed links do not account for all of the ABPE V3.0 records not found on census
ABPE V3.0 records with no link to a census usual resident record by five-year age group, England and Wales, 2011, males
Source: Office for National Statistics
Notes:
- ABPE – Admin-Based Population Estimates.
- Also shown are the maximum expected numbers of census non-respondents, and combined low and high estimates for the contribution of census non-respondents and missed links.
- Age groups containing schoolchildren are excluded because of lower confidence in estimating missed links.
- Missed links for the 20 to 24 years age group are currently expected to be overestimated because of the way students with different term-time and out-of-term addresses are recorded on census.
Download this chart Figure 4a: Census non-response and missed links do not account for all of the ABPE V3.0 records not found on census
Image .csv .xls
Figure 4b: Census non-response and missed links do not account for all of the ABPE V3.0 records not found on census
ABPE V3.0 records with no link to a census usual resident record by five-year age group, England and Wales, 2011, females
Source: Office for National Statistics
Notes:
- ABPE – Admin-Based Population Estimates.
- Also shown are the maximum expected numbers of census non-respondents, and combined low and high estimates for the contribution of census non-respondents and missed links.
- Age groups containing schoolchildren are excluded because of lower confidence in estimating missed links.
- Missed links for the 20 to 24 years age group are currently expected to be overestimated because of the way students with different term-time and out-of-term addresses are recorded on census.
Download this chart Figure 4b: Census non-response and missed links do not account for all of the ABPE V3.0 records not found on census
Image .csv .xls6. Potential overcoverage by activity type
It is also possible to categorise the records not found on the census by their type(s) of admin data activity, to indicate which activity rules may contribute more to the total overcoverage. As discussed previously, census non-respondents and missed links also contribute to the records not found on census, and these contributions may vary for the different activity types. Therefore a high proportion of unlinked records does not automatically lead to the conclusion that an activity rule is poor quality, but gives an indication that this is more likely to be the case.
Table 1 shows the numbers of records with each type of activity and the percentage of each that could not be linked to census usual resident records.
| Activity type | Number of records (millions) | % not linked to census |
|---|---|---|
| PAYE and Tax Credits | 33.2 | 12.0 |
| Benefits | 28.6 | 11.4 |
| Patient Register (PR) | 3.7 | 24.7 |
| HESA | 2.2 | 16.3 |
| School Census | 8.0 | 10.3 |
| Births | 0.7 | 21.3 |
| Has an active relative | 18.5 | 8.7 |
Download this table Table 1: Numbers of records with each type of activity used in ABPE V3.0, and percentage of each not linked to census
.xls .csvThe figures in Table 1 show that the benefits and income data sources contribute the vast majority of records to admin-based population estimates (ABPE) Version (V)3.0, and that the proportion of these records that could not be linked to census is between 11% and 12%. When comparing with the other percentages, these activity rules appear to be of reasonable quality, but relying on these sources for such large numbers of records means they could be important contributors to overcoverage.
Although recent Patient Register (PR) registrations apply to a much smaller set of records, it is striking that almost a quarter of those records could not be linked to the census. Although there may be other reasons, such as this rule capturing many new migrants who may not respond to census because of unfamiliarity or language difficulties, it is possible that it introduces a disproportionate amount of overcoverage, and so should be a high priority for further investigation and possible modification.
The proportion of Higher Education Statistics Agency (HESA) records not linked to census is also relatively high, and any overcoverage introduced will be concentrated within a small number of age groups, so it is also worth examining this further. The births registrations data show an even higher percentage of records not linked to census, but this is largely expected because of evidence that young children are frequently missed from census responses. This is visible for the 2011 Census in Figure 2, where the size of the undercoverage adjustment increases steeply for younger children.
Activity of relatives is used to include people who are inactive on the admin sources used but have evidence that they live with a relative who is active and whose income they share. This is predominately aimed at capturing spouses who rely on the income of their partner, but this indicator can also be assigned to children and parents.
Although 18.5 million people have been identified as having an active relative, this includes people with their own activity as well as those without. Our previous publication shows that only 1.5 million people were added to ABPE V3.0 using this rule alone, with the vast majority already included because of some other activity of their own.
The 1.5 million records added consist predominantly of people aged from their mid-thirties up to retirement age, with slightly more females added than males. To gain a clearer picture of the quality of this rule, it will be necessary to focus analysis on these records with no other activity, as the percentage of those not linked to census may differ substantially from that shown in Table 1.
The overlaps between the different rules, where people have multiple activity indicators, are a particular issue for analysing the impact of this rule, but will also have an effect on the other activity types. Future extension of this analysis to consider groups with a single activity type and those with different combinations of multiple types would provide a deeper understanding of the relative quality of the different rules. These initial findings have, however, provided some guidance on which rules may require modification.
Nôl i'r tabl cynnwys7. Reasons for overcoverage
There are several possible mechanisms by which records may be incorrectly included in the admin-based population estimates (ABPE). These include lags and errors in individual data sources, which may result in false activity appearing on a record or activity being associated with the wrong period of time. We continue to research the quality of the individual sources, constructing data journeys to highlight errors that may occur throughout the process and gain better understanding of the concepts and definitions to evaluate how well they meet our requirements.
Population changes such as migration and deaths are expected to be among the most likely causes of admin data not reflecting the true situation, and how these may affect ABPE Version (V)3.0 is described in this section. It is also possible for the methods of integrating and linking sources together to introduce errors, including overcoverage.
Emigration since last activity
The ABPE V3.0 method was designed using the principle that all records included must show evidence of activity to indicate that the person was resident in the population within the 12 months prior to the ABPE V3.0 reference date. Many of the datasets currently used, however, do not provide any greater detail on when activity took place.
The key dataset for working age adults is the Pay As You Earn (PAYE) data, and the extract available to us for constructing ABPE V3.0 only shows that a person was active at some point during a tax year, but not which specific period(s). Tax Credits data also show similar information, and so were combined with PAYE. For Higher Education Statistics Agency (HESA) and School Census datasets, the activity consists of annual registration, which takes place early in the academic year for most students.
For such datasets there is therefore a possibility that a person shows activity within the required period, but subsequently emigrates before the ABPE reference date. For HESA and School Census, there is likely to be no evidence of this emigration. For PAYE and Tax Credits, although the periods of activity are not available, an amount earned during the tax year is shown. Those leaving before the end of the tax year would earn lower amounts than if they had stayed for the full period, so emigrants are likely to be more prevalent among those with lower income amounts.
Official estimates show that around 351,000 people emigrated internationally for the long-term from the UK in the year to mid-2011, and the data show that around 312,000 of these migrants left from England and Wales. Age distributions show that migrants are predominantly young adults, and almost three- quarters of long-term international emigrants from England and Wales in the year to mid-2011 were aged between 20 and 39 years. Therefore overcoverage because of emigration is expected to predominantly affect these age groups in the ABPE.
The earlier analysis suggests that overcoverage in these groups is likely to lie somewhere between roughly 600,000 and 800,000 records, suggesting that long-term emigration could account for around one- third of incorrectly included records for these groups, while giving a much smaller contribution to overcoverage elsewhere.
Short-term residents
Another type of overcoverage is because of people living in the country on the ABPE reference date who are short-term residents and hence are not included in official population estimates. To be a part of the usual resident population, a person must have resided or intended to reside in the country for at least 12 months. For those arriving from abroad within the previous 12 months, it is not possible to determine their intended length of stay, or whether this matches the time they actually stay.
All current and previous ABPE versions have the potential to include such records, however, there may be a larger impact for ABPE V3.0. Instead of requiring records linked across multiple sources like ABPE V2.0, records on only a single data source are included in ABPE V3.0. This change aims to better capture new long-term migrants, who appeared to be largely missed in ABPE V2.0, but this also may have the side effect of including more of those migrating in for a short-term.
Some analysis is possible because of the 2011 Census also recording short-term residents in addition to the usual resident population. Of around 195,000 short-term residents estimated as being present by the census, around 66,000 can be linked to a record in ABPE V3.0 2011, suggesting the ABPE includes a substantial proportion of these records. The Patient Register was the predominant admin source on which there was recent activity for these records, with 77% having a recent registration. A sizeable proportion of these will also have a HESA registration, since 44% of the short-term residents showed this type of activity. No other type of activity was found on more than 8% of these records.
The census short-term resident definition includes those whose stay in the UK is intended to be between 3 and 12 months. Further official data on short-term migration shows that in the year to mid-2011 there were 236,000 visits of 3 to 12 months for any reason, of which 98,000 were for work or study, not including business trips where the migrant is paid by an organisation in their country of origin. If all visits of greater than one month are considered, however, the total rises to 1,098,000 visits.
Similar to long-term migration, short-term migrants are shown to be predominantly aged in their twenties and thirties. The amount of ABPE overcoverage because of these visits depends on the proportion that result in an admin data registration, which is unknown. It is at least possible, however, that short-term migration also contributes a substantial fraction of the overcoverage for younger adults.
Deaths
Another major element of population change is deaths, which begin to increase steeply above retirement age. Records on the Customer Information System (CIS) account for almost all of the ABPE V3.0 records for pensioners. A date of death is entered on the CIS record after someone dies, and this is used to exclude such records from the ABPE.
The time taken for the death to be reported and the information to reach the CIS may mean that some people are included in ABPE V3.0 who have died by the reference date of the ABPE. Previous research using 2016 death registrations data showed that around 23,000 of the deaths registered within the year had actually occurred in the previous year or earlier. Around 9,000 deaths that had occurred within the previous 12 months were also not yet recorded on the 2016 CIS.
These are relatively small effects compared with the level of overcoverage for pensioners, which Figures 4a and 4b indicate to be at least 140,000 records. If some of the missing deaths each year are never recorded on the CIS, however, this could lead to a build-up of excess records at older ages. In particular, this may occur for people who die outside the UK. Further analysis of the very old in the CIS and other data sources may indicate the extent to which deaths are missed. Linking deaths registrations to ABPE V3.0 to remove further records is likely to have some benefits, but some lags are still expected to remain, and deaths that occur outside England and Wales will be more difficult to account for.
Duplication
Some overcoverage may be because of duplication of correctly included records. This could occur within a data source, for example, if multiple NHS records are created for the same person.
Another potential duplication issue occurs across multiple sources, where people have activity on more than one data source. If the linkage method fails to connect the two records, then both will be included separately in the ABPE. For adults, the vast majority of records come from benefits and income sources, all of which link by unique identifier to the CIS, limiting the potential for this type of overcoverage. Planned improvements to linkage methods are expected to decrease this further, and currently the reasons above are expected to introduce more overcoverage so potential duplication will be investigated further in future.
Nôl i'r tabl cynnwys8. Potential ABPE inclusion rule changes
Our analysis of the admin-based population estimates (ABPE) Version (V)3.0 and census linkage has indicated areas where the activity rules may allow substantial overcoverage to enter the ABPE, and examination of the population dynamics has yielded possible reasons for this. We have proposed the changes to the ABPE rules that are outlined in Table 2.
To be successful, the proportion of overcoverage they remove must be larger than the proportion of correctly included records that are also removed as a result, to give an ABPE with incorrect records comprising a smaller percentage of the total.
| Dataset(s) | Rule change | Reasoning |
|---|---|---|
| Patient Register (PR) | Do not include records representing a new registration after migration from abroad. PR records included in the ABPE will only be those with recent re-registration after an internal move between NHS authority areas. | ABPE V3.0 records with a recent PR registration have a larger proportion not linked to census usual resident records than the other activity types, suggesting high over-coverage. Census short-term residents from outside the UK included in the ABPE are mostly included due to new PR registrations. The change will minimise over-coverage from this source. |
| Higher Education Statistics Agency (HESA) | Do not include non-UK domiciled students whose expected length of study is shown as ‘1 year’. Non-UK students will only be included if their expected length of study is ‘> 1 year and ≤ 2 years’ or longer. | Analysis of census short-term residents shows that HESA data is also a substantial source of this type of over-coverage in ABPE V3. Foreign students on courses of one year or more are currently included in ABPE V3. One-year courses have a high chance of ending slightly within 12 months, so many foreign students on these courses may not stay long enough to meet the usual resident definition. Previous research using linked HESA and Home Office data shows that up to a quarter of non-EU students depart before their course end date. |
| Pay As You Earn (PAYE) and Tax Credits | Apply a minimum threshold higher than zero to PAYE and Tax Credits income amounts, to reduce overcoverage due to people who emigrated during the tax year. Census and longitudinal PAYE and Tax Credits information was used to select records most likely to have emigrated during the 2010-11 tax year. Examining the distributions of income amounts led to initial thresholds of £2500 being selected for both PAYE and Tax Credits records. | These datasets only indicate that activity took place sometime during the tax year. People may have emigrated before the end of the tax year but still appear in the ABPE. The large contribution of PAYE data makes it a priority to minimise this over-coverage. Those present for only a part of the tax year will have a lower income than if they had worked the entire year. Incorrect records are therefore likely to be more concentrated at lower income amounts. This will also exclude some correct records who have lower income amounts for other reasons, such as part-time workers or those who stopped work due to other changes in circumstance. We expect, however, that many of these may still be included in the ABPE via other sources or having an active relative. |
| Benefits data | Use more detailed variables on status of claims to remove those records where the claimant may have moved outside England and Wales, or that claims have been closed for any other reason. | Over-coverage may arise due to some benefits being claimed after a person moves abroad or to other countries of the UK. It is also possible that a claim is stopped due to emigration or death and this is recorded on the benefits record before other data sources are updated. |
Download this table Table 2: Proposed changes to ABPE V3.0 rules to reduce overcoverage
.xls .csv9. Trialling inclusion rule changes
Effect on overcoverage
The changes listed in Table 2 were all applied to admin-based population estimates (ABPE) Version (V)3.0 2011 together to determine how much total overcoverage they remove. Figures 5a and 5b show the original numbers of ABPE V3.0 records not linked to census, and the numbers of unlinked records for this modified ABPE. The previous high and low estimates for the combination of census non-respondents and missed links are also shown.
Figure 5a: ABPE overcoverage appears to be substantially reduced after the rule changes
Records not linked to census usual residents in the original ABPE V3.0 and after combined rule changes, England and Wales, 2011, males
Source: Office for National Statistics
Notes:
- ABPE – Admin-Based Population Estimates.
- Also shown are the original estimates for census non-respondents and missed links. Missed links are expected to be overestimated for the 20 to 24 years age group.
- Age groups containing schoolchildren are excluded because of lower confidence in estimating missed links.
Download this chart Figure 5a: ABPE overcoverage appears to be substantially reduced after the rule changes
Image .csv .xls
Figure 5b: ABPE overcoverage appears to be substantially reduced after the rule changes
Records not linked to census usual residents in the original ABPE V3.0 and after combined rule changes, England and Wales, 2011, females
Source: Office for National Statistics
Notes:
- ABPE – Admin-Based Population Estimates.
- Also shown are the original estimates for census non-respondents and missed links. Missed links are expected to be overestimated for the 20 to 24 years age group.
- Age groups containing schoolchildren are excluded because of lower confidence in estimating missed links.
Download this chart Figure 5b: ABPE overcoverage appears to be substantially reduced after the rule changes
Image .csv .xlsThis suggests substantial reductions in overcoverage after the changes, particularly in the groups where it is highest, but that sizeable amounts remain, especially for younger females and the older working ages for males and females. Further analysis indicates that application of thresholds on Pay As You Earn (PAYE) and Tax Credits income has the largest effect, accounting for around 40% of the difference, but that all changes make noticeable reductions in the number of records not linked to the census. Note that some of the records not linked will be a consequence of undercount in the census.
The changes have the greatest effect for younger adults, suggesting that our attempts to reduce overcoverage because of emigration and short-term residents have largely been successful. For males, the remaining overcoverage appears to consist mostly of people aged from their mid-thirties to late-fifties. This is a relatively stable group of the population, with low levels of migration and deaths compared with other groups. The majority of records in this group are included in ABPE V3.0 because of having PAYE and/or Tax Credits activity, but around 7.6% have records on the National Benefits Database or Housing Benefit, and 5.3% have no activity but are added because of having an active relative, with much smaller contributions from other sources. Therefore future research will investigate these sources in more detail, in particular the inactive relatives rule since a clearer understanding of its quality is needed.
Although emigration is lower for older working ages, the threshold on PAYE amounts may also be less effective because of older people tending to earn higher amounts. The threshold could be increased further to determine the additional impact on overcoverage, and adjusted to find optimal values. It may also be possible in future to derive a model using the income values and other variables to estimate the probability that each person was resident on the ABPE reference date.
In the near future, however, we anticipate obtaining the PAYE-RTI (Real-Time Information) dataset, which may allow us to determine periods of activity more precisely. It should also be possible to identify the different types of payments included in PAYE, such as employment wages, pensions, and others such as redundancy payouts. This will allow more sophisticated activity rules with the potential for further reduction of overcoverage.
The remaining overcoverage for females appears similar to males for most age groups, but is much higher for ages below 35 years. For these groups, ABPE V3.0 has higher numbers of females because of the majority of Tax Credits and Housing Benefit claimants being female, so we also therefore expect more overcoverage to be present too. Additionally, the thresholds on PAYE and Tax Credits amounts were chosen assuming a record on only one of those sources. Many Tax Credits recipients also appear on PAYE, and the thresholds may not be as effective for this group, who are also expected to be mostly females. Further research into the characteristics of this group is needed to determine how best to reduce overcoverage.
Since these are simple initial changes to the rules, the reduction in overcoverage is encouraging, and there are several avenues of future research that mean further improvements are possible using the current data. Using newly acquired data sources such as PAYE-RTI, and integrating others such as the Electoral Register may also bring substantial further benefits.
Effect on overall ABPE
Figures 6a and 6b show the overall effect on the ABPE when the changes are combined.
Figure 6a: The rule changes result in an ABPE with lower overall coverage
Population by single year of age for ABPE V3.0 and the modified ABPE, England and Wales, 2011, males
Source: Office for National Statistics
Notes:
- ABPE – Admin-Based Population Estimates.
Download this chart Figure 6a: The rule changes result in an ABPE with lower overall coverage
Image .csv .xls
Figure 6b: The rule changes result in an ABPE with lower overall coverage
Population by single year of age for ABPE V3.0 and the modified ABPE, England and Wales, 2011, females
Source: Office for National Statistics
Notes:
- ABPE – Admin-Based Population Estimates.
Download this chart Figure 6b: The rule changes result in an ABPE with lower overall coverage
Image .csv .xlsFigures 6a and 6b show that up to 17% of records in some age groups are removed from the ABPE by the changes, which is smaller than the apparent proportion of overcoverage removed. Therefore the changes appear to function as intended and will result in a smaller ABPE but one in which the proportion of incorrect records is lower.
For dual-system estimation, this would likely result in lower bias at the expense of increased variance in the estimates. Apart from using estimation, however, there are further benefits to trading overcoverage for undercoverage. Incorrectly included records only appear on the admin data, with limited characteristics information making understanding how to exclude them difficult. In contrast, many records wrongly excluded from the ABPE can be found on the census, and the detailed variables there will allow us to determine their characteristics and the reasons for their exclusion. A scenario with undercoverage instead of overcoverage is therefore more favourable for future development.
Nôl i'r tabl cynnwys10. Undercoverage in ABPE V3.0
Overcoverage is the main challenge facing admin-based population estimates (ABPE) development, so has been the main focus of our research. We have also performed initial analysis of undercoverage, however, to gain further understanding of where our methods have deficiencies.
As discussed in the previous section, the census can potentially provide useful information to identify excluded subgroups and discover if these match expectations. This can help us to improve our rules or identify groups that may remain difficult to capture.
As mentioned earlier, only census usual resident records linked to one of the admin sources but not in the ABPE can be confidently identified as undercoverage. If there is no link to admin data the record could be in the ABPE but not successfully linked. We have studied those census usual residents aged 16 to 59 years with an admin data record but not in ABPE Version (V)3.0, of which there are around 2.9 million, or about 8.7% of the census population of these age groups. These have the age by sex distribution shown in Figure 7.
Figure 7: ABPE V3.0 undercoverage for working age people is broadly spread across a range of ages.
Single year of age by sex for census usual residents who appear on admin data (PR, CIS, HESA or School Census) but not ABPE V3.0
Source: Office for National Statistics
Notes:
- ABPE – Admin-Based Population Estimates.
- PR - Patient Register.
- CIS - Customer Information System.
- HESA - Higher Education Statistics Agency.
Download this chart Figure 7: ABPE V3.0 undercoverage for working age people is broadly spread across a range of ages.
Image .csv .xlsOf these census records, 96% are linked to the Patient Register and 86% are found on the Customer Information System (CIS), meaning the vast majority are on both sources and would have appeared in ABPE V2.0. Many would be expected to receive some income, but no recent activity is seen in the benefits and income data.
The major current omission is self-employment income, and Self-Assessment data will be investigated for use in future ABPE versions to cover this. Census estimates show that close to 3.4 million people up to age 59 years were self-employed in their main job, in which they work the most hours, although some of these may also work as an employee in a second job or have additional income from benefits.
Of the 2.9 million records known to be ABPE undercoverage, around 850,000 are shown on their census record to be self-employed, suggesting that the majority of self-employed are already included in ABPE V3.0 via other sources or a relative’s activity. Therefore adding the Self-Assessment data may reduce the remaining undercoverage, but also give valuable additional information about many records that are already included.
There are also sizeable numbers of employees among the undercoverage, comprising around 1.4 million records or almost half of the undercoverage. The census shows that there were almost 21 million people aged 16 to 59 years working as employees in 2011, so it appears that the proportion of employees missed by ABPE V3.0 is almost 7%. Further research is required to investigate possible reasons for this, and whether admin data activity is seen at an earlier or later date.
There is also the possibility that the census variables are incorrect. Data from the edit and imputation process (XLS, 1.26MB) show that 5.1% of those required to indicate their working status in the week before census failed to give a response and a value was subsequently imputed. The question on whether a person is employed or self-employed also had 4.0% of responses imputed because of missing values.
The 2011 Census Quality Survey (PDF, 1.43MB) (CQS) carried out face-to-face interviews with a sample of households, and compared CQS responses with those in the census dataset after edit and imputation. This found that the CQS disagreed with the census response for working status in around 8.8% of cases. In a separate question on whether a person was employed or self-employed, around 3.8% of respondents were recorded as employees on the census but self-employed on the CQS, or the other way around. Therefore when considering apparent inconsistencies between census responses and admin data, it is also necessary to thoroughly consider the quality of the census information, and these effects will be analysed further in future work.
Over 614,000 records, or around 21% of the undercoverage, are shown to be people who were not working at the time of the census, almost a fifth of whom were students. Analysis of data sources shows that almost 200,000 census usual residents with Higher Education Statistics Agency (HESA) records are excluded from ABPE V3.0. The census also indicates those in full-time education, however, and this shows that only around 45,000 of those HESA records are for people in full-time education, suggesting that the majority of those excluded are part-time students or possibly have a different status such as on sabbatical. More detailed analysis of HESA variables and activity across sources may lead to improvements that allow these records to be included.
Around 107,000 people aged 16 to 59 years in full-time education but not found on HESA are excluded from ABPE V3.0, and these are likely studying at further education institutions, and additional datasets will be sought to cover this group in future.
Another reason for not working is looking after the home or family, and this accounts for 30% of those not working and missed by ABPE V3.0. Among 16- to 59-year-olds in the full census usual resident population, only around 20% of those not working fall into this category, so the ABPE performs relatively poorly for this group. These people are likely to gain income from benefits or share the income of somebody they live with, so undercoverage for this group may be reduced by improving our methods for including people in the ABPE using their relationships to others.
Those with low or no employment income who provide care to a disabled person for at least 35 hours per week may claim Carer’s Allowance, which is included in the National Benefits Database. The census data suggest that around 305,000 people aged 16 to 59 years who provide unpaid care to someone with health problems or a disability are missed from ABPE V3.0. A large majority of these would not be eligible for Carer’s Allowance, however, since almost three- quarters provide less than 20 hours care per week.
For the remaining people who are not working, further research into their economic activity and other characteristics is needed to determine if they should have activity in admin data that will allow them to be included in future ABPE versions. We will also further explore the use of relationship information in admin data to determine if this can be used to include additional records that are currently missed.
There are also certain groups known as “special populations” that require specific adjustments in the official population estimates, and may also be difficult to capture in the ABPEs. These include groups such as prisoners and armed forces (both UK and/or foreign) and their dependants. These may be relatively small groups but they are likely to be highly concentrated in certain areas where there are large establishments such as military bases and prisons. These issues are investigated further in our report on subnational analysis of ABPE V3.0.
Nôl i'r tabl cynnwys11. Coverage survey and estimation research
The focus in the admin-based population estimates (ABPE) construction and rules has been to remove as much overcoverage as possible and then to measure the undercoverage in the ABPE with an estimation methodology to produce population size estimates. We plan to run a Population Coverage Survey (PCS) that will operate in a similar way to the Census Coverage Survey (CCS), which enables the estimation of undercoverage in the traditional census.
A high-quality address frame is being developed, which will be used as an address sampling frame for Office for National Statistics (ONS) surveys. The survey operation will be like the CCS with an emphasis on collecting variables useful for linkage to the ABPE (name, date of birth, address). However, it will be mixed mode with an online first, self-completion approach, followed by face to face or telephony where necessary.
It is anticipated that it would need to achieve a similar response size to the CCS of around 300,000 addresses in order to provide sufficient samples to enable good quality local authority level estimates. The PCS will be a voluntary survey like other social surveys and from tests in 2018 to 2019 we expect to achieve around 60% response rate. Consequently, the number of sampled addresses would need to be around 500,000 per year to provide the number of responses required to match CCS numbers.
The sampling strategy is being designed based on similar concepts to the hard-to-count index for the CCS but relying on administrative data to produce the stratification index. This involves finding covariates of under and overcoverage in the administrative data and characterising each output area (OA) by its under and overcoverage rate.
The longer-term intention is to integrate the PCS with the Labour Market Survey (LMS) where the PCS questions will appear in a first wave along with some core LMS questions. A sub-sample of Wave 1 responses will be used for subsequent waves for labour market and other survey questions. The PCS survey will likely be issued quarterly and collected throughout the year rather than the shorter timeframe used for the CCS. This will mean more complex estimation methods that are being researched. Future testing plans include an integrated survey to produce, as a minimum, local authority-level population estimates with acceptable confidence intervals.
A small scale test of an integrated PCS and LMS was conducted in 2018 to 2019, which achieved around 60% response. This was a mixed mode (online first, then face to face and finally paper by post) test, which produced about 22,000 individual responses from about 9,000 households. These 22,000 responses are being linked to administrative data currently and are being analysed shortly for the quality of the linkage.
It is expected that a high level of linkage accuracy will be required in the same way it is a requirement for the census to CCS linkage. The administrative date being linked to are the NHS Personal Demographics Service, English and Welsh School Census and Higher Education Statistics Agency (HESA). The data linkage is being done by a combination of deterministic matching rules followed by probabilistic matching and some clerical checking of results. The linkage variables used are forename, middle names, surname, date of birth, age and address. Main findings will be published in due course.
As mentioned previously, dual-system estimation (DSE) being a viable option for producing robust population estimates from an ABPE stock and a population coverage survey (PCS) depends on our success in removing incorrect records (overcoverage) from the ABPE.
The updated inclusion rules outlined in this article have removed some incorrect records, but unfortunately not yet enough to enable us to produce reliable population estimates using the traditional census-style DSE method. If we are not able to remove an adequate amount with future exclusion rules and additional data sources, an alternative estimation approach that can cope with incorrect records will be needed. It is looking increasingly likely that this will be the case.
To address this, we are undertaking research into a range of estimation methods, including different forms of DSE. This research requires a framework in which to test and evaluate different estimation approaches. Our current strategy is to simulate admin and survey data for a base population, and use this to make population estimates. The accuracy of these estimates can then be assessed through comparison with the underlying known true population. By running this process many times, we can also explore the uncertainty around these estimates.
The analysis in this article and work outlined to better understand the quality of the administrative data sources will inform this research. This will allow us to explore and understand our admin data in more depth, and so recreate in our simulated admin data the patterns and challenges that are specific to England and Wales.
This work has been examined by an independent panel of methodological experts as part of our wider plan to externally assure all work on the methods for the transformation of population and migration statistics. An article describing the details of our research at the time of going to review will be published in due course.
Further details about our estimation strategy, including how it sits within the wider context of our plans to transform population and migration statistics at the ONS, can be found in a recently published article. Please be aware that some of the dates for planned work given in the article are provisional and subject to change.
Nôl i'r tabl cynnwys12. Summary and next steps
Our analysis has shown that a sizeable number of records are incorrectly included in admin-based population estimates (ABPE) Version (V)3.0 despite the new requirement for recent activity. We have shown that this overcoverage can be substantially reduced, but more must be removed to enable the production of robust estimates using existing coverage-adjustment methods.
Since the initial changes trialled are quite simple, further improvements are likely to be possible with deeper analysis. Some of our current rules, particularly the inclusion of inactive relatives, need further analysis to gain a clearer picture of their quality. An important new data source that we envisage using is the PAYE-RTI (Pay As You Earn - Real-Time Information) that should allow us to more specifically determine periods of employment activity than is possible with the current annual PAYE extract, and hence reduce the largest potential source of overcoverage.
One of the aims of ABPE V3.0 is better inclusion of new long-term immigrants than previous versions, but our analysis suggests that this also leads to overcoverage caused by short-term residents. The changes we have trialled are likely to reduce short-term migrant overcoverage, but at the expense of long-term migrants. New migrants may be difficult to capture effectively using a coverage survey, and hence may be poorly estimated if largely excluded from the ABPE. Therefore we need to undertake deeper analysis of activity patterns over time and integrate findings from work already done to enable long-term migrants to be retained whilst excluding short-term residents or being able to estimate or adjust for their contribution.
For this we will undertake longitudinal linkage of existing datasets to show patterns of activity over time, as well as introducing further sources to show immigration and emigration events such as the Migrant Worker Scan and Home Office Exit Checks data, and building on the work so far using the Department for Work and Pensions (DWP) Registration and Population Interaction Database (RAPID).
Using longitudinally linked data can also help improve the inclusion rules for non-migrants. For example, a temporary break in PAYE activity because of change in circumstances may lead to a record being excluded from ABPE V3.0. Better understanding of these patterns will allow more sophisticated rules that prevent such spurious exclusions.
To address the remaining undercoverage, we will investigate the use of HM Revenue and Customs’s (HMRC’s) Self-Assessment dataset, to include self-employed who are currently missed. Other possible sources of activity we aim to investigate include the Electoral Register, NHS Hospital Episode Statistics (HES), DVLA driver licence date and further education data sources.
In addition to inclusion rules, we will also further investigate methods to accurately assign records to the correct address, to avoid misplacement of records and produce robust estimates for local authorities and smaller areas. We are also expanding our work on the quality, creating frameworks to evaluate the quality of individual data sources and linkage, as well as producing uncertainty intervals around final ABPE estimates.
Our research into alternative estimation methods that may be more compatible with ABPE coverage patterns will also continue, building an improved framework to simulate admin data and different types of ABPE, to evaluate the potential of different estimation methods.
Nôl i'r tabl cynnwys14. Annex 1: Estimating the numbers of missed links
As discussed in Section 5, missed linkage is an important reason for a matching census record not being found for a record in the admin-based population estimates (ABPE). To estimate the amount of overcoverage in the ABPE, the number of missed links must first be estimated. Since the missed links appear on both sides of the linkage diagram in Figure 1, they can also be estimated using the unlinked census records, if the contribution from ABPE undercoverage can first be accounted for.
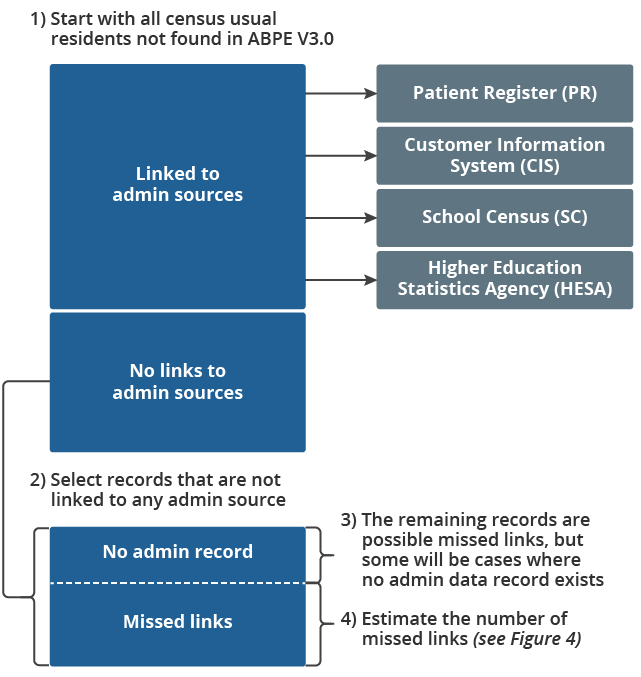
Any census usual resident record linked to one of the admin sources but not included in the ABPE can be classed as ABPE undercoverage. Of the remaining census usual residents not linked to any admin source, many will be missed links but some may be additional ABPE undercoverage because of usual residents who have no record on the admin sources. This latter category must also be excluded to estimate the missed links. These different types of records are shown in Figure 8.
Figure 8: How census records not found on the ABPE can be used to estimate missed links
Source: Office for National Statistics
Notes:
- ABPE – Admin-Based Population Estimates
- Census records with links to admin sources are straightforward to exclude, but it is more difficult to account for residents who do not appear on any of our admin sources.
Download this image Figure 8: How census records not found on the ABPE can be used to estimate missed links
.png (43.5 kB)
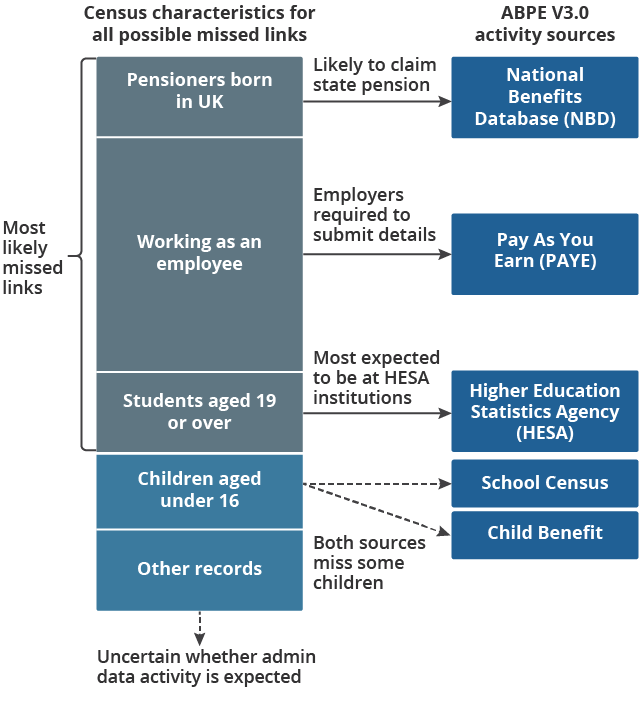
To exclude those with no admin record and estimate the missed links, we have used the census characteristics to determine which records are most likely to appear in the admin data and the ABPE. Figure 9 shows how certain groups with a high likelihood of appearing on a particular admin source, and hence likely to be missed links, can be derived.
Figure 9: How missed links can be estimated using census characteristics
Source: Office for National Statistics
Notes:
- ABPE – Admin-Based Population Estimates
- We have indentified three groups whose characteristics indicate they are highly likely to appear on an admin source used in ABPE V3.0, and hence are likely to be missed links.
Download this image Figure 9: How missed links can be estimated using census characteristics
.png (51.9 kB)
A working person would be expected to have a record on the Customer Information System (CIS) that could be linked to the census, and those who are employees rather than self-employed should also show earnings on the Pay As You Earn (PAYE) data and hence appear in ABPE V3.0. Therefore any such records found on census but not ABPE V3.0 are likely because of missed links.
Study is an important reason for adults not being in employment, and students registered at higher education providers are expected to appear on the Higher Education Statistics Agency (HESA) dataset and hence be included in ABPE V3.0. The census identifies all schoolchildren and students in full-time education, and a high proportion of these records of typical university student age can be expected to be higher education students who would appear on the HESA data and hence would be missed links between ABPE V3.0 and census. Assuming all students of feasible age are missed links is likely to lead to a slight overestimate, however, since some students would be at colleges, such as further education institutions, that are not affiliated with HESA.
For adults who are not working or studying, there is more uncertainty about whether they should appear on the activity data, for example, we cannot assume that an unemployed person is claiming a benefit. In addition to benefits data, adults who are not working or studying can also be included in ABPE V3.0 using recent activity on the Patient Register (PR), which can occur after migration from abroad or an internal move between areas. Although new immigrants and people who changed addresses recently are identified by the census, it does not automatically follow that they updated their PR record, and young males in particular are less likely to do this. We therefore cannot be confident that a link has been missed, and therefore cannot estimate the missed links for these groups. Therefore we can estimate missed links for the working ages using census records for employees and students, but this is likely to result in an underestimate for many groups.
For pensioners, those born in the UK are expected to have a National Insurance number and hence appear on the CIS. Although we cannot be certain that a person recorded as a usual resident on the census and eligible for the State Pension is claiming it, take up of this benefit is so high that this is expected to be a strong assumption. Therefore we can obtain an estimate of the missed links for pensioners by counting census records indicating UK birth that are not linked to the admin data. This will exclude those born outside the UK, so is also likely to result in an underestimate.
For children, the census does not give a strong indication that a child should be found on admin sources. Children studying at private schools or who are homeschooled are not included in the School Census, so using any children in education would result in overestimates of missed links. It can also not be inferred that a family claims Child Benefit.
Therefore we focus on estimating the missed links for adults aged 19 years or over. Many students aged 18 years will still be studying in a school sixth-form, and hence should appear on the School Census rather than HESA, so this age group is excluded. We derive a high and low estimate of the missed links.
High estimate
All census usual resident records not found in ABPE V3.0 and not linked to PR, CIS, HESA or School Census sources. This is likely to be an overestimate because of also including any census usual residents who genuinely have no admin data record(s) on the sources used.
Low estimate
Census usual residents not found in ABPE V3.0 and not linked to PR, CIS, HESA or School Census sources and recorded as either working as an employee at the time of the census, or a student aged 19 years or over in full-time education. Any additional usual residents aged 65 or over and born in the UK are also included. As explained previously, this is likely to result in underestimation for many groups.
Nôl i'r tabl cynnwysManylion cyswllt ar gyfer y Erthygl
Related publications
- How we are improving population and migration statistics
- Methodology for creating uncertainty intervals for mid-year population estimates by single year of age and sex: July 2020
- Admin-based population estimates and statistical uncertainty: July 2020
- Developing our approach for producing admin-based population estimates, subnational analysis for England and Wales: 2011
- Indicative uncertainty intervals for the admin-based population estimates: July 2020