Cynnwys
- Introduction
- Things you need to know about this release
- What’s new for this release?
- Affordability of home ownership
- Repossessions
- Cost of private rent
- Monthly salary
- Affordability of private renting
- Cost of social rent
- Weekly salary and social housing
- Affordability of social housing
- Privately-owned housing
- House building
- Housing market activity
- Social housing stock
- Vacant social housing
- Social housing shortfall
- Glossary
1. Introduction
This report provides analysis of 14 housing summary measures, giving an overview of the affordability of private renting, as well as the affordability and availability of home ownership and social renting, for countries, regions and local authorities in England and Wales. The housing summary measures bring together existing data for England and Wales from multiple sources and examine recent trends in the three different tenure types. Where possible, comparisons are drawn across geographies and time, in order to gain a more comprehensive understanding of the current market for housing in England and Wales.
Numerous data sources are used to produce these measures and so there are occasionally different definitions and methods in the data described here. Where this is the case, it is highlighted. A glossary is also available to provide clarification of the measures used. The structure of the report begins by providing analysis of the affordability of home ownership, private renting and social housing, before examining housing stock for both the private sector and for social housing. The final summary measures look into the characteristics of the current social housing market.
Nôl i'r tabl cynnwys2. Things you need to know about this release
The housing summary measures use the most up-to-date data available, unless otherwise mentioned. Our housing affordability ratios have been taken from our Housing affordability in England and Wales: 1997 to 2016 release to keep consistency with our published official housing affordability statistics. Therefore our housing affordability ratios use data most up-to-date in March 2017. The earnings data used in our ‘Monthly salary’ and ‘Weekly salary and social housing’ sections use data from the latest Annual Survey of Hours and Earnings (ASHE) and so salaries in these measures are not directly comparable with the earnings data used in the ‘Affordability of home ownership section’.
This release includes data for the calendar year of 2016 and extends data back over a time series where it is possible for comparisons to be made. The measures are taken directly from, or are calculated using existing official statistics. Where possible, there are comparable time series data available for both England and Wales, however, some data are taken from different sources for the two countries, so the methods and definitions may differ.
The data sources used are indicated in both this article and in the accompanying dataset, with separate source information being provided for England and Wales where relevant. Data are expressed as percentages, ratios and prices to ensure comparability across the geographical areas. The smallest geography for which statistics are presented is local authority districts, of which there are 348 in England and Wales. Regional and country level data are also available where possible.
Nôl i'r tabl cynnwys3. What’s new for this release?
Since the last publication Housing summary measures analysis: 2015, we have produced a separate publication on housing affordability – Housing affordability in England and Wales: 1997 to 2016, which has a revised method for calculating housing affordability. This means that the housing affordability statistics presented in this report are comparable with the affordability statistics in the ‘Housing affordability in England and Wales’ release. We have removed our measures on house prices and annual salary as these are covered in our housing affordability release. For further analysis of house prices or earnings, refer to either the House Price Statistics for Small Areas (HPSSAs) or the Annual Survey of Hours and Earnings (ASHE) releases.
The measure of affordability of home ownership has changed to use workplace-based earnings instead of residence-based earnings and also relate to full-time workers rather than all workers. Workplace-based earnings are the focus to help understand whether people can afford to live in the local area in which they work. Statistics on housing affordability using residence-based earnings are available in our Housing affordability release.
For this release, we have included additional geographies in the accompanying dataset. For each measure we have included “a” datasets, which contain statistics for countries and English regions, and “b” datasets, which include statistics for local authority districts in England and Wales. Data for some measures are not available at the country and region level.
In previous housing summary measures releases, we included analysis of the cost of private monthly rents in Welsh local authority districts, but the data were not included in the accompanying dataset. For this release, we have included statistics on the median monthly price of private renting for one-, two-, three- and four-bedroom properties in Wales by local authority district in our dataset. Statistics on the overall median monthly private rent are not available for local authority districts in Wales.
In order to create rent price statistics that are comparable with English local authorities, we have included the median monthly private rent by number of bedrooms for England, but have highlighted that data is from different sources. English data come from the Valuation Office Agency and Welsh data come from Stats Wales. Affordability of private renting for Welsh local authority districts is now included, by using the most common number of bedrooms property type, which were two bedrooms in 2016. Therefore England and Wales data are not directly comparable for private rental affordability.
For house building, we have previously used data on the number of private sector dwellings completed, which only covers new permanent dwellings. In this release we have used data on net additional dwellings from the Department for Communities and Local Government. These data include more additional dwellings than the statistics used in previous housing summary measures, including newly-built properties, conversions and changes of use, minus demolitions.
Nôl i'r tabl cynnwys4. Affordability of home ownership
In order to understand how much people are likely to be able to afford when buying a house, both house prices and annual salary must be considered. We publish official statistics on Housing affordability in England and Wales, which describes the ratio of house prices to annual earnings, based on price paid for residential properties using data from the House price statistics for small areas and workplace-based earnings using data from the Annual Survey of Hours and Earnings.
Housing in England and Wales became less affordable in 2016 compared with 2015. The affordability ratio increased from 7.37 in 2015 to 7.59 in 2016, which is a 3% increase. This means that in 2016, a worker in England and Wales could typically expect to spend around 7.6 times their annual earnings on purchasing a home.
Figure 1 shows the affordability ratio for all regions in England and Wales, including the affordability for England and Wales as a whole. London was the least affordable region with a ratio of 11.98, followed by the South East with 9.75. This difference was driven by the higher median price paid for residential properties in London than in all other regions and Wales. The North East was the most affordable region in 2016 with less than half of the ratio for London (5.12). Wales had a lower affordability ratio (5.79) than the figure for England and Wales, meaning it was more affordable to work and live in Wales than in England.
Figure 1: Ratio of median price paid for residential property to median workplace-based gross annual earnings, by region and country
England and Wales, 2016
Source: Office for National Statistics
Notes:
- Data from Housing Affordability in England and Wales: 1997 to 2016.
- Median price paid relates to year ending September. Earnings data relates to full-time workplace-based earnings as at April each year.
Download this chart Figure 1: Ratio of median price paid for residential property to median workplace-based gross annual earnings, by region and country
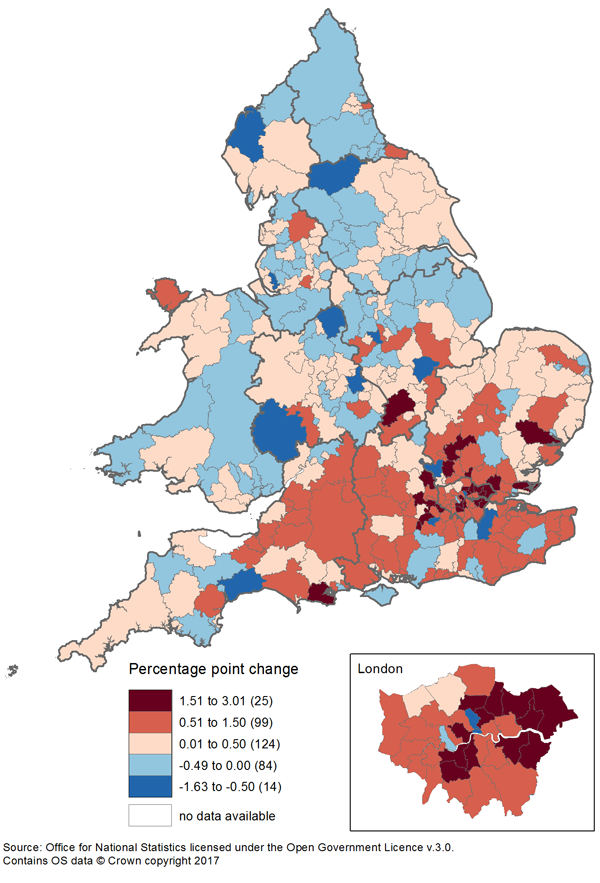
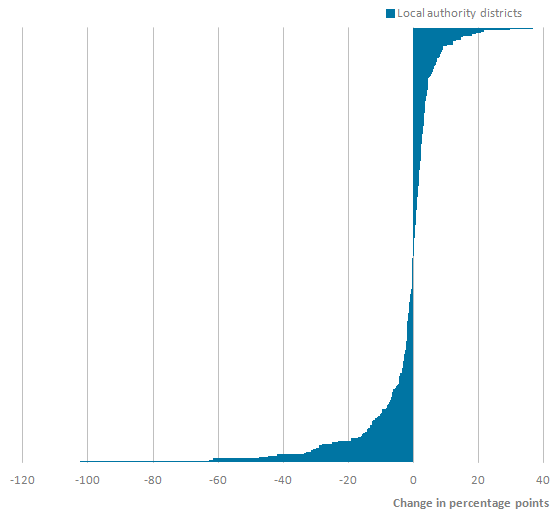
Image .csv .xlsHousing affordability appears to have worsened slightly from 2015 to 2016 overall in England and Wales with an increase in affordability ratio, however, not all geographical areas within these countries follow the same trend. There were 96 local authorities that had an improvement in affordability ratio between 2015 and 2016. Figure 2 shows the geographical spread of the change in affordability ratio from 2015 to 2016 in local authority districts in England and Wales. The areas in which affordability ratios increased the most were mainly in London and the South East, where house prices are generally more expensive and increasing more rapidly than elsewhere.
However, there were some areas in London and the South East that had improvements in affordability between 2015 and 2016. The biggest improvement was in Woking in the South East, which had a decrease in affordability ratio of 1.63. Three areas in London had an improvement in affordability: City of London, Islington, and Hammersmith and Fulham. Islington, and Hammersmith and Fulham had increases in both house prices and earnings, but earnings increased by a greater amount. City of London had a decrease in house prices and an increase in earnings, which drove the largest improvement in affordability ratio in London.
Figure 2: Change in housing affordability ratio, by local authority
England and Wales, 2015 to 2016
Source: Office for National Statistics
Notes:
- Data from Housing affordability in England and Wales.
- Median price paid relates to year ending September. Earnings data relates to full-time workplace-based earnings as at April each year.
Download this image Figure 2: Change in housing affordability ratio, by local authority
.png (273.1 kB)
5. Repossessions
Data on mortgage and landlord possession actions for England and Wales is available from the Ministry of Justice for 2003 to 2016. A mortgage or landlord possession action starts when a mortgage lender or landlord submits a claim to the courts to repossess a property. The court process of possessing a property tends to follow four main stages. First of all, a claim for a mortgage or landlord possession is issued by the mortgage lender or landlord; an order is then made by the county court. If the defendant fails to vacate the property by the given date the order may be enforced as a warrant of possession. Lastly, the property is repossessed by the county court bailiff. A total of all possession actions are recorded in the published possession actions statistics.
In England and Wales there were 406,188 possession actions in 2016, a decrease of 45,864 (10.1%) since 2015.
Figure 3 shows the indexed number of possession actions for the highest and lowest English regions and Wales between 2003 and 2016. Possession actions were highest for all three regions in 2008, but while there has been an overall decrease in number of possession actions for both Wales and the North East since then, the number of possession actions in London increased between 2010 and 2013 before decreasing in 2016 to slightly below the level of 2010. London is the region with the most possession actions in 2016, reflecting lower housing affordability in this region.
Figure 3: Indices of total possession actions for highest and lowest English regions and Wales
2003 to 2016
Source: Ministry of Justice
Notes:
- Data from Mortgage and Landlord Possession statistics.
Download this chart Figure 3: Indices of total possession actions for highest and lowest English regions and Wales
Image .csv .xlsThere were 282 local authorities that had a decrease in the number of total possession actions between 2015 and 2016, which is over 80% of local authorities. Copeland in the North West had a decrease in possession actions of 44.7%. There were 171 local authorities that had a decrease of more than 10%.
The decrease in total possession actions is due largely to the decrease in mortgage possession actions since 2008. In 2008, there were 399,978 mortgage possession actions and in 2016 there were 52,037, a decrease of 347,941. The reason behind these changes is likely because of the sustained period of low interest rates since 2008, causing fewer homeowners to default on their mortgage repayments. The recent increase in the Bank of England’s base rate of interest is not covered in the time period in these data, but a period of sustained interest rate increases could coincide with increases in the number of possession actions in the future.
Nôl i'r tabl cynnwys6. Cost of private rent
The Valuation Office Agency (VOA) publishes statistics on median monthly private rent by local authorities in England. Overall median rent price and median rent price by number of bedrooms is available. Data on monthly private rent are not directly comparable either over time, between geographies or across property types due to the variations in samples used to calculate the statistics. Therefore, data are only presented for England in 2016.
Figure 4 compares the median monthly private rent cost, by number of bedrooms, for the most expensive two regions and the least expensive region. The median monthly private rent was higher in London for all property types. In London, the median monthly private rent ranged from £1,275 for one bedroom to £2,593 for four or more bedrooms. The second most expensive region to rent in England was the South East, where the median for a three-bedroom property (£1,025 per month) was lower than that of a one-bedroom property in London. The North East was the region that had the lowest median monthly private rent cost for all property types, with median rent ranging from £400 per month for one-bedroom properties to £795 per month for one or more bedroom properties.
Figure 4: Median monthly private rent cost, by number of bedrooms, for London, South East and North East
England, 2016
Source: Valuation Office Agency
Notes:
- Data from Private Rental market statistics.
- Based on VOA administrative database as at 30 September 2016, covering October 2015 to September 2016.
Download this chart Figure 4: Median monthly private rent cost, by number of bedrooms, for London, South East and North East
Image .csv .xlsFor rented accommodation in England, the overall median private rent price was £650 per month in 2016. The local authority with the highest median private rent price was Kensington and Chelsea at £2,492 per month. The most expensive 20 local authorities for median private rent price were all in London. The local authority with the highest median private rent price outside of London was Elmbridge in the South East with £1,295 per month. The local authorities with lowest median private rent price were City of Kingston-upon-Hull in Yorkshire and The Humber (£395) and Burnley in the North West (£400).
Median monthly private rent data for Welsh local authorities is collected separately through Rent Officers Wales and accessed through Stats Wales. For Wales, the highest number of private rented accommodation was for two-bedroom properties, for which the median private rent price was £495 per month. Figure 5 shows the median rent price for two-bedroom properties for local authorities in Wales in 2016.
Figure 5: Median monthly private rent price for two-bedroom properties for local authorities
Wales, 2016
Source: Stats Wales
Notes:
- Data from Private sector rents.
- Based on calendar monthly rents from 1 January to 31 December.
Download this chart Figure 5: Median monthly private rent price for two-bedroom properties for local authorities
Image .csv .xlsFor two-bedroom accommodation, the local authority with the highest median private rent price was Cardiff at £600 per month. The median private rent for one-bedroom properties in Cardiff (£500) was greater than the median private rent for four-or more bedroom properties in Blaenau Gwent (£460).
Nôl i'r tabl cynnwys7. Monthly salary
The Annual Survey of Hours and Earnings provides data on gross monthly salary for England and Wales, which can be used to identify the distribution of monthly salary by local authority. Median monthly salary follows the same trends as annual salary, as described in the Housing affordability in England and Wales release.
In 2016, the median gross monthly salary for full-time workers in England and Wales was £2,360, which is an increase of £53.75 (2.3%) from 2015 in nominal terms. English median monthly salary was higher in 2016 than Wales by £255 and while median monthly salary is typically higher in England than in Wales, this gap has closed since 2008 where English median monthly salary was £310 higher than Wales.
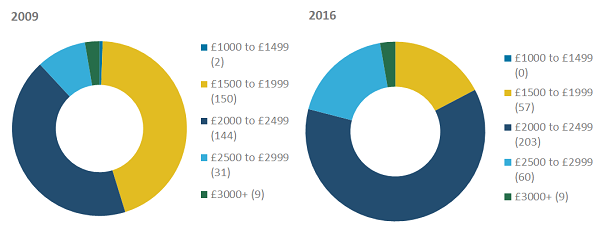
Figure 6 shows the median monthly salary for all local authorities in England and Wales for 2009 and 2016, grouped by salary bands of £500. Out of all the local authorities with available earnings data, 61.7% had a median monthly salary between £2,000 and £2,499 in 2016, compared with 42.9% in this category in 2009. This highlights the increase in nominal earnings since the economic downturn, although there were nine local authorities that fell in the £3,000 or more category for both years.
Figure 6: Median gross monthly salary for local authorities, by £500 salary bands
England and Wales, 2009 and 2016
Source: Office for National Statistics
Notes:
- Data from Annual Survey of Hours and Earnings.
- Data from ASHE relate to full-time workplace-based earnings as at April for each year.
Download this image Figure 6: Median gross monthly salary for local authorities, by £500 salary bands
.png (40.7 kB) .xls (43.0 kB)
There were nine local authorities that had a median monthly salary of £3,000 or more, seven of which were in London. City of London had the highest median monthly salary of all local authorities at £4,624. The two local authorities with median monthly salary above £3,000 that weren’t in London were Copeland in the North West (£3,624) and Wokingham in the South East (£3,232). Median monthly salaries have increased overall since 1999 in England and Wales despite going through a period of slow growth between 2009 and 2013.
Nôl i'r tabl cynnwys8. Affordability of private renting
Showing median monthly rent as a percentage of median gross monthly salary provides a useful indicator of the affordability of private renting. Workplace-based earnings are again used for this measure. In 2016, median monthly private rent for England was 27% of median gross monthly salary. This means that someone working in England could expect to spend 27% of their monthly salary on private rent. London, the South East, East of England and the South West, all had percentages above this level. Overall, median monthly private rent as a percentage of median monthly salary ranged from 23% in the North East, to 49% in London.
Figure 7 shows the median monthly rent as a percentage of median monthly salary for local authorities in England in 2016. The majority of local authorities had a private rental affordability ratio of between 20% and 40%. Kensington and Chelsea was the least affordable English local authority in 2016 with a median monthly rent making up almost 100% of median monthly salary. While this is an unrealistic figure because the majority of those working in Kensington and Chelsea could live elsewhere, it illustrates the impediment for individuals to both work and reside in this local authority. Westminster was the second least affordable local authority in England.
The most affordable local authority was Copeland in the North West (12%) followed by Derby in the East Midlands (18%). Higher median monthly salaries in Copeland are likely to be the result of a large number of relatively high-paid, skilled jobs at the Sellafield nuclear power station in this local authority.
Figure 7: Median monthly rent as a percentage of median gross monthly salary, by local authority
England, 2016
Source: Valuation Office Agency and Office for National Statistics
Notes:
- Data from Private Rental market statistics and Annual Survey of Hours and Earnings.
- Median monthly private rent based on VOA’ administrative database as at 30 September 2016, covering October 2015 to September 2016.
- Data from ASHE relate to full-time workplace-based earnings as at April for each year.
Download this chart Figure 7: Median monthly rent as a percentage of median gross monthly salary, by local authority
Image .csv .xlsMonthly private rental affordability has been calculated for Welsh local authorities but on the basis of two-bedroom properties, which were the most common unit of privately rented accommodation in Wales in 2016 (35%). Based on two-bedroom properties, the median monthly private rent for Wales was 23% of median monthly gross salary. This means that someone living in a two-bedroom property in Wales could expect to spend 23% of their monthly salary on private rent. Statistics on the overall median monthly private rent price are not available for Wales and so the private rental affordability ratios are not directly comparable between England and Wales.
Figure 8 shows the median monthly rent as a percentage of median monthly salary for local authorities in Wales in 2016. All local authorities in Wales, with the exception of Neath Port Talbot (18%) and Rhondda Cynon Taf (19%), had a median monthly private rental affordability ratio of between 20% and 29%. Neath Port Talbot was the most affordable local authority for private renting in Wales, as someone living and working in Neath Port Talbot could typically expect to spend 18% of their monthly salary on private rent. The least affordable was Ceredigion with a private rental affordability ratio of 29%.
Figure 8: Median monthly rent as a percentage of median gross monthly salary, for local authorities
Wales, 2016
Source: Stats Wales
Notes:
- Data from Private sector rents and Annual Survey of Hours and Earnings.
- Median monthly private rent for Wales is based on two-bedrooms only, so affordability is based on privately renting a 2 bedroom property.
- Based on calendar monthly rents from 1 January to 31 December.
- Data from ASHE relate to full-time workplace-based earnings as at April for each year.
Download this chart Figure 8: Median monthly rent as a percentage of median gross monthly salary, for local authorities
Image .csv .xls9. Cost of social rent
Statistics on the average cost of social housing rent for local authorities in England and Wales are available from the Department for Communities and Local Government for England and Stats Wales for Wales. The data for England refer to general needs social housing from privately registered providers only and exclude local authority-provided social housing. For Wales, average social rent cost is based on self-contained social housing stock (including sheltered, other-supported and extra care units as well as general needs units) and includes registered social landlords and local authorities’ social housing stock.
Average weekly cost of social renting for England in 2016 was £97.84, an increase of 2% since 2015. This is a smaller increase than in previous years, although the cost of social renting has risen by 40% since 2008. The average cost of social renting in Wales has increased at a similar rate, by 39% since 2008.
The average rent cost for local authorities in England and Wales in 2016 ranged from £73.98 in Blaenau Gwent, Wales (for self-contained social housing) to £141.51 in Westminster in London. Figure 9 shows the social rent costs for the highest and lowest five local authorities in 2016. The five most expensive local authorities for average social rent in 2016 were in London.
Figure 9: Average cost of social rent for the highest and lowest five local authorities
England and Wales, 2016
Source: Department for Communities and Local Government and Stats Wales
Notes:
- Data from Private Registered Provider average weekly rents and Average weekly rents.
- Data for England is based on average social rent from Privately Registered Providers general needs units only. Data for Wales is the average rent for all social housing stock (self-contained general needs, sheltered, other supported and extra care units).
- Data for is England is at 31 March 2016, Wales is based on 2016/2017.
Download this chart Figure 9: Average cost of social rent for the highest and lowest five local authorities
Image .csv .xlsAverage weekly social rent of self-contained social housing for the year ending April 2016 to March 2017 within Wales ranged from £73.98 in Blaenau Gwent to £91.81 in Cardiff. In Blaenau Gwent this was £8.87 less than the average for Wales and Cardiff was £8.96 above average. Since 2008, all local authorities in Wales increased between 30.6% (Monmouthshire) to 46.0% (Wrexham). Cardiff, the most expensive area for social rent increased by 40.8%, whilst Blaenau Gwent, the least expensive area increased by a similar amount (40.3%).
Nôl i'r tabl cynnwys10. Weekly salary and social housing
People living in social rented accommodation in England and Wales tend to earn less than those living in other tenures. To look at the relationship between social housing costs and salary, it is useful to analyse the earnings and social housing costs of the lowest-paid residents. To examine the lowest-paid workers, we can look at the 10th percentile gross weekly salary from paid work, which describes the earnings at the point of the lowest 10% of salaries. This does not take into account additional income such as from housing benefits and other sources.
The 10th percentile gross weekly salary in England and Wales for 2016 was £309.60, an increase of £13.10 (4.4%) since 2015. This was the third largest percentage increase in the whole period between 1997 and 2016, and 1.61 percentage points higher than the previous increase in 2015. The only English region that did not have an increase exceeding 3% was London. Wales had a 10th percentile gross weekly salary of £295.20 in 2016, which was £14.40 below the 10th percentile weekly salary for England and Wales overall and a 4.2% increase since 2015.
Figure 10 shows the 90th percentile and 10th percentile full-time, workplace-based gross weekly salary in England and Wales, with 10th percentile weekly salaries increasing at a slower rate than 90th percentile weekly salaries.
Figure 10: Median, 10th and 90th percentile gross weekly salary
England and Wales, 1997 to 2016

Source: Office for National Statistics
Notes:
- Data from Annual Survey of Hours and Earnings.
- Data from ASHE relate to full-time workplace-based earnings as at April for each year.
Download this image Figure 10: Median, 10th and 90th percentile gross weekly salary
.png (27.1 kB) .xls (37.4 kB)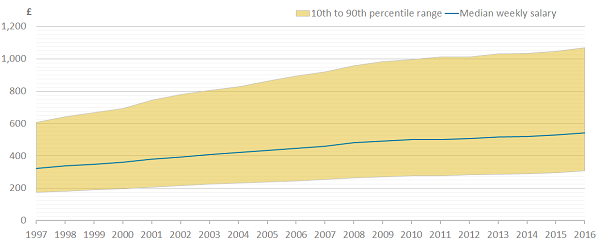
The local authority with the highest 10th percentile weekly salary was City of London at £471.50 per week. The top 10 local authorities for 10th percentile weekly salary for 2016 were mostly in London, exceptions being Spelthorne and Runnymede, both in the South East. The local authority with the lowest 10th percentile weekly salary for 2016 was Mansfield in the East Midlands with £236.80 followed by Blaenau Gwent in Wales with £257.80.
Nôl i'r tabl cynnwys11. Affordability of social housing
To analyse the affordability of social housing for local authorities in England and Wales, the average weekly social rent as a percentage of 10th percentile gross weekly salary can be examined. Data on workplace-based weekly earnings is available from the Annual Survey of Hours and Earnings and data on social rent costs for England and Wales is available from the Department for Communities and Local Government for England and Stats Wales for Wales. Affordability of social housing is only based on general needs social housing from privately registered providers in England and excludes local authority-provided social housing. For Wales, social housing affordability is based on all social housing stock so includes social rent from registered social landlords and local authorities.
Tenth percentile gross weekly salary is used as the measure for earnings in the affordability ratio, as the individuals most likely to socially rent are those with the lowest earnings. The percentages presented here do not take into account any rent reductions for those receiving Local Housing Allowance, or any other benefits received. This results in some local authorities having affordability ratios of more than 100, so it appears that more is spent on social rent than is received in weekly earnings, which is unlikely to be the case in reality. However, by looking at affordability ratios of local authorities, it does allow relative comparisons between local authorities.
Average weekly social rent cost as a percentage of 10th percentile weekly salary in England for 2016 was 31.5%, a decrease of 0.7 percentage points since 2015. This means that someone earning at the lowest 10% of earnings could expect to spend 31.5% of their weekly earnings on social rent. In Wales for the year ending March 2017, weekly social rent cost as a percentage of 10th percentile weekly salary was 28.1%, a decrease of 0.4 percentage points since the year ending March 2016. This indicates that social rent has become more affordable in England and Wales.
Figure 11 shows average weekly social rent costs as a percentage of 10th percentile weekly salary for England and for Wales between 2003 and 2016. The higher the percentage value, the less affordable it is considered to be. Social rent has become less affordable for both England and Wales since 2003. The differences between average weekly social rent costs as a percentage of 10th percentile weekly salary for England and for Wales have been within 2.3 and 3.9 percentage points since 2003.
Figure 11: Average weekly social rent cost as a percentage of tenth percentile weekly salary, by country
England and Wales, 2003 to 2016
Source: Office for National Statistics, Department for Communities and Local Government, Stats Wales
Notes:
- Data from Annual Survey of Hours and Earnings, Private Registered Provider average weekly rents and Average weekly rents.
- Data for England is based on average social rent from Privately Registered Providers general needs units only. Data for Wales is the average rent for all social housing stock (self-contained general needs, sheltered, other supported and extra care units).
- Social rent cost data for is England is at 31 March 2016, Wales is based on 2016/2017.
- Data from ASHE relate to full-time workplace-based earnings as at April for each year.
Download this chart Figure 11: Average weekly social rent cost as a percentage of tenth percentile weekly salary, by country
Image .csv .xlsThere were 11 local authorities that had a social rent affordability percentage more than 40%, the majority of which were in London. The 3 local authorities not located in London were still within close proximity to the region (Dacorum and St Albans in the East of England and South Bucks in the South East). Comparatively, the most affordable local authorities were mostly situated in Wales, the North East and North West of England.
Nôl i'r tabl cynnwys12. Privately-owned housing
The Department for Communities and Local Government provides data on dwelling stock for England and Stats Wales provides the same information for Wales. In England, the dwelling stock figures by local authority only provide figures for private sector properties overall, which comprises both owner-occupied and privately-rented housing. The breakdown of the two is provided for Wales, but is not currently available for England.
In 2016, privately-owned housing accounted for 82.7% of total housing stock in England. This was a similar level to the previous two years. Similarly, privately-owned housing in Wales comprised 84.1% of the total housing stock in the year ending March 2016.
Figure 12 shows privately-owned housing as a percentage of total housing stock for the highest and lowest five local authorities in England and Wales in 2016, comparing 2016 with 2010. The local authority with the lowest percentage of privately-owned housing in 2016 was Hackney in London with 57.1%, an increase of 1.67 percentage points since 2010. The lowest five local authorities for privately-owned housing in 2016 have had an increase of between 1.67 and 2.75 percentage points since 2010.
The share of privately-owned housing out of all housing stock decreased between 2015 and 2016 for nearly a third of local authorities. However, only two of these had a decrease of more than 1 percentage point. These were St. Edmundsbury in the East of England (1.1 percentage points decrease) and Hounslow in London (5.7 percentage points decrease).
The local authority with the highest percentage of privately-owned housing (Castle Point in East of England with 94.6%) has remained at a similar level since 2010. The highest five local authorities for privately-owned housing as a percentage of total housing stock in 2016 have all had decreases since 2010, ranging from 0.63 to 0.02 percentage points. The bottom five local authorities are therefore increasing at a faster rate than the top five local authorities for privately-owned housing as a percentage of total housing stock.
Figure 12: Privately owned housing as a percentage of total housing stock for the five highest and lowest local authorities
England and Wales, 2010 and 2016
Source: Department for Communities and Local Government, Stats Wales
Notes:
- Data from Number of dwellings by Tenure and Dwelling stock estimates by tenure.
- England dwelling stock by tenure data is at 1 April each year.
- Wales dwelling stock by tenure data is based on 2009/10 for 2010 and 2015/16 for 2016.
Download this chart Figure 12: Privately owned housing as a percentage of total housing stock for the five highest and lowest local authorities
Image .csv .xls13. House building
The number of new dwellings being completed contributes largely to the availability of housing, which can in turn have an influence on house prices and rent prices. In the past few decades, the pace of house building has been slower than historic high levels after the Second World War and the housing market has had rising house prices and rising rents. In the UK, governments are aiming to increase the amount of houses being built. However, according to the Housing White Paper (PDF, 9.45MB), which sets out housing plans in England, more than 40% of local planning authorities do not have a plan that meets projected growth in households in their area and so the pace of development is arguably too slow.
For England, we have used data on Net Additional Dwellings produced by the Department for Communities and Local Government (DCLG). This covers private sector building of new properties, conversions, changes of use and demolitions. For Wales, we use data on net dwellings completed with data focusing on new house building. Understanding housing construction allows us to consider the impact on new housing development on prices and so linking housing availability to housing affordability. It is interesting to explore whether areas that have more homes being built have lower house price inflation than areas with less housing construction.
For England in 2016, there were 217,345 net additional dwellings, a larger amount than in 2015 (189,645 net additional dwellings). Since 2012, net additional dwellings have increased each year, increasing by 74.3% overall since 2012. Between 2001 and 2007, net additional dwellings increased in each year and reached a peak of 223,534 in 2007, before dramatically decreasing in 2008 coinciding with the recession at that time.
Since 2007, net additional dwellings in England have not surpassed the figure for 2007, although reached a similar level in 2016 with 6,189 net additional dwellings less than in 2007. The announcement in the 2017 Budget of an aim to build 300,000 dwellings per year in England by the mid-2020s would require further increases in net additional dwellings in the coming years.
For Wales in 2015/161, there were 6,900 net dwellings completed, also a larger amount than in 2014/15 (6,170 net dwellings completed). Net dwellings completed have increased each year since 2012/13, increasing by 26.6% overall since 2012/13 following a period of decreases in net dwellings completed. In 2009/10, net dwellings completed were 0.53% of total privately owned housing stock, while in 2012/13 it was 0.47%, a difference of 0.06 percentage points.
Overall for England and Wales in 2016, net additional dwellings ranged from 6,900 in Wales to 39,560 in London. House building increases in England and Wales generally follow the trend of other summary measures in that London stands out amongst other regions and is followed by the South East, which had 36,526 net additional dwellings in 2016. London and the South East were the only two regions in England and Wales that had net additional dwellings of over 30,000 in 2016.
Figure 13 shows net additional dwellings and median price paid for residential properties in all regions in England and Wales, in 2016. There is a moderate trend showing that the higher the net additional dwellings, the higher the median house price in 2016 for each region. The causation is difficult to determine, however it could be that high demand for residential properties is both driving the median price paid upwards, as well as encouraging an increase in house building. Alternatively, the house price could be a determinant, resulting in more house building taking place in the more expensive regions, reflecting the higher housing demand in those areas.
Figure 13: Net additional dwellings and median price paid for residential properties for regions
England and Wales, 2016

Source: Department for Communities and Local Government; Stats Wales; Office for National Statistics
Notes:
- Net additional dwellings for England is 2016/2017.
- England dwelling stock by tenure data is at 1 April.
- Data for Wales is based on 2015/16.
Download this image Figure 13: Net additional dwellings and median price paid for residential properties for regions
.png (37.3 kB) .xls (65.5 kB)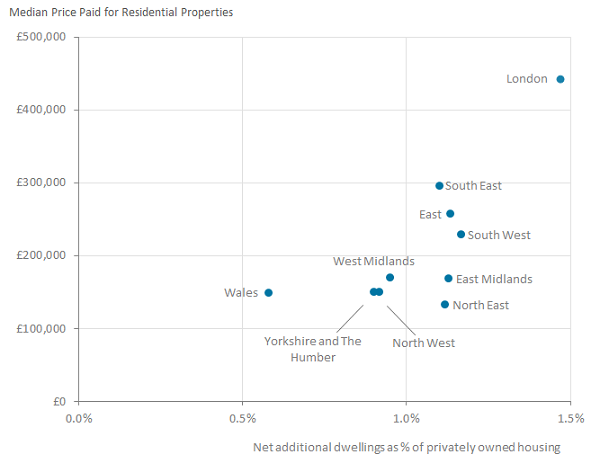
The local authority with the highest amount of house building was Tower Hamlets (London) with 4,827 net additional dwellings (6.91% of total privately-owned housing stock) in 2016. This was an increase of 2,443 since 2015. Among the top 20 local authorities for net additional dwellings, most were the larger cities and urban areas (Liverpool, Leeds, Bristol, Manchester and six local authorities in London were all in the top 20). Cornwall and Wiltshire however, both in the South West of England, were third and fourth highest respectively indicating a large amount of development in these areas despite being less urban. Blackpool was the lowest local authority for net additional dwellings in 2016 and the only local authority to have a negative figure (negative 146) showing that fewer residential properties were being built than being demolished in this local authority.
Notes for: House building
- The Stats Wales average weekly rents figures represent a 12-month period basis between April and March.
14. Housing market activity
Looking at housing market activity can be useful to compare housing stock turnover across local authorities in England and Wales. To do this, we examine the number of residential property sales as a percentage of the total privately-owned stock for each area. The numbers of residential property sales alone are useful, but not all geographical areas are the same size or have the same amount of house building and housing stock. By looking at sales as a percentage of privately-owned stock, we can compare across areas to pick out areas with the most housing market activity.
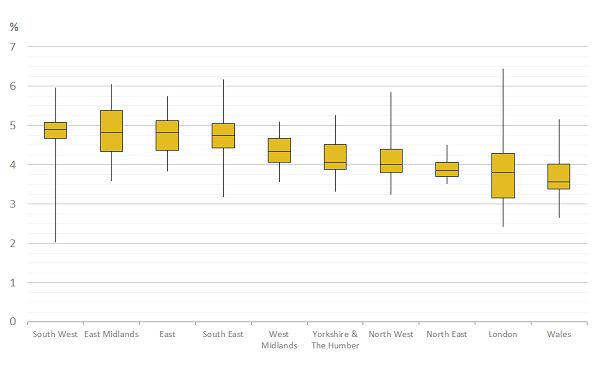
England and Wales has had a small decrease in residential property sales as a percentage of privately-owned stock, by 0.05 percentage points. England had a decrease of 0.06, while in Wales there was an increase of 0.13 percentage points. Figure 14 shows the distribution of the local authority housing market activity within English regions and Wales. The chart shows that local authorities in London, the South West and the South East had the widest range of housing market activity. The South West generally had the highest market activity in 2016, although not all local authorities had more activity here than in other regions.
Tower Hamlets in London had the highest housing market activity in England and Wales in 2016, with the number of residential property transactions representing 6.4% of the privately-owned housing stock. The lowest level of housing market activity was in Isles of Scilly, where property transactions represented 2% of the stock.
Figure 14: Distribution of housing market activity for local authorities within English regions and Wales
England and Wales 2016
Source: Office for National Statistics, Department for Communities and Local Government, Stats Wales
Notes:
- Data from House Price Statistics for Small Areas, Number of dwellings by Tenure and Dwelling stock estimates by tenure.
- Data on number of residential property sales is based on year ending December (Quarter 4) for England and Wales.
- England dwelling stock by tenure data is at 1 April 2016.
- Wales dwelling stock by tenure data is based on 2015/16 for 2016.
Download this image Figure 14: Distribution of housing market activity for local authorities within English regions and Wales
.png (16.8 kB) .xls (28.2 kB)
About half of local authorities in England and Wales had a decrease in housing market activity in 2016. Figure 15 shows that three out of the five local authorities with the largest decrease between 2015 and 2016 were in London, with the biggest decrease in City of London of 2.65 percentage points. All London boroughs had lower housing market activity in 2016 than in 2015, with the exception of Tower Hamlets, which had an increase of 0.44 percentage points. The biggest increase overall was in Bolsover in the East Midlands, with an increase of 0.73 percentage points.
Figure 15: Change in property sales as a percentage of privately owned dwelling stock in the five local authorities with the largest increase and decrease
England and Wales, 2015 to 2016
Source: Office for National Statistics, Department for Communities and Local Government, Stats Wales
Notes:
- Data from House Price Statistics for Small Areas, Number of dwellings by Tenure and Dwelling stock estimates by tenure.
- Data on number of residential property sales is based on year ending December (Quarter 4) for England and Wales.
- England dwelling stock by tenure data is at 1 April each year.
- Wales dwelling stock by tenure data is based on 2014/15 for 2015 and 2015/16 for 2016.
Download this chart Figure 15: Change in property sales as a percentage of privately owned dwelling stock in the five local authorities with the largest increase and decrease
Image .csv .xls16. Vacant social housing
Data on social housing vacancies in England and Wales are available from Department for Communities and Local Government for England and Stats Wales for Wales. Vacant social housing in England uses private-registered provider and local authority vacancies for general needs and self-contained rent housing. The data for Wales includes vacancies from registered social landlords and local authorities and comprises general needs, sheltered, extra-care and other supported-rent housing. Vacant social housing when expressed as a percentage of total social housing stock gives a figure that can be used to compare across geographies, giving an indication of the vacant social housing market.
Aggregating vacant social housing for both England and Wales, as well as total social housing for the two countries, results in a figure for England and Wales as a whole. In 2016, there was 1.19% of social housing vacant in England and Wales overall, a decrease of 0.17 percentage points since 2015.
Figure 17 shows vacant social housing as a percentage of total social housing for regions in England and Wales in 2016. The percentage of social housing that was vacant in 2016 was highest in Wales (1.9%) and lowest in the East of England (0.7%).
The local authorities in Wales ranged from 0.7% in Torfaen to 4.2% in Blaenau Gwent. All local authorities in Wales except for Torfaen (0.68%), Isle of Anglesey (0.97%) and Merthyr Tydfil (1.06%) had a higher percentage of vacant social housing than the England and Wales average in 2016. In the East of England, where the percentage of vacant social housing was at its lowest in England, the range of local authorities was between 0.1% in King's Lynn and West Norfolk to 2.1% in Uttlesford. Out of the 47 local authorities in the East of England, 40 were below the England and Wales average.
Figure 17: Vacant social housing as a percentage of total social housing, by English regions and Wales
England and Wales, 2016
Source: Department for Communities and Local Government, Stats Wales
Notes:
- Data from Vacant dwellings, Vacancies, Number of dwellings by Tenure and Dwelling stock estimates by tenure.
- Vacant social housing in England uses private registered provider and local authority vacancies for general needs and self contained rent housing.
- Vacant social housing in Wales includes vacancies from registered social landlords and local authorities and comprises general needs, sheltered, extra care and other supported rent housing.
- Data on vacancies for England are taken as at October each year.
- Data on vacancies for Wales is taken as at 31 March each year.
- Dwelling stock by tenure data in England is at 1 April each year.
- Dwelling stock by tenure data in Wales is based on 2015/16 for 2016.
Download this chart Figure 17: Vacant social housing as a percentage of total social housing, by English regions and Wales
Image .csv .xls17. Social housing shortfall
Social housing shortfall refers to the number of households on a local authority’s social housing waiting list minus vacant social housing. It is expressed as a percentage of the total social housing stock. Social housing waiting lists are not currently available for Wales, so only the local authority level data for England are reported here.
Social housing shortfall in 2016 for England was 28.7%, a decrease of 1.2 percentage points since 2015. Social housing shortfall has decreased in England by 14 percentage points since 2010. For local authorities within England, social housing shortfall ranged from 0% in Allerdale (North West) and Milton Keynes (South East) to 251% in Medway (South East). Most English local authorities in 2016 had social housing shortfall of less than 50%, with 288 under 50% and 38 local authorities above 50%. The six English local authorities with the highest percentage of social housing shortfall had more than a 100% shortfall.
Figure 18 shows the change in social housing shortfall for all local authorities in England, between 2015 and 2016. There were 53% of English local authorities that had an increase in social housing shortfall between 2015 and 2016. The largest increase between 2015 and 2016 was in Dacorum in the East of England, with an increase of 37 percentage points. Although more local authorities had an increase in social housing shortfall than had a decrease, there were relatively large decreases in some local authorities such as the Isle of Wight in the South East, decreasing by 102 percentage points and Camden in London, decreasing by 63 percentage points.
Figure 18: Change in percentage points of social housing shortfall as a percentage of social housing stock, between 2015 and 2016 for local authorities
England, 2015 to 2016
Source: Department for Communities and Local Government, Stats Wales
Notes:
- Data from Number of households on waiting lists and Number of dwellings by Tenure.
- Number of households on waiting lists are as at 1st April.
- Dwelling stock by tenure data in England is at 1st April each year.
Download this image Figure 18: Change in percentage points of social housing shortfall as a percentage of social housing stock, between 2015 and 2016 for local authorities
.PNG (11.3 kB) .xls (65.0 kB)
18. Glossary
Affordability of home ownership
The ratio of median house price to median gross full-time workplace-based annual salary. Calculated by dividing the median price paid for residential properties by median gross annual salary. Data is taken from the same sources for England and Wales.
Repossessions
The number of mortgage and landlord possession actions in the county courts of England and Wales. Data is taken from the same sources for England and Wales.
Cost of private rent
The Valuation Office Agency (VOA) publishes statistics on median monthly private rent for local authorities in England by number of bedrooms and overall. Welsh data is collected separately through Rent Officers Wales and includes data from private landlords and letting agents. No overall median is available for Wales, but there is a breakdown by number of bedrooms. Data for England and Wales come from different sources, but similar information is collected to allow comparisons.
Monthly salary
Median annual salary divided by 12 to derive median monthly salary. Data is taken from the Annual Survey of Hours and Earnings (ASHE) and looks at workplace-based full-time workers in England and Wales. Data is taken from the same sources for England and Wales.
Affordability of private renting
The median monthly private sector rent as a percentage of median gross monthly salary, for workplace-based earnings. Data is not directly comparable between England and Wales, as England is based on overall private rents, whereas Wales is based on two-bedroom properties for private rent. This is due to there being no overall available data for Wales, and two bedrooms being the most common number of bedrooms for private rent in Wales.
Cost of social rent
Social rent costs for England refers to general needs social housing from privately registered providers only, and excludes local authority provided social housing. For Wales, average social rent cost is based on all social housing stock so includes social rent from registered social landlords and local authorities (and includes self-contained general needs, sheltered, other supported and extra care units).
Data from England and Wales are therefore not directly comparable.
Weekly salary and social housing
Tenth percentile weekly salaries are analysed in relation to socially-rented accommodation in England and Wales. This is due to those living in socially-rented accommodation typically having lower earnings than those living in other tenures.
Data are taken from the same sources for England and Wales.
Affordability of social housing
Average weekly social housing rent cost as a percentage of 10th percentile gross weekly salary, for full-time workplace-based earnings. Data are not directly comparable between England and Wales. The cost of social rent for England only includes private registered providers whereas for Wales, average social rent cost is based on all social housing stock so includes social rent from registered social landlords and local authorities (and includes self-contained general needs, sheltered, other supported and extra care units).
Privately-owned housing
Privately-owned housing stock as a percentage of total housing stock. Privately-owned housing stock consisted of stock that are owner occupied or privately rented.
Data for England and Wales come from different sources, but similar information is collected to allow comparisons.
House building
Number of net additional dwellings as a percentage of privately-owned housing stock. Net additional dwellings in England cover building of new properties, conversions, changes of use and demolitions. For Wales, the data is focused on new house building only. Data on the private sector stock for England and Wales come from different sources, but similar information is collected to allow comparisons.
Housing market activity
Number of residential property sales as a percentage of privately-owned housing. Data on number of residential house sales are taken from the same source and therefore are directly comparable. However, data on the private sector stock for England and Wales come from different sources, but similar information is collected to allow comparisons.
Social housing stock
Social housing stock as a percentage of total housing stock. In England, social housing dwelling stock consists of private-registered providers, local authorities and other public stock. Private-registered providers only include self-contained general needs dwellings and bed spaces. Intermediate rented stock was included as general needs from 2012, but was not included as socially-rented stock before 2012. In Wales, social housing dwelling stock consists of registered social landlords and local authorities. Wales contains both self-contained and non self-contained dwellings (and includes general needs, sheltered, other supported and extra care units). It excludes intermediate tenures and other tenures not at social rent and assume three bed spaces are equal to one dwelling.
Vacant social housing
Vacant social housing as a percentage of total social housing. Vacant social housing in England uses private-registered provider and local authority vacancies for general needs and self-contained rent housing. Vacant social housing in Wales includes vacancies from registered social landlords and local authorities and comprises general needs, sheltered, extra-care and other supported-rent housing.
Social housing shortfall
Number of households on a local authority’s social housing waiting list minus vacant social housing. Expressed as a percentage of social housing stock. Social housing waiting lists are not currently available for Wales.
Nôl i'r tabl cynnwys
15. Social housing stock
Social housing as a percentage of total housing stock provides some useful insight into the size of the social housing market relative to the overall housing market.
In England, social housing dwelling stock consists of private-registered providers, local authorities and other public stock. Private-registered providers only include self-contained general needs dwellings and bed spaces. Intermediate rented stock was included as general needs from 2012, but was not included as socially-rented stock before 2012.
In Wales, social housing dwelling stock consists of registered social landlords and local authorities. Wales contains both self-contained and non self-contained dwellings and includes general needs, sheltered, other-supported and extra-care units. It excludes intermediate tenures and other tenures not at social rent and assumes three bed spaces are equal to one dwelling.
In 2016, social housing stock was 17.3% of total housing in England, while in Wales it was 15.9%. These were both decreases from 2015, of 0.08 and 0.05 percentage points, respectively. The social housing stock as a percentage of total housing has been steadily decreasing since 2010, by 0.4 percentage points in England and 0.2 in Wales. This is likely due to social housing stock levels increasing at a slower rate than privately owned housing.
Figure 16 shows social housing stock as a percentage of total housing for the top and bottom five local authorities in England and Wales, for 2016. The highest five local authorities for social housing as a percentage of total housing stock were all in London, Hackney (42.9%) having the highest percentage of all local authorities in England and Wales. The lowest five local authorities were in the East of England (Castle Point), South East (Medway) and North West (Fylde, Wyre and Ribble Valley).
Figure 16: Social housing as a percentage of total housing stock for the top and bottom five local authorities
England and Wales, 2016
Source: Department for Communities and Local Government, Stats Wales
Notes:
Download this chart Figure 16: Social housing as a percentage of total housing stock for the top and bottom five local authorities
Image .csv .xlsThe range between top and bottom local authority for social housing as a percentage of total housing has decreased each year since 2012. This is due to the top local authorities in England and Wales not increasing in social housing as a percentage of total housing as much as the bottom local authorities.
Nôl i'r tabl cynnwys