Cynnwys
- Main points
- Things you need to know about this release
- House prices increasing faster than earnings
- Affordability gap widens over time
- Housing affordability worsening fastest in London boroughs
- Housing affordability improvement most likely to be driven by earnings
- Effect of workplace-based and residence-based earnings on housing affordability
- Links to related ONS statistics
- Quality and methodology
1. Main points
On average, working people could expect to pay around 7.6 times their annual earnings on purchasing a home in England and Wales in 2016, up from 3.6 times earnings in 1997.
The median price paid for residential property in England and Wales increased by 259% between 1997 and 2016; median individual annual earnings increased by 68% in the same time period.
The most affordable local authority in 2016 was Copeland, with house prices being on average 2.8 times greater than annual earnings, whereas Kensington and Chelsea was the least affordable with house prices being 38.5 times greater than annual earnings.
The gap between the least affordable and most affordable parts of England and Wales has increased over the last 2 decades; housing affordability has worsened in all local authority districts.
Housing affordability has worsened fastest in London boroughs over the last 2 decades.
2. Things you need to know about this release
Housing affordability is calculated by dividing house prices by annual earnings. House prices are taken from the House Price Statistics for Small Areas (HPSSAs) produced by the Office for National Statistics (ONS) and refer to the median and lower quartile price paid for residential properties in England and Wales. They are calculated using open data from the Land Registry, a source of comprehensive record level administrative data on residential property transactions. Earnings data are from the Annual Survey of Hours and Earnings (ASHE) and refer to median and lower quartile gross annual earnings for full-time employees.
These housing affordability statistics transferred to ONS from the Department for Communities and Local Government (DCLG) in March 2017, with Tables 576 to 578 being discontinued and replaced by the data in this release. This is the first housing affordability release by ONS, which is accompanied by data tables and will be updated on an annual basis.
There are 2 housing affordability datasets available, each with a different basis on how earnings are recorded: workplace-based and residence-based. Workplace-based earnings refer to the earnings recorded for the area in which the employee works, whereas the residence-based earnings refer to the area in which the employee lives. All earnings in both datasets refer to gross full-time annual earnings where possible, but annualised weekly earnings are used when annual earnings are not available from ASHE but weekly earnings are. The analysis in this statistical bulletin uses earnings data based on the place of work rather than the place of residence, unless stated otherwise. This measure of affordability indicates the extent to which employees can afford to live where they work, not where they necessarily already live.
There is a longer time series of affordability ratios calculated using workplace-based earnings, as data extends back to 1997, whereas residence-based earnings start at 2002. Annualised weekly earnings are not produced on an identical basis to annual earnings and are therefore not directly comparable. Annualised weekly earnings can be relatively unstable over time and across areas because some areas have a greater number of seasonal employees than others, which can affect the median earnings data at different points in the year. Therefore, care should be taken when comparing a housing affordability ratio derived from annual earnings against a ratio derived from annualised weekly earnings.
The earnings data from ASHE provide a snapshot of earnings at April in each year. The house price statistics from the HPSSAs report the price paid for residential property referring to a 12-month period with April in the middle (year-ending September). The smallest areas for which statistics are presented are local authority districts, of which there are 348 in England and Wales. The largest area available is England and Wales overall. Other geographies for which statistics are published in this release are English regions and counties.
ASHE data is survey-based and therefore there is a degree of uncertainty in the earnings estimates because they are based on a sample of the population rather than the entire population. Sampling error is estimated through providing the coefficient of variation (CV) for each estimate, which is the ratio of standard error of an estimate to the estimate itself, expressed as a percentage. These can be accessed in the original ASHE datasets and can be used to assess the quality of each estimate. We have retained all estimates, even when the CV is between 10 to 20% and so it is important to consider the margins of error around the earnings estimates used to derive these housing affordability statistics.
The house price data used in the affordability ratios in this release are based on the HPSSA data published in March 2017. These statistics can be revised quarterly but the annual affordability ratio statistics in this release will not be revised to reflect this each quarter. Instead the entire back series of these affordability ratio statistics will be revised annually, as part of each new release.
Nôl i'r tabl cynnwys3. House prices increasing faster than earnings
In England and Wales overall, the housing affordability ratio more than doubled between 1997 and 2016. In 1997, house prices were on average around 3.6 times workers’ annual gross full-time earnings, whereas in 2016 workers could typically expect to spend around 7.6 times annual earnings on purchasing a home.
Figure 1 shows that England had a higher affordability ratio than Wales every year since 1997, meaning that housing in England is less affordable relative to workplace-based earnings. The gap between affordability ratios for England and Wales was smallest in 1997 and largest in 2016, with housing in England becoming less affordable at a quicker rate than in Wales after the economic downturn.
Figure 1: Ratio of median house price to median annual earnings
England and Wales, 1997 to 2016
Source: House Price Statistics for Small areas and Annual Survey of Hours and Earnings, Office for National Statistics
Notes:
- Data for annual earnings are not available before 1999. For these years the ratio of house price to earnings has been calculated using annualised weekly earnings. Annualised weekly earnings are not produced on an identical basis to annual earnings and are therefore not directly comparable.
Download this chart Figure 1: Ratio of median house price to median annual earnings
Image .csv .xlsHousing affordability has worsened over time in England and Wales (the affordability ratio has increased), but the ratios themselves do not tell us whether this is driven by changes in house prices or changes in earnings. Figure 2 shows that the median price paid for residential property in England and Wales has increased more than the median annual salary since 1997. This is largely driven by larger increases in house prices between 1997 and 2008 (192% increase) than between 2009 and 2016 (30% increase).
Since 1997, the median price paid for residential property in England and Wales increased by 259% whereas median annual earnings increased by 68%. Housing affordability has therefore worsened over time.
Figure 2: Median price paid for property and annual earnings indices
England and Wales, 1997 to 2016
Source: House Price Statistics for Small areas and Annual Survey of Hours and Earnings, Office for National Statistics
Notes:
- Data for annual earnings are not available before 1999. For these years the earnings relate to annualised weekly earnings. Annualised weekly earnings are not produced on an identical basis to annual earnings and are therefore not directly comparable.
Download this chart Figure 2: Median price paid for property and annual earnings indices
Image .csv .xls4. Affordability gap widens over time
In 2016, Kensington and Chelsea was the least affordable area to buy a property in England and Wales. It had the highest ratio of house prices to annual earnings, with house prices being 38.5 times the median gross annual earnings. This has increased since 1997 when house prices were 11.8 times earnings.
Copeland in Cumbria was the most affordable local authority district in England and Wales to buy a property in 2016, with house prices being on average 2.8 times the median gross annual earnings. This has increased since 1997 when house prices were on average 1.96 times earnings. Although Copeland is the most affordable local authority in England and Wales, it does not mean that this local authority has the lowest house prices or the highest earnings; rather it has the highest earnings in relation to the house prices. All 338 local authorities in England and Wales for which data are available have had an increase in the affordability ratio between 1997 and 2016, and so housing affordability has worsened over time.
Housing affordability has not worsened at the same rate across all local authorities. In 1997, Merthyr Tydfil was the most affordable local authority in England and Wales, with an affordability ratio of 1.9. However, Merthyr Tydfil was no longer the most affordable local authority in 2016, with an affordability ratio of 3.8. There were 3 local authorities more affordable in 2016: Copeland, Neath Port Talbot and Blaenau Gwent. Kensington and Chelsea did remain the least affordable local authority every year between 1997 and 2016, when excluding the Isles of Scilly1.
Figure 3 compares the affordability ratio for the most and the least affordable local authority in England and Wales for 2016, showing how they have changed over the last 2 decades. By including the 95% confidence intervals, we can see that Kensington and Chelsea has not had any statistically significant year-on-year change in affordability ratio. However, the most recent year with a significantly lower affordability ratio than in 2016 was 2011.
The most affordable local authority in 2016, Copeland, had one year of significant year-on-year change in affordability, between 2003 and 2004. The most recent year in which Copeland had a significantly lower affordability ratio than in 2016 was 2003, showing that areas with the lowest housing affordability are the areas most likely to worsen.
Figure 3: Ratio of median house price to median annual earnings for the most and least affordable local authorities
England and Wales, 1999 to 2016
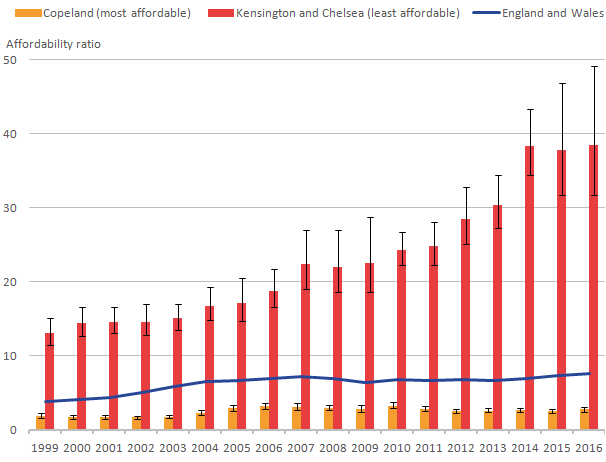
Source: House Price Statistics for Small areas and Annual Survey of Hours and Earnings, Office for National Statistics
Notes:
- The local authorities selected are based on the most and least affordable in 2016. This does not mean that these local authorities were the most or least affordable in every year of the time series.
Download this image Figure 3: Ratio of median house price to median annual earnings for the most and least affordable local authorities
.png (10.5 kB) .xls (34.8 kB)
The least affordable areas have had worsening affordability at a quicker rate than the most affordable, making the gap between the most and least affordable areas widen.
Notes for: Affordability gap widens over time
- Housing affordability ratio data are not available for all years except 1998 and 2009 because earnings estimates are not available for these years. Therefore the Isles of Scilly have been excluded from this part of the analysis.
5. Housing affordability worsening fastest in London boroughs
In 2016, of the 10 least affordable local authorities 7 were in London. This is an increase from 5 out of the 10 least affordable local authorities in 1999. Figure 4 shows that 9 out of the 10 local authorities with the largest increase in affordability ratio between 1999 and 2016 are in London. For example, in 1999 an employee in Camden could expect to pay 7.7 times their annual earnings on purchasing a property, whereas in 2016, they could expect to spend on average 19.6 times their annual earnings.
Out of the 10 local authorities that had the smallest increase in affordability ratio between 1999 and 2016, there were 5 in the North West, 3 were in Wales and 2 were in the North East. In Hyndburn, in the North West of England, an employee could expect to spend 2.6 times their annual earnings on purchasing a property in 1999, but this increased to 4.1 times their annual earnings in 2016.
Figure 4: Change in median affordability ratio in the 10 local authority districts with the largest and smallest increase
England and Wales, 1999 to 2016
Source: House Price Statistics for Small areas and Annual Survey of Hours and Earnings, Office for National Statistics
Notes:
- Data for annual earnings are not available for South Bucks in 2016. The change in affordability ratio has been calculated using annualised weekly earnings for 2016. Annualised weekly earnings are not produced on an identical basis to annual earnings and are therefore not directly comparable.
Download this chart Figure 4: Change in median affordability ratio in the 10 local authority districts with the largest and smallest increase
Image .csv .xlsFigure 5 is an interactive map, which shows housing affordability ratios over time for each local authority district. It shows that affordability has worsened the most in and around London over the last 2 decades, but that affordability has worsened everywhere in England and Wales to some extent.
Figure 5: Change in the median housing affordability ratio, local authority district
England and Wales, 1997 to 2016
Embed code
6. Housing affordability improvement most likely to be driven by earnings
House prices increased in 93% of local authority districts in England and Wales between 2015 and 2016. In the same year, there were no significant changes in earnings for any local authority. However, there were increases in affordability, even in areas in which house prices increased.
There were 97 local authorities that became more affordable in 2016, which is around 28% of all local authorities in England and Wales. If we look at the percentage change in house prices and earnings in these 97 local authorities, 93 had a higher percentage change in earnings than in house prices. Therefore, earnings appear to be the main driver of improvements in housing affordability in areas where housing affordability improved, however, it is important to consider that the annual changes to earnings in these areas were not necessarily statistically significant and so it is possible that these improvements in housing affordability were the result of chance rather than an underlying trend.
Figure 6 shows the percentage change in house prices and earnings separately for the 5 local authorities that had the largest increase and the largest decrease in affordability ratio between 2015 and 2016. It shows that house prices increased by more than 10% in all 5 of the local authorities in which the affordability worsened the most. Not only have house prices increased, but average earnings decreased in these 5 areas. In 4 out of the 5 local authorities, the percentage change in house prices was greater than the percentage change in earnings. In Rochford, earnings decreased by almost 12% in 2016, which, in percentage terms, was a larger decrease than the increase in house prices (10.7%).
All of the 5 local authorities that have had the largest improvement in housing affordability had an increase in earnings in 2016. Both Allerdale and East Devon had decreases in house prices, but the decrease in house price in these 2 local authorities was smaller, in percentage terms, than the increase in earnings. Generally, house prices have driven any worsening of housing affordability, whereas increases in earnings have driven any improvements in affordability in areas, despite increasing house prices.
Figure 6: Percentage change in median house prices and earnings in the 5 local authorities with the largest increase and decrease in affordability ratio
England and Wales, 2015 to 2016
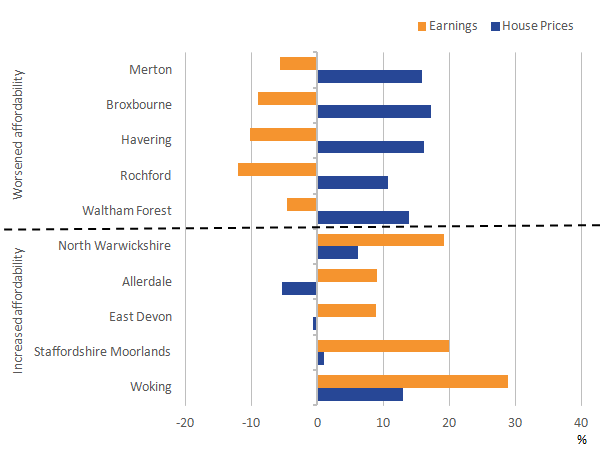
Source: House Price Statistics for Small areas and Annual Survey of Hours and Earnings, Office for National Statistics
Notes:
- Data for annual earnings are not available for Allerdale and Staffordshire Moorlands in 2016. For these areas the percentage change in earnings has been calculated using annualised weekly earnings for 2016. Annualised weekly earnings are not produced on an identical basis to annual earnings and are therefore not directly comparable.
Download this image Figure 6: Percentage change in median house prices and earnings in the 5 local authorities with the largest increase and decrease in affordability ratio
.png (14.4 kB)
7. Effect of workplace-based and residence-based earnings on housing affordability
When looking at the workplace-based affordability ratios, we are looking at whether people can afford to live where they work, which effectively reflects the house-buying power of employees. If we look at residence-based affordability ratios, then we are looking at what the people who live in a given area earn in relation to that area’s house prices, even if they work elsewhere. This measure does not consider that people may be getting higher earnings from working in other areas.
Figure 7 shows the affordability ratio of each local authority in England and Wales, based on the 2 different methods of recording earnings: workplace-based and residence-based. The maps show that there are relatively higher affordability ratios in the surrounding areas of London when the workplace-based earnings are used. This is because many people living in surrounding areas of London commute into the city to higher-paid jobs than available outside of London. People who work in the surrounding areas are more likely to have lower-paid jobs than those working in London, but these areas still have relatively high house prices compared with the rest of England and Wales, leading to relatively worse housing affordability for those who both work and live in surrounding areas of London.
When residence-based earnings are used to describe housing affordability, this is less likely to be the case. For example, a worker could live in the surrounding areas of London and commute into the city to a higher-paid job than would be available outside of London. For that person, the house prices are generally slightly lower where they live in the surrounding areas of London, but they earn the higher wages of London, making the residence-based figure relatively more affordable than the workplace-based figure.
Figure 7: Workplace-based and residence-based median housing affordability, by local authority district
England and Wales, 2016
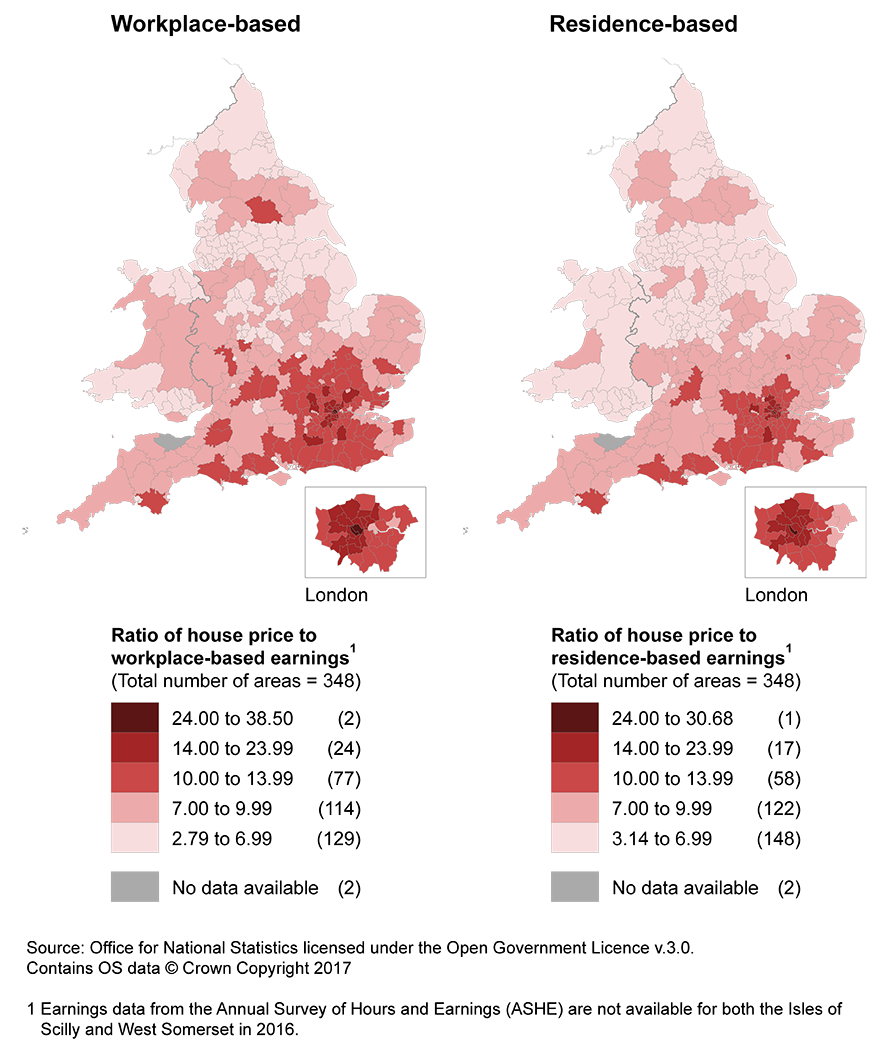
Source: House Price Statistics for Small areas and Annual Survey of Hours and Earnings, Office for National Statistics licensed under the Open Government Licence v.3.0. Contains OS data © Crown Copyright 2017
Notes:
- Earnings data from the Annual Survey of Hours and Earnings (ASHE) are not available for both the Isles of Scilly and West Somerset in 2016.
Download this image Figure 7: Workplace-based and residence-based median housing affordability, by local authority district
.png (394.4 kB) .xls (68.6 kB)
Within London, there were more local authorities with higher affordability ratios when using workplace-based earnings, reflecting higher house prices in London and higher earnings in more central London local authorities. The 2 maps suggest that employees in London commute to areas with higher-paid jobs, making it appear relatively more affordable to live outside of London.
Nôl i'r tabl cynnwys9. Quality and methodology
The Housing Affordability Quality and Methodology Information document contains important information on:
the strengths and limitations of the data and how it compares with related data
uses and users of the data
how the output was created
the quality of the output including the accuracy of the data
Details of the policy governing the release of new data are available in the UK Statistics Authority’s Code of Practice for Official Statistics
Nôl i'r tabl cynnwys