1. Main points
These estimates are experimental, using a methodology detailed in New nowcasting methods for more timely quarterly estimates of UK total public service productivity, and based on quarterly national accounts data.
In 2015, year-on-year productivity for total public services in the UK is estimated to have fallen by 0.6% as year-on-year input growth (2.1%) exceeded output growth of 1.5%, leading to a drop in the ratio of outputs to inputs.
Productivity increased by 0.9% in 2014 year-on-year, with the output and inputs of total public services growing by 2.3% and 1.4% respectively.
Between 2009 and 2015, total public service productivity has increased, on average, by 0.5% per year.
In Quarter 2 (Apr to June) 2016, productivity for total public services increased by 0.2% relative to the previous quarter and was 0.5% higher than in Quarter 2 2015.
These estimates use a greater degree of estimation and a different methodology so as to deliver more timely estimates, compared with our previously published annual public service productivity figures, which are published with a 2 year lag. The 2014 estimates will be updated later in 2016 when the data becomes available to feed into the established methodology.
Nôl i'r tabl cynnwys2. Understanding public service productivity
Productivity of public services is estimated by comparing growth in total output with growth in total inputs used. Productivity will increase when more output is being produced for each unit of input. Estimates of output, inputs and productivity are given both as growth rates between consecutive periods and as indices that show the cumulative trend over time.
Estimated growth rates of output and inputs for individual public services are aggregated by their relative share of total expenditure on public services (expenditure weight) to produce estimates of total public service output, inputs and productivity.
Inputs are composed of expenditure on labour, goods and services, and of consumption of fixed capital. They are adjusted for inflation using a suitable price index (deflator). Expenditure data used to estimate inputs growth are taken from the quarterly national accounts (QNA).
The QNA provides estimates of government output as chained volume measures as part of the estimate for general government final consumption expenditure (GGFCE). The QNA published volume series of total GGFCE is taken as the volume of output for quarterly public service productivity.
Further information on quality and methodology can be found in the Quality and Methodology Information paper, which describes the intended uses of the statistics presented in this release, their quality and a summary of the methods used to produce them.
Nôl i'r tabl cynnwys3. About quarterly public service productivity
We produce annual estimates of total public service productivity and breakdowns of specific areas including healthcare, education and adult social care. These annual estimates are produced with a 2-year lag, which reduces their value in public sector planning.
This article presents experimental estimates for quarterly total public service productivity, inputs and output to provide a short-term, timely indicator of the future path of the annual total productivity estimates. New nowcasting methods for more timely quarterly estimates of UK total public service productivity gives information on the methodology and data sources behind the new quarterly estimates.
Further research is being conducted into improving the experimental quarterly productivity estimates, including accounting for changes in service quality where we have, for now, assumed the quality of services provided remains constant throughout the nowcasted period. These statistics are still in a state of early development and we continue to welcome comments on the methods and results presented in this article. These can be sent to fred.foxton@ons.gov.uk.
Nôl i'r tabl cynnwys4. Interpreting these statistics
This release reports total public service productivity estimates up to Quarter 2 (Apr to June) of 2016. Estimates are presented in annual growth rates up until 2015 and on quarter-on-quarter growth up to Quarter 2 2016.
Annual estimates are taken from annualised quarterly data and are comparable to the existing annual series over the period 1997 to 2013, both showing a broadly similar trend of rising productivity in the latest period. Differences between the annual and quarterly “nowcast” public service productivity estimates are a result of differences in the estimates of output and inputs. Details of these can be found in New nowcasting methods for more timely quarterly estimates of UK total public service productivity.
This methodology article highlights caveats and methods for producing the quarter-on-quarter growth estimates and should be referenced when reporting on specific quarterly movements. This is especially the case for the latest quarters, which are more liable to be subject to revisions.
Nôl i'r tabl cynnwys5. Annual public service productivity
In 2015, total public service productivity is estimated to have fallen by 0.6%, as inputs grew by 2.1% exceeding output growth of 1.5%. This followed a productivity increase of 0.9% in 2014, with the output and inputs of total public services growing by 2.3% and 1.4% respectively.
Figure 1 shows the annual total public service productivity series, with growth from 2014 and 2015 taken from the nowcast quarterly series. The experimental estimates suggest that, while experiencing a contraction in the latest period, for the last 6 years productivity of UK public services has been on an upwards trend. Since 2009, total public service productivity is estimated to have increased by 3.2% or an annual average 0.5% growth. As a result, total public service productivity after 2013 has exceeded its peak in 1998.
Figure 1: Total UK public service annual productivity with quarterly constructed estimate, 1997 to 2015

Source: Office for National Statistics
Notes:
- Estimates for 2014 and 2015 reflect growth rates of the annualised quarterly total public service productivity applied to the quality adjusted annual total public service productivity.
Download this image Figure 1: Total UK public service annual productivity with quarterly constructed estimate, 1997 to 2015
.png (23.8 kB) .xls (32.3 kB)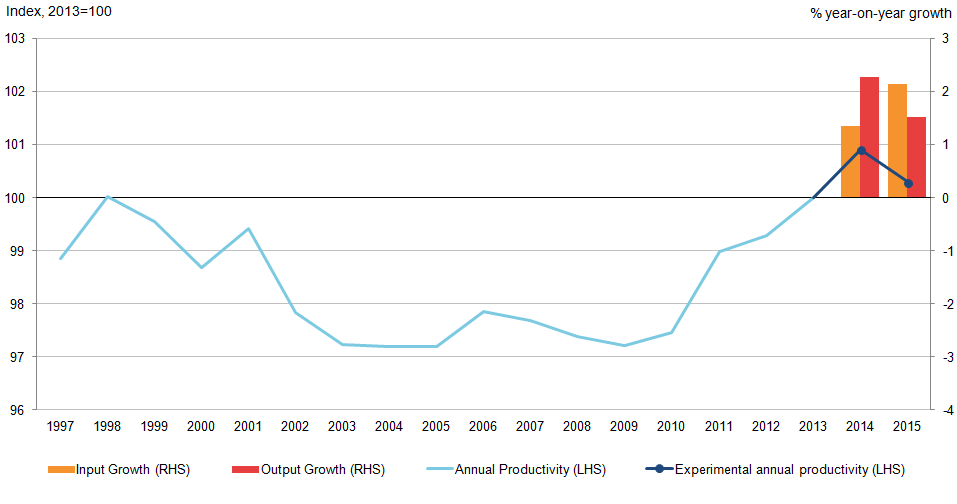
Further analysis on annual total public service productivity prior to 2013, including the contribution of individual services, can found in Public service productivity estimates: total public service, 2013.
Nôl i'r tabl cynnwys6. Quarterly public service productivity
Looking at the quarterly path, shown in Figure 2, productivity was on a slight upwards trend from the start of 2011 until the end of 2014. Since then, productivity has been lower than the Quarter 4 (Oct to Dec) 2014 peak, although it has recovered slightly in the latest quarters. In Quarter 2 (Apr to June) 2016, total public service productivity rose by 0.2% relative to the previous quarter. This followed on from a 0.1% increase in Quarter 1 (Jan to Mar) 2016.
Figure 2: Quarterly total UK public service productivity, Quarter 1 (Jan to Mar) 2011 to Quarter 2 (Apr to June) 2016, seasonally adjusted
Source: Office for National Statistics
Notes:
- All estimates are based on experimental quarterly total public service productivity.
- Estimates of productivity are indirectly seasonally adjusted, calculated using seasonally adjusted inputs and seasonally adjusted outputs.
Download this chart Figure 2: Quarterly total UK public service productivity, Quarter 1 (Jan to Mar) 2011 to Quarter 2 (Apr to June) 2016, seasonally adjusted
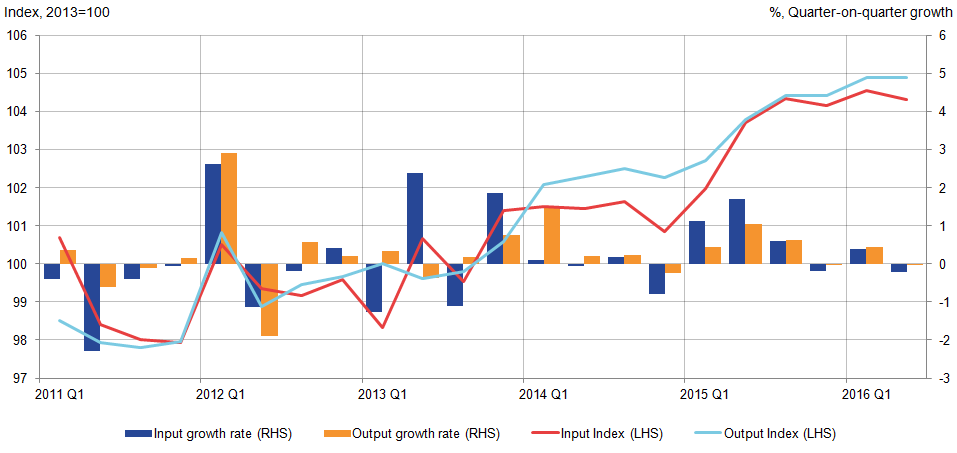
Image .csv .xlsBreaking down the productivity estimate into the underlying changes in inputs and output of total public services, Figure 3 shows that the latest rise in quarterly productivity was driven by a 0.2% decrease in inputs whilst outputs remained flat. This meant there was an increase in the ratio of outputs to inputs, leading to an increase in productivity.
Figure 3: Quarterly total UK public service inputs and output, Quarter 1 (Jan to Mar) 2011 to Quarter 2 (Apr to June) 2016, seasonally adjusted
Source: Office for National Statistics
Notes:
- All estimates are based on experimental quarterly total public service productivity.
- Estimates are directly seasonally adjusted.
Download this image Figure 3: Quarterly total UK public service inputs and output, Quarter 1 (Jan to Mar) 2011 to Quarter 2 (Apr to June) 2016, seasonally adjusted
.png (34.2 kB)
Trends in quarterly total public service output, inputs and productivity estimates are mostly determined by those service areas where quarterly data are readily available, for example, health care. A large proportion of activity data used to estimate the volume of output are annual data. This has subsequently been converted to a quarterly series – split evenly among the 4 quarters – reducing the impact these components have on volatility.
Further information on data sources for quarterly total public service productivity can be found in the Quality and Methodology Information paper and in New nowcasting methods for more timely quarterly estimates of UK total public service productivity.
Nôl i'r tabl cynnwys7. Revisions
All estimates, by definition, are subject to statistical “error”, but in this context the word refers to the uncertainty inherent in any process or calculation that uses sampling, estimation or modelling. Most revisions reflect either the adoption of new statistical techniques, or the incorporation of new information which allows the statistical error of previous estimates to be reduced.
Public service productivity estimates operate an open revisions policy. This means that new data or methods can be incorporated at any time and will be implemented for the entire time series. As this article is produced using more timely data it involves a degree of estimation where data are incomplete.
Compared with the previous edition published on 8 July 2016, a number of revisions have been incorporated, including:
- revisions within the quarterly national accounts back to Quarter 1 (Jan to Mar) 2015
- use of alternative measure of price indices
These revisions mean that the fall in productivity in 2015 was greater than previously estimated, revised downwards from negative 0.2% to negative 0.6%. This was largely down to increased estimates for inputs, with growth of inputs in 2015 revised upwards from 1.5% to 2.1%, although output for 2015 was also revised up from 1.4% to 1.5%. These revisions incorporated regular financial year returns containing more comprehensive data and greater granularity of expenditure allocation.
For local government, these include the incorporation of the 2015/16 financial year provisional outturn data for England and the first estimates for the 2016/17 financial year, based on budget data provided by Local Authorities across the UK. For central government, it is the incorporation of the 2015/16 financial year provisional outturn from HMT.
Table 1 summarises the differences between previously published and the latest quarterly estimates for inputs, output and productivity growth.
Table 1: Revisions to experimental quarterly total UK public service productivity, inputs and output, Quarter 1 (Jan to Mar) 2011 to Quarter 1 (Jan to Mar) 2016
| United Kingdom | ||||||
| Percentage points | ||||||
| Inputs | Output | Productivity | Inputs | Output | Productivity | |
| Q-on-Q | Q-on-Q | Q-on-Q | Q-on-Q-a-year-ago | Q-on-Q-a-year-ago | Q-on-Q-a-year-ago | |
| 2011 Q1 | -0.0 | 0.0 | 0.0 | -0.0 | 0.0 | 0.0 |
| 2011 Q2 | -0.1 | 0.0 | 0.1 | -0.2 | 0.0 | 0.2 |
| 2011 Q3 | 0.0 | 0.0 | -0.0 | -0.1 | 0.0 | 0.1 |
| 2011 Q4 | 0.1 | 0.0 | -0.1 | -0.0 | 0.0 | 0.0 |
| 2012 Q1 | 0.1 | 0.0 | -0.1 | 0.2 | 0.0 | -0.2 |
| 2012 Q2 | -0.1 | 0.0 | 0.1 | 0.2 | 0.0 | -0.2 |
| 2012 Q3 | 0.0 | 0.0 | -0.0 | 0.1 | 0.0 | -0.1 |
| 2012 Q4 | 0.1 | 0.0 | -0.1 | 0.1 | 0.0 | -0.1 |
| 2013 Q1 | 0.1 | 0.0 | -0.1 | 0.0 | 0.0 | -0.0 |
| 2013 Q2 | -0.1 | 0.0 | 0.1 | 0.0 | 0.0 | -0.0 |
| 2013 Q3 | -0.1 | 0.0 | 0.1 | -0.1 | 0.0 | 0.1 |
| 2013 Q4 | 0.1 | 0.0 | -0.1 | 0.0 | 0.0 | -0.0 |
| 2014 Q1 | 0.0 | 0.0 | -0.0 | -0.1 | 0.0 | 0.1 |
| 2014 Q2 | -0.0 | 0.0 | 0.0 | 0.1 | 0.0 | -0.1 |
| 2014 Q3 | -0.2 | 0.0 | 0.2 | -0.0 | 0.0 | 0.0 |
| 2014 Q4 | 0.2 | 0.0 | -0.2 | 0.0 | 0.0 | -0.0 |
| 2015 Q1 | -0.1 | 0.0 | 0.1 | -0.1 | 0.0 | 0.1 |
| 2015 Q2 | 0.8 | 0.0 | -0.7 | 0.7 | 0.0 | -0.7 |
| 2015 Q3 | 0.2 | 0.3 | 0.2 | 1.1 | 0.4 | -0.7 |
| 2015 Q4 | -0.3 | -0.2 | 0.1 | 0.7 | 0.2 | -0.4 |
| 2016 Q1 | 0.2 | -0.0 | -0.2 | 0.9 | 0.2 | -0.7 |
| Source: Office for National Statistics | ||||||
| Note: | ||||||
| 1. All estimates are based on experimental quarterly total public service productivity | ||||||
| 2. Estimates of productivity are indirectly seasonally adjusted, calculated using seasonally adjusted inputs and seasonally adjusted output. | ||||||
Download this table Table 1: Revisions to experimental quarterly total UK public service productivity, inputs and output, Quarter 1 (Jan to Mar) 2011 to Quarter 1 (Jan to Mar) 2016
.xls (21.5 kB)With relatively larger revisions occurring in the most recent quarters – in line with QNA revisions – there has been a long run impact on input time series. This is as a result of using alternative price indices, so as to improve coverage and representativeness but remains consistent with the methods paper.
Nôl i'r tabl cynnwys8. Future developments
This article presents updated experimental quarterly total public service productivity, inputs and output series, aiming to provide a more timely indicator of the likely trend in the existing annual series. These estimates are based on sources different from those used to estimate annual total public service productivity. The sources used here contain less detail and necessarily involve a greater degree of estimation than annual estimates produced later. As a result, they are not proposed replacements for previous figures and are intended as estimates for the more recent period. We aim to assess the impact of these differences and to address issues such as quality adjustment, direct measures, the treatment of annual data and the geographical and service level breakdown in future work.
Feedback on the use of these estimates and suggestions for improvements will be essential for the future development of timely estimates for public service productivity. All feedback is welcome and can be sent to fred.foxton@ons.gov.uk.
Nôl i'r tabl cynnwys9. Quality and methodology
The Quarterly public service productivity estimates: Total public services Quality and Methodology Information document contains important information on:
- the strengths and limitations of the data and how it compares with related data
- users and uses of the data
- how the output was created
- the quality of the output including the accuracy of the data
Manylion cyswllt ar gyfer y Erthygl
Related publications
- Productivity flash estimate and overview, UK: January to March 2026 and October to December 2025
- Labour productivity, UK: October to December 2019
- Measuring output in the Information Communication and Telecommunications industries: 2016
- Management practices and productivity in British production and services industries - initial results from the Management and Expectations Survey: 2016
- Quality adjusted labour input: UK estimates to 2016
- International comparisons of UK productivity (ICP), first estimates: 2016
- Developing labour market metrics for the market sector, UK: 2016