1. Main points
- Output per hour worked in the UK was 15.1% below the average for the rest of the G7 advanced economies in 2016; this compares with 15.5% in 2015.
- Output per worker in the UK was 15.4% below the average for the rest of the G7 in 2016.
- Compared with the rest of the G7, the UK had above average productivity growth in both output per hour and output per worker terms in 2016.
- Output per hour was lower in all G7 countries in 2016 than would have been the case if pre-downturn trends had continued since 2007.
- The UK’s “productivity puzzle” – the difference between post-downturn productivity performance and the pre-downturn trend – was 15.8% in 2016; this was the largest in the G7 and was almost double the average of 8.8% across the rest of the G7.
This edition forms part of our quarterly productivity bulletin, which also includes an overarching commentary, the Office for National Statistics’ headline labour productivity statistics and quarterly estimates of public service productivity.
Nôl i'r tabl cynnwys2. Things you need to know about this release
This bulletin contains annual estimates of labour productivity for the G7 developed countries (Canada, France, Germany, Italy, Japan, UK and US) up to 2016. Labour productivity measures the amount of economic output that is produced by a unit of labour input and is an important measure of economic performance.
Output is measured by gross domestic product (GDP). Labour input is measured in two ways – by total hours worked and by the number of workers in employment. These two measures of labour input can yield different results, reflecting differences in working patterns across countries and compositional movements over time, such as changes in the part-time share of employment.
Comparability across countries is achieved by using estimates of GDP and labour inputs from a common source (the Statistics Directorate of the Organisation for Economic Co-operation and Development (OECD)) as far as possible. These are the best data available for international comparisons at the time of publication, although they may differ from the Office for National Statistics’ (ONS’) headline measures.The headline labour measures which OECD publish will differ slightly in their seasonal profile. We convert local currency-based measures of GDP using purchasing power parity (PPP) exchange rates, which attempt to equalise the cost of a representative basket of goods and services in countries with different national currencies. An article by ONS explaining the uses and limitations of PPPs is available.
OECD has recently discontinued the publication of their Annual Labour Force Statistics (ALFS) database total employment measure, which has historically been used as the employment measure for this release. For the missing recent years in the total employment series, Eurostat (for European countries) and an alternative OECD employment series (for non-European countries) are used to project the data. This method is being used on an interim basis pending a more detailed review of the international comparisons of productivity (ICP) labour inputs and further engagement with OECD. We will report on progress with this work in our January 2018 Productivity Bulletin with the aim of delivering an improved source in our April 2018 International Comparisons of Productivity release.
The labour productivity measures in this bulletin are presented in terms of current prices, suitable for cross-country comparison of levels of productivity for a single year and constant prices, suitable for analysis of productivity performance over a number of years.
The estimates in this release update those published on 5 April 2017. This release cycle reflects the publication and revision cycles of the component data series.
Alongside this release, estimates by industry are also published in a short note. However, it is important to note that these are experimental estimates and not National Statistics.
More information on methodology and interpretation is available in the Quality and methodology section of this bulletin.
Nôl i'r tabl cynnwys3. UK productivity shortfall with the G7 stable in 2016
Current price GDP per hour worked
On this basis, UK productivity in 2016 was:
- above that of Japan by 12.0%
- above that of Canada by 3.4%
- lower than that of Italy by 9.0%
- lower than that of the US by 21.8%
- lower than that of France by 22.3%
- lower than that of Germany by 25.6%
- lower than that of the rest of the G7 by 15.1%
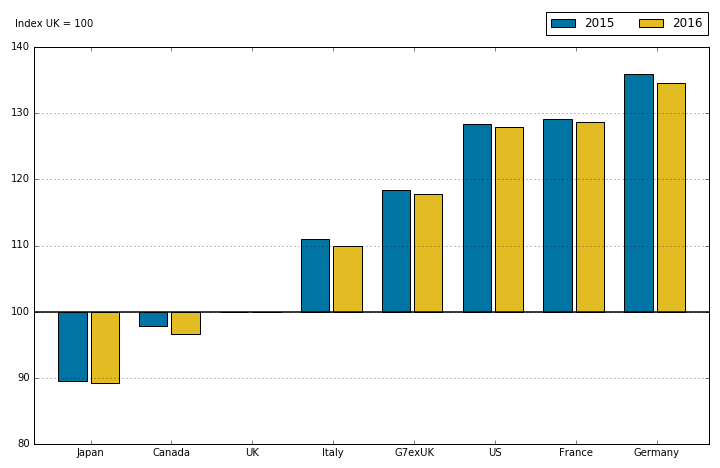
Figure 1: Gross domestic product per hour worked, G7 countries
2015 and 2016
Source: Organisation for Economic Co-operation and Development, Eurostat and Office for National Statistics calculations
Notes:
- The percentage point differences relative to the UK presented in Figure 1 will differ from the percentages given in the above bullet points. This occurs because the percentages given in the bullet points refer to the UK’s position relative to each other country, whereas the percentage point differences in the chart refer to the other country’s position relative to the UK.
Download this image Figure 1: Gross domestic product per hour worked, G7 countries
.png (12.8 kB) .xls (24.6 kB)
As shown in Figure 1, the ranking of nations by their productivity did not change between 2015 and 2016. The UK’s productivity gap with the rest of the G7 fell slightly from 15.5% in 2015 to 15.1% in 2016; while the gaps between the UK and the US, France and Germany remained substantial. The extent to which the US and France outperformed the UK was slightly reduced; however, the gap with Germany narrowed more substantially.
In 2016, the UK continued to outperform Canada on a gross domestic product (GDP) per hour worked basis, with this gap expanding considerably. Canada's current price productivity growth was slower than that of the UK because while both countries experienced growth in total hours worked, the UK's current price GDP growth was stronger than that of Canada. The UK remained more productive than Japan in 2016.
Current price GDP per worker
Final estimates for 2016 show that UK output per worker was:
- above that of Japan by 9.6%
- below that of Canada by 1.8%
- below that of Germany by 8.5%
- below that of France by 11.5%
- below that of Italy by 11.8%
- below that of the US by 26.5%
- below that of the rest of the G7 by 15.4%
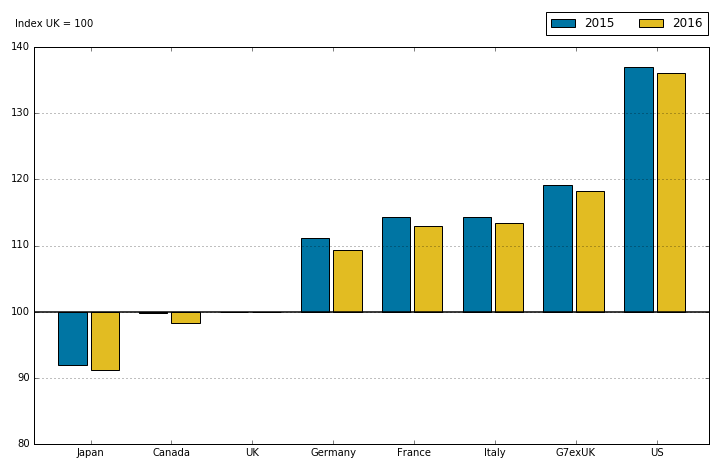
Figure 2: Gross domestic product per worker, G7 countries
2015 and 2016
Source: Organisation for Economic Co-operation and Development, Eurostat and Office for National Statistics calculations
Notes:
- The percentage point differences relative to the UK presented in Figure 2 will differ from the percentages given in the above bullet points. This occurs because the percentages given in the bullet points refer to the UK’s position relative to each other country, whereas the percentage point differences in the chart refer to the other country’s position relative to the UK.
Download this image Figure 2: Gross domestic product per worker, G7 countries
.png (12.7 kB) .xls (24.6 kB)
The productivity shortfall between the UK and the rest of the G7 in terms of output per worker narrowed slightly to 15.4% in 2016, down from 16.1% in 2015. The UK’s productivity performance improved relative to all of the G7 countries, with the largest improvements relative to Canada, Germany and France. Canada had very similar but slightly lower productivity levels compared with the UK on a GDP per worker basis in 2015 and this gap increased substantially in 2016 solidifying the UK’s position on this basis.
Different movements in average hours across countries account for differences in the patterns of productivity shown in Figures 1 and 2. For example, the productivity gap between the UK and the US is wider in terms of output per worker than in terms of output per hour because, on average, US workers work more hours than UK workers. On the other hand, the productivity differential between the UK, and Germany and France is wider in terms of output per hour than in terms of output per worker, as German and French workers work fewer hours than their UK counterparts.
Nôl i'r tabl cynnwys4. Productivity slowdown greater in the UK than the other G7 economies
Constant price GDP per hour worked
Figure 3 shows gross domestic product (GDP) per hour worked for the UK and an aggregated series for the rest of the G7, together with simple projections based on average productivity growth over 1997 to 2007 (prior to the global economic downturn). On this basis, the combination of strong UK productivity growth up to 2007 and its weak productivity performance since 2007 implies a productivity gap of around 15.8% in 2016. In other words, output per hour in 2016 was around 15.8% lower than under a counterfactual scenario where UK productivity continued to grow at its pre-downturn trend since 2007.
Figure 3: Constant price gross domestic product per hour worked, actual and projections
1997 to 2016
Source: Organisation for Economic Co-operation and Development, Eurostat and Office for National Statistics calculations
Notes:
- This figure presents annual data and uses gross domestic product (GDP) as opposed to gross value added (GVA) as the numerator. Furthermore, the OECD use non-seasonally adjusted (NSA) hours, whereas ONS use seasonally adjusted (SA) hours. NSA hours are different to SA hours primarily due to the non-working day adjustment in the seasonal adjustment process. Therefore, there may be slight differences between Figure 3 and the equivalent chart presented in the Labour productivity quarterly bulletin.
Download this chart Figure 3: Constant price gross domestic product per hour worked, actual and projections
Image .csv .xlsThe UK’s average annual productivity growth between 1997 and 2007 was 0.2 percentage points higher than the average of the rest of the G7 advanced economies. Since 2007, productivity growth across the rest of the G7 has been stronger than the UK. This implies a narrower productivity gap for the rest of the G7 of around 8.8% in 2016.
The projections used in Figure 3 commence from 2008, however, when reviewing the performance of the rest of the G7, it can be argued that the slowdown in productivity growth began in 2005, preceding the economic downturn. Projecting from 2005 would result in a larger gap for the G7 excluding the UK, than that shown in Figure 3.
Figure 4 illustrates the difference in productivity trajectories over recent years between the G7 economies. Output per hour fell in most G7 countries during the downturn in 2008 and 2009, before rebounding sharply in Canada and the US. However, a slowdown in growth can be observed in several countries before this, with German growth slowing from 2004, while Italy has grown relatively slowly over the entire 1997 to 2016 period. Comparing average productivity growth rates since 2007, the UK ranks second bottom; only Italy had lower productivity growth over this period.
Figure 4: Constant price gross domestic product per hour worked, G7 countries
1997 to 2016
Source: Organisation for Economic Co-operation and Development, Eurostat and Office for National Statistics calculations
Download this chart Figure 4: Constant price gross domestic product per hour worked, G7 countries
Image .csv .xls5. Revisions
Historical data used in this publication are subject to revision between publications. Datasets R1 and R2 compare the latest estimates with estimates from the previous release on 5 April 2017. Note that because Tables 1 and 2 are indexed to UK equals 100, revisions to the UK are zero by definition in Tables R1 and R2.
The main source of revisions in this release is changes to UK current and constant price gross domestic product (GDP), which have been adjusted upwards slightly throughout the 1995 to 2016 period. This is due to revisions resulting from Blue Book methodological improvements. The mass of these revisions come from improvements to estimates of rental (both actual and imputed) being made as part of the regular annual update of the UK National Accounts (Blue Book). This change has increased the level of UK GDP in current and constant prices by around or under 1% in each year throughout the period. However, it is worth noting that the scale of these revisions is small in comparison with those observed in the previous two editions of this release – revisions stemming from Blue Book 2016 and purchasing power parity (PPP) revisions respectively. Full details of the changes from Blue Book 2017, including the impact of these changes on GDP, the sector and financial accounts (SFA) and balance of payments (BoP) can be found in a summary article.
The revisions to the source data are as follows:
- France, Germany, Italy and the US have all had small upward revisions to GDP in 2014 and 2015; the largest revisions are those to French current price GDP, which was revised up by 0.4% and 0.6% in 2014 and 2015 respectively
- The series used to measure Japanese employment (civilian employment) has had an upward revision of 0.6% in 2011
- The US has had small revisions (mostly negative) to average hours throughout the time series
- There have also been some small revisions to average hours for Canada in 1999, 2003 to 2004 and 2014 to 2015, as well as similarly small revisions for Germany and Italy but only in 2014 and 2015
- There have been no revisions to PPPs between this release and the previous edition of international comparisons of productivity (ICP)
7. Recent highlights
The following publications on the topic of productivity are also available:
UK productivity introduction: Apr to June 2017 draws together the headlines of the productivity releases into a single release, providing additional analysis of our productivity statistics (published 6 Oct 2017).
Labour productivity: April to June 2017 contains the latest estimates of labour productivity for the whole economy and a range of industries, together with estimates of unit labour costs (published 6 Oct 2017).
Quarterly UK public service productivity (experimental statistics): April to June 2017 contains the latest experimental estimates for quarterly UK total public service productivity, inputs and output (published 6 Oct 2017).
International comparisons of UK productivity (ICP), first estimates: 2016 presents an international comparison of labour productivity across the G7 nations, in terms of growth in GDP per hour and GDP per worker (published 6 Oct 2017).
International comparisons of labour productivity by industry: 2014 uses new production-side PPPs to present estimates of labour productivity for 29 European countries across 10 industries on a GVA per hour worked basis (published 6 Oct 2017).
Quality adjusted labour input: UK estimates to 2016 presents updated estimates of quality adjusted labour input (QALI) for the whole economy and for the market sector (published 6 Oct 2017).
Foreign direct investment and labour productivity: a micro-data perspective: 2012 to 2015 examines the composition of firms with foreign direct investment (FDI) in Great Britain between 2012 and 2015, and their productivity outcomes compared with firms with no FDI relationships (published 6 Oct 2017).
Quality adjustment of public service criminal justice system output: experimental method: 1997 to 2014 presents new methodologies to capture changes in quality of outputs of the criminal justice system, expanding ONS’s coverage of quality adjustment for public service output (published 6 Oct 2017).
Introducing industry-by-region labour metrics and productivity presents new, experimental industry-by-region productivity metrics; this includes measures of hours worked, jobs, and accompanying productivity measures for the SIC letter industries in the NUTS1 regions (published 5 July 2017).
Introducing division level labour productivity estimates provides an overview of new and experimental estimates of labour productivity at the two-digit SIC industry level for the UK and provides some initial analysis demonstrating trends in the data (published 5 July 2017).
Regional and sub-regional productivity in the UK: Jan 2017 provides statistics for several measures of labour productivity; statistics are provided for the NUTS1, NUTS2 and NUTS3 sub-regions of the UK and for selected UK city regions (published 6 January 2017).
Understanding firms in the bottom 10% of the labour productivity distribution in Great Britain: “the laggards”, 2003 to 2015 examines the characteristics of businesses in the bottom 10% of the labour productivity distribution in terms of their size, age, industry and location, between 2003 and 2015 (published 5 July 2017).
Multi-factor productivity estimates: Experimental estimates to 2015 decomposes output growth into the contributions that can be accounted for by labour and capital inputs; the contribution of labour is further decomposed into quantity (hours worked) and quality dimensions (published 5 April 2017).
Developing new measures of infrastructure investment: July 2017 is the first in a series of papers on infrastructure statistics, focusing on definitional and data challenges in measuring infrastructure investment (published 5 July 2017).
Volume index of UK capital services (experimental): estimates to 2015 provides estimates of the contribution of capital inputs to production in the market sector, split by asset and industry (published 6 January 2017).
Public service productivity estimates: total public service, UK: 2014 presents updated measures of output, inputs and productivity for public services in the UK between 1997 and 2013, in addition to new estimates for 2014; includes service area breakdown, as well as impact of quality adjustment and latest revisions (published 6 January 2017).
Public service productivity estimates: healthcare, 2014 presents updated estimates of output, inputs and productivity for public service healthcare in the UK between 1995 and 2013, and new estimates for 2014 (published 6 January 2017).
8. Quality and methodology
The International Comparisons of Productivity Quality and Methodology Information report contains important information on:
- the strengths and limitations of the data and how it compares with related data
- uses and users of the data
- how the output was created
- the quality of the output including accuracy of the data
For this release the base year for purchasing power parities (PPPs) is 2014, which is the latest year for which the Organisation for Economic Co-operation and Development (OECD) PPP series have been benchmarked.
The output measure used here (gross domestic product (GDP)) differs from that used for the Office for National Statistics’ (ONS’) headline measure of productivity (gross value added (GVA)). In the national accounts, GDP is valued at market prices and GVA is valued at basic prices. The principal difference is that basic prices exclude taxes and subsidies on products, such as VAT and excise duties. For further information on the relationship between GVA and GDP see Chapter 4 of the ONS Productivity Handbook.
GVA is the preferred measure of output for productivity purposes. However, as OECD does not produce output level series using basic prices over the necessary time period and PPPs are based on market prices, GDP is used in this bulletin. Differences between the growth rates of GVA and GDP are not normally significant.
Estimates of labour inputs (employment and hours worked) are taken from OECD where available, supplemented in some cases by other sources. Differences between OECD estimates and national sources reflect adjustments made by OECD to achieve greater consistency between national estimates. Furthermore, OECD’s use of non-seasonally adjusted (NSA) hours as opposed to seasonally adjusted (SA) hours will cause inconsistencies with national sources. NSA hours are different to SA hours primarily due to the non-working day adjustment in the seasonal adjustment process. There may also be timing differences as national sources are updated outside the OECD revision cycle.
Current price productivity estimates are indexed to UK equals 100 for each year and show each country’s productivity relative to that of the UK in that year. Since productivity is an important determinant of living standards, these estimates also provide an indication of living standards relative to the UK. In interpreting these estimates you should bear in mind that PPPs provide only an approximate conversion from national currencies and may not fully reflect national differences in the composition of a representative basket of goods and services. Additionally, care should be taken in interpreting movements in current price productivity estimates over time. For example, an increase in UK productivity relative to another country could be due to UK productivity growing faster, or falling less, or due to changes in relative prices in the two countries, or some combination of these movements.
Constant price productivity estimates are indexed to a particular year. For each country, these estimates are very similar to national labour productivity series. The index year is set at 2007 in order to focus on movements in labour productivity over the economic downturn. These estimates, conversely to the current price estimates, show the evolution of productivity for each country and for the G7 (and G7 excluding the UK) aggregates, but should not be used to compare productivity across countries at a point in time. Productivity growth can be decomposed into growth of output minus the growth of labour input and these components can move in different directions within and across countries. This should be borne in mind in interpreting the constant price productivity estimates in this release.
Nôl i'r tabl cynnwys