2. Acknowledgements
The authors appreciate contributions from participants of the workshops organised by the ONS/IET/Ofcom group. We also wish to thank colleagues from Prices and National Accounts Divisions of ONS for their contributions to this paper.
Nôl i'r tabl cynnwys3. Introduction
The persistent stagnation of labour productivity in the UK and other major economies as shown by conventional metrics, since the economic downturn in 2008, has placed a spotlight on economic statistics and the question of whether current methods accurately capture the rapid developments of the modern economy. The Independent Review of UK Economic Statistics, conducted by Professor Sir Charles Bean (Bean 2016), identified the challenge of measuring output of digital industries and services, as well as assessing the impact of the rapid growth of the electronic economy (e-economy) as central to this issue. From an engineer’s perspective it is also a concern that measurable large and rapid improvements in the quality and quantity of delivered products per unit cost do not directly result in gains as shown in metrics such as productivity. This paper summarises the interim findings of a working group composed of the Office for National Statistics (ONS), the Institution of Engineering and Technology (IET), the Office for Communications (Ofcom), ONS research fellows and members of the academic community, formed to address these issues as they relate to the Information and Communications industry in the UK.
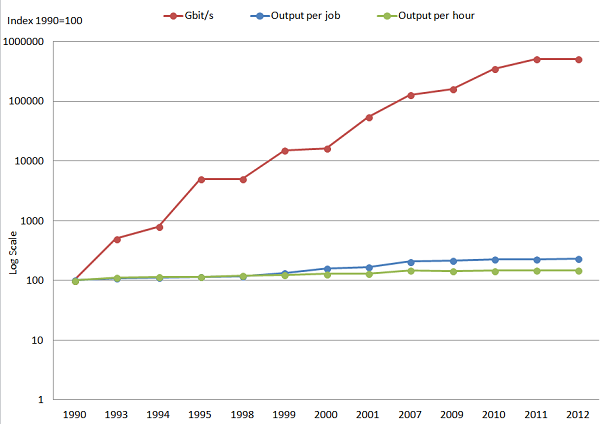
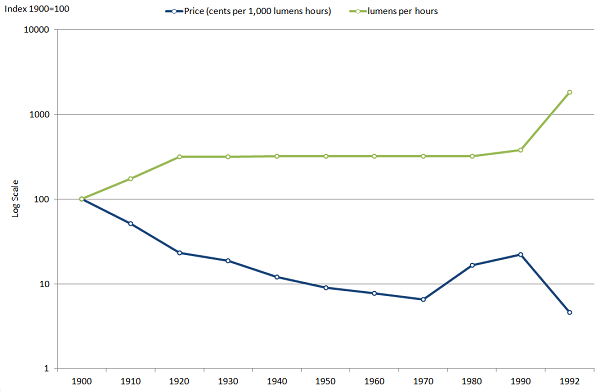
Although technological change is not a new phenomenon, there is widespread consensus that the pace of change has been relatively fast during the past 30 years – in particular since the advent of the internet and rapid growth of computational power – Figure 1 shows the exponential growth in data transmission rates over this period. Economists view technological change as an enabler of both productivity and welfare gains, allowing individuals and businesses to conduct their activities more efficiently, and also increasing consumer surplus, i.e. the increase in welfare above the price paid for goods or services. As firms adopt new processes, techniques or designs, they are able to produce a greater quantity or quality of products with a smaller quantity of inputs. As a consequence, the adoption of new technology is often associated with changes in (a) product prices and (b) the range of products available. For example, Figure 2 illustrates how price falls with each technological improvement in lighting technology. The phenomenon of falling prices even as technology improves is observed in many information, communication and technology (ICT) products such as personal computers and laptops.
Figure 1: Highest single-fibre data transmission rate and UK labour productivity
Source: Institution of Engineering and Technology (IET), Southampton University, Office for National Statistics
Download this image Figure 1: Highest single-fibre data transmission rate and UK labour productivity
.png (32.6 kB) .xls (26.6 kB)
Figure 2: Price in cents and improvements in lighting technology
Source: Nordhaus (1998) and author's calculations
Notes:
- Change from Advanced Carbon to Tungsten filament lamps in 1920.
- Change from Tungsten filament lamps to Compact florescent bulbs in 1992.
Download this image Figure 2: Price in cents and improvements in lighting technology
.png (25.4 kB) .xls (26.1 kB)This form of rapid technological change can pose challenges for the consistent measurement of economic quantities – in particular where the aim is to assess the value or volume of a product which either (a) changes in character considerably over a short period, (b) is made available on the market for the first time, or (c) is made available at a price which does not reflect the additional economic welfare it generates1. The conceptual challenge however is not new. The weakness of productivity growth in recent years sits uneasily with considerable evidence of technological change – particularly in the digital sphere – leading to the suspicion that measurement is an issue with these technologies.
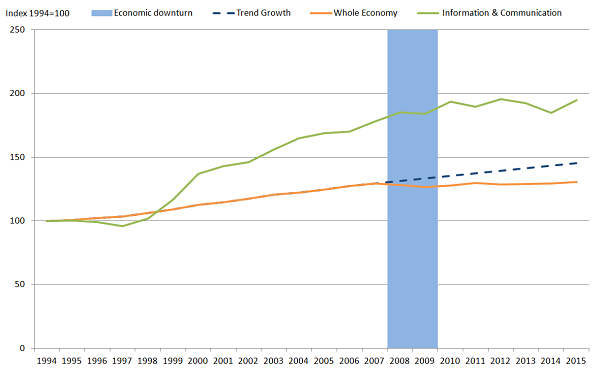
Industry experts consider that improvements in ICT technology, and its related wider productivity gains should be observable in economic statistics. The debate has 2 strands of literature, one which argues that technology change has actually slowed (for example, Gordon, 2016), and the other arguing that technology change may not be reflected in the National accounts (for example, Solow 1988, and Bean, 2016). The central reason for this debate is perhaps best exemplified by the productivity record of the ICT industry. Figure 3 shows that the productivity growth of this industry was rapid relative to the UK economy as a whole in the early 2000s, but has slowed in recent years despite the apparent continued rapid pace of technological developments. It also raises a question about the impact of ICT adoption: if firms across the UK economy have been adopting new ICT methods and processes over the last 10 years, why has the UK’s labour productivity performance been relatively muted?
Figure 3: Output per hour - UK whole economy and the information and communication industry
Source: Office for National Statistics
Download this image Figure 3: Output per hour - UK whole economy and the information and communication industry
.png (30.7 kB)To understand better the challenges of measuring the output of the information and communications industry in particular, we have been working in collaboration with the Institution of Engineering and Technology (IET), the Office for Communications (Ofcom), ONS research fellows and members of the academic community. This industry was selected because almost all the main issues and challenges under debate – and highlighted in Bean (2016) – are important in this industry. To the extent that developments in ICT have an impact on other industries, the results of this work may also be more general, applying to a range of other forms of economic activity.
The Terms of Reference for the group were to:
- review concepts of measurement within the national accounts and wider industry perspectives
- review current methodology for estimating output in ICT industries, including prices (deflators) and quality adjustments
- explore alternative methods for measuring output, prices and appropriate quality adjustments
- review current measures of quality change and how they are reflected in the national accounts
- explore the availability, suitability and viability of use of alternative data sources in national accounting
- undertake analysis of robustness of alternative methods and/or data sources
- undertake sensitivity analysis on impacts of alternative data and/or methods
- make recommendations to ONS on proposed areas of improvement and provide support in implementation
Notes for introduction:
- Griliches (1994)
4. The review
This article sets out the interim findings of this group’s review of the challenges of output measurement in the information and communications industries. It sets out the scope of the review, the key measures of output that were considered and summarises the main issues and several potential solutions that emerged in discussion.
2.1 The scope of the review
The review focuses on Section J of the 2007 Standard Industry Classification (SIC2007) – Information and Communication, and within this section the activities of divisions 61 – Telecommunications, 62- Computer programming, consultancy and related activities, and 63 - Information service activities1. The review focused on the measurement of output in these industries, but also noted that for productivity, questions relating to self-employment and the ”e-economy” are also worthy of further consideration. The review of output measurement covered the adequacy of:
a. compilation methods of current and constant price gross value added (GVA)
b. coverage of the activities of the industry which are within the scope of the national accounts
c. measures of price change (deflation)
d. adjustments for quality in price deflators
e. various aspects of quality, value and utility from a consumer’s perspective
The choice of this industry as a case study also has noticeable advantages. First, its activities include those relating to the sale and provision of goods and services, including digital content, which covers the range from the relatively routine methodologies to the more complex areas of measurement. Secondly, the rate of technological change experienced in the industry in recent years makes it an appropriate test case to examine the potential measurement issues in relation to this change. Finally, investigation of whether data from the telecommunications regulator (Ofcom) could be used to supplement our data for more robust analysis appeared worthy of further consideration. Developments in this industry also sit at the centre of several cross-cutting issues set out in Bean (2016), including work on measuring the digital economy, the review of the boundary between gross domestic product (GDP) and Household Production, and Prices and Deflators developments.
2.2 The structure of the review
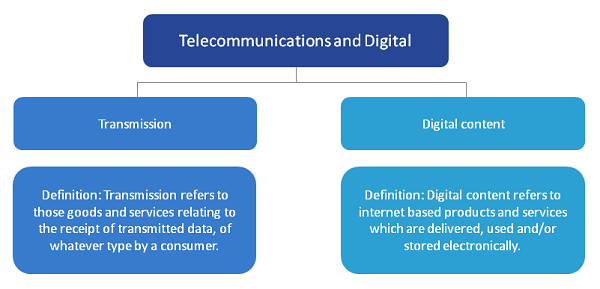
To provide a framework for the review and the discussions of the group, the activities of the telecommunications industries were separated into 2 broad groups - transmission and digital contents (Figure 4). Activities related to “Transmission” cover those goods and services relating to the receipt of transmitted data, while “digital content” relates to the provision of services via the transmitted data. These were then further broken down, to allow detailed discussions of the key issues under each category. For each category, the group discussed and raised important questions regarding:
- their coverage in the national accounts GVA measure
- the aptness of current quality adjustments methods on their price deflators, in particular the use of hedonic regression models
- the measurement of consumption and market value, especially for digital products. This review summarises the discussions that have been held as they relate to each of these items in turn.
Figure 4: Classification of activities within the telecommunication industry
Source: Office for National Statistics
Download this image Figure 4: Classification of activities within the telecommunication industry
.png (51.3 kB)2.3 Transmission
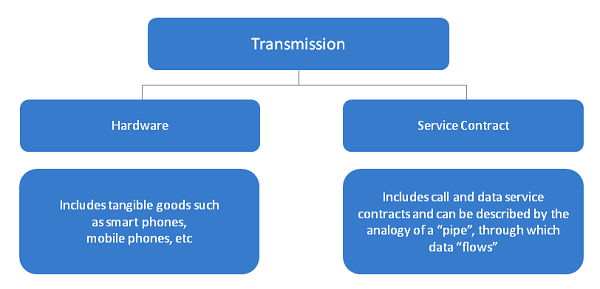
Activities related to “Transmission” cover those goods and services relating to the receipt of transmitted data, of whatever type, by the consumer. Products in this category include a broad array of different goods and services, which were further separated into “Hardware” and “Service contracts” (Figure 5).
Figure 5: Sub- categories within the transmission category
Source: Office for National Statistics
Download this image Figure 5: Sub- categories within the transmission category
.png (37.6 kB)2.3.1 Hardware components
These include tangible goods, such as tablets, smart phones and mobile phones (also referred to as feature phones). There was general consensus that these products are conceptually within the national accounts boundary and that current methods of measuring output should be able to adequately capture activities relating to the sale and distribution of hardware in current price terms.
The group reviewed the use of hedonic regressions to account for quality improvements within the price deflators used for this industry. Hedonic regression is one of a suite of quality adjustment methods that are widely used in the price deflator. These can broadly be categorised into implicit and explicit methods. Implicit methods make implicit assumptions on the quality change; for example, that the underlying price movement is the same as for other items. Explicit methods use characteristics of the product to attempt to explicitly calculate the value of the quality change and remove it from the price. Hedonic regression is part of the family of explicit methods of quality adjustment. For more information on the quality adjustment methods used, please see the Consumer Price Indices – Technical Manual (2014).
Hedonic adjustment models use regression techniques to relate the price of an item to its measurable characteristics. This method is well suited to items where the pace of change is fast, such as technological items. The method, however, can be very resource intensive, both in terms of developing and maintaining the models. A further drawback is the subjectivity involved in developing the regression models: two different analysts will most likely come up with two different models.
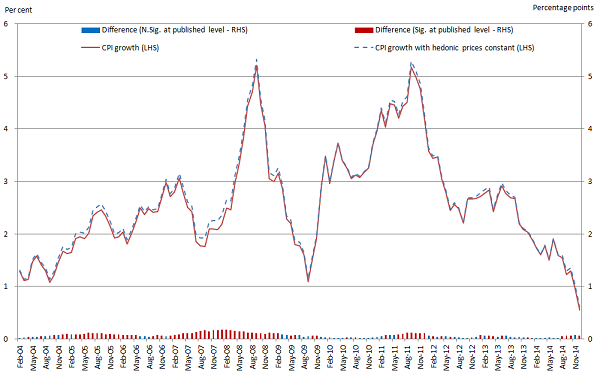
As outlined in Table 1, within the Communication division of the Consumer Price Index (CPI) – which forms part of the deflator for this industry – quality adjustments using hedonic techniques are only applied to the price of smart phones2. Implicit methods are used to quality adjust other items in this class. The group also noted that the impact of all hedonic adjustments within the CPI is very modest (Figure 6), as only a limited number of low-weight items currently received this treatment. The discussion suggested that there may be room to expand the use of hedonic adjustments, especially for communication services, as these have a much greater weight in the CPI and consumer expenditure.
Due to the resource intensive nature of hedonic modelling, the group is reviewing and assessing alternative quality adjustment methods such as the Fixed Effects with Window-Splicing (FEWS) method championed by Statistics New Zealand,in terms of both efficiency and application3. The method also eliminates the subjective aspect or the modelling process.
Table 1: Current and proposed scope for hedonic adjustments within the CPI Communication Division
| Service | Weight (within CPI division) | Quality adjustment applied | Possibility of hedonic adjustment? |
| Postal Services | |||
| Postal Charges | 6.5% | N/A | No |
| Telephone and Telefax Equipment and Services | |||
| Telephone | 3.7% | Class mean imputation | No |
| Smart phone handset | 0.9% | Hedonics | N/A |
| Fixed line telephone charges | 6.5% | Class mean imputation | No |
| Subscription to the internet | 2.8% | Class mean imputation | Yes |
| Blunded communication services | 42.1% | Class mean imputation | Yes |
| Mobile phone handset | 0.9% | Class mean imputation | N/A |
| Mobile phone charges - PAYG & Contract | 32.7% | Fixed quality | Yes |
| Cost of directory enquiries | 0.9% | Class mean imputation | No |
| Mobile phone applications | 1.9% | Class mean imputation | No |
| Mobile phone accessories | 0.9% | Class mean imputation | No |
| Source: Office for National Statistics | |||
| Notes: | |||
| 1. Detailed descriptions of quality adjustment methods can be found in Annex B. | |||
| 2. ONS considered the possibility of hedonic adjustment based on the product’s rate of change, measurable characteristics and high weight within the class. | |||
| 3. Items within the Consumer Price Index are group according to the United Nation’s Classification of Individual Consumption According to Purpose (COICOP) standards. | |||
| 4. Mobile phone handsets are not applicable since they were previously hedonically adjusted between 2007 and 2014. | |||
Download this table Table 1: Current and proposed scope for hedonic adjustments within the CPI Communication Division
.xls (29.2 kB)
Figure 6: Growth in UK Consumer Price Index with and without hedonic adjustments
Source: Office for National Statistics
Notes:
- Start date of hedonic items: PCs - 2004, Laptops - 2005, Smart phones - 2011, PC Tablets - 2012.
- CPI growth refers to percentage change over 12 months.
- N. Sig. refers to not-significant and Sig. refers to significant.
Download this image Figure 6: Growth in UK Consumer Price Index with and without hedonic adjustments
.png (60.3 kB) .xls (31.2 kB)2.3.2 Service contracts
These include call and data services, usually packaged in bundles to satisfy a variety of consumer profiles and requirements. In discussions, this was described using the analogy of a “pipe” through which data or telephony services “flow”. There was general consensus that these services are currently within the scope of the national accounting framework. However, the group noted complexities with regards to the disentanglement of products bundled with services (for example, a handset and a service contract) and the move from traditional telephony services towards a data driven telecommunications service. This raised questions regarding the current quality adjustment methods applied to the service components of the price deflator4.
The main questions that emerged include:
Can we use measures of data as a metric of output?
Telecommunication services are mostly provided through the transmission of information as data. Services can therefore be described in terms of data content, however it is conceptualised. The distinction between data in general and useful content is not simple to disentangle (see item 5).
The application of quality adjustment to measures of data services
Should the scope of hedonic quality adjustments in relation to the price deflator be expanded beyond ICT products to include ICT services. In other words, is there sufficient change in the quality of ICT services such as data services to justify applying more advanced quality adjustment techniques to their prices5? It should be noted that a variety of quality adjustment techniques are currently in use in the CPI, including within the Communications Division of the price index, so the question is whether the adjustments currently being used adequately account for the rate and scale of changes observed in the economy, and whether it is practical to improve current processes.
Over what period should quality adjustment take place?
Quality adjustment of prices is used to ensure comparability6 between 2 points in time. However, explicit quality adjustment – of the form of a hedonic approach, for example – is most applicable where relatively rapid changes in product attributes or prices are taking place. Identifying the appropriate period over which a new quality adjustment might be run is therefore a central question, will vary by product and is likely to depend on data availability. It is noteworthy that an annual chain linking tries to maintain comparability of the CPI basket after the yearly update to the basket of goods and services.
What factors should be taken into account to deliver appropriate quality adjustments?
A key consideration here is what constitutes a “quality change” and the methods by which it can be measured. These metrics are likely to vary on a case-by-case basis, but in the case of mobile phone charges, could take into account the number of inclusive minutes, texts and data, along with contractual arrangements such as roaming charges.
The review identified independent research in this area. For example, Corrado and Ukhaneva (2016)7 used data from the Organisation for Economic Co-operation and Development (OECD) to produce quality adjusted price deflators for broadband contracts for OECD countries, including the UK. We therefore consider that it should be feasible to produce a UK-only analysis.
Which service contracts should be quality adjusted?
In the mobile phone charges example, we could hedonically adjust the price change of the service contract as the “quality” of the contract improves. This raises questions about how to apply quality adjustments where consumers purchase a handset separately and then use a pay-as-you-go or other service-only contract.
The group discussed in detail the use of hedonic pricing models in the construction of price series for contracts. Hedonic adjustment is the approach currently used in the CPI to quality adjust prices of rapidly changing ICT products. This uses data on the characteristics of a product to identify changes in the implicit value of a comparable product through time – even where comparable products may not be available. Applying these techniques in the same way to contracts would require the right type and amount of data, covering a reasonable period of time to deliver reliable quality adjustments.
There were discussions on whether moving to an output data hedonic model (that is, a single measure of the output produced) may produce a less time-intensive method compared with the current approach which is input driven (that is, multiple input characteristics, such as size of RAM and size of screen). A review of this approach concluded that in relation to service contracts an important issue is whether outputs and inputs are essentially the same thing, that is, is the quantity of data paid for equal to the quantity of data used? In other words, when developing a hedonic model should we use the quantity of data used or quantity of data contracted? For example, if the data allowance has increased to such a level it is never wholly consumed, would a further increase be ‘visible’ to consumers?
The next step in this area involves investigating the feasibility of developing models to facilitate quality adjustment for service products.
Data compression and expansion (in internet services)
One of the primary technical issues considered by the group was how compression technologies have changed the capability of a unit of data to transmit more information and therefore become more powerful. This matters because in national accounting terms and in estimating price series, we need to be able to compare like-for-like products. Table 2 illustrates this. At face value, the amount of data purchased under the contract increases by 200% over the 3-year period. However, if compression enables, for example, 20% more information to be contained within a unit of data each year, the actual increase in like-for-like ‘data’ over the years is 320%.
Table 2: Illustration of data compression
Year 1 Year 2 Year 3 Data allowance in contract 100mb 200mb 300mb (+100%) (+200%) Compression factor 1 1.2 1.4 Adjusted data allowance (in Year 1 units) 100mb 240mb 420mb (+140%) (+320%) Source: Office for National Statistics Notes: 1. Figures for years 2 and 3 are compared with year 1. Download this table Table 2: Illustration of data compression
.xls (27.1 kB)At first glance we therefore consider that a ‘compression index’ may be required to adjust the raw data values to give a ‘volume’ of information on a consistent metric. We continue to seek advice on the best approach to address this. The group is reviewing whether data is available to inform an adequate assessment of whether the rate of compression is changing rapidly enough to make a significant impact on the amount of data consumed.
Is the service contract “content-blind”?
The group also considered whether it is appropriate to consider the transmission mechanism separately from the data content, or whether the value of the service contract is dependent on the quality of the content which can be accessed. For example, if the value of the contract to the consumer changes as more services become available, do we need to take account of the quality and range of the services provided in assessing their value?
This was illustrated by considering whether the value of a pipe changes if we put a commodity with a different value through it - is an oil pipe of a particular diameter and design valued differently to a water pipe of identical diameter and design?
In national accounting terms, the value of the contract ought to be defined separately from the value of the content which is accessed.
2.4 Digital content
Digital content refers to web-based products which are delivered, used and/or stored electronically. These include items such as online newspapers and magazines, Wikipedia, digital music, games, Netflix and others.
Firms that provide digital services generate revenue (turnover) in various ways, such as:
- charging for access (usually through subscriptions)
- selling information about their customers to third parties
- selling online advertising space
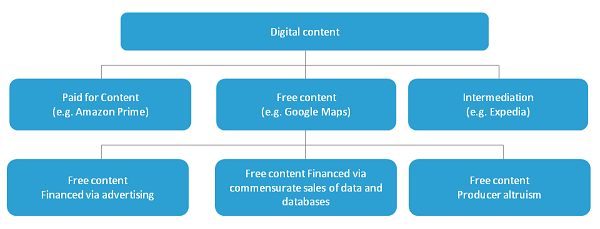
These digital products are paid for even though the latter two appear to be ‘free’. However, firms or individuals may also provide digital products either through altruism or as a form of intangible investment, in reputation or branding. Questions have been raised, both by this group and by Bean (2016) about the ability of current methods to measure adequately the economic value of these digital products. Here we divide digital content into paid for and free content, as well as a third category of ”intermediation” (Figure 7).
Figure 7: Sub-categories within the digital content category
Source: Office for National Statistics
Download this image Figure 7: Sub-categories within the digital content category
.png (31.1 kB)2.4.1 Paid for digital content:
These are internet and mobile services which are accessed via a subscription8 (such as Netflix) or where a basic version is available for free with enhanced versions available through subscriptions (for example, Spotify). These activities are already captured in the national accounts in several different ways. The expenditure measure of GDP, for instance, captures the expenditure of households on these services. Where these are produced by registered businesses, the output, purchases and value added of these firms are captured in the output measure of GDP. Where individuals are employed and paid by these businesses – or where the businesses declare profits – these are also captured within the income measure of GDP9. The issue which the group considered in this area is that users only pay for an initial access, but zero marginal cost for use. As such, the turnover does not vary in line with the volume of digital products consumed.
2.4.2 “Free” digital content:
These include products such as Google, Facebook and LinkedIn, whose providers obtain revenue mostly through advertising and/or sale of customer information. An OECD (2016) paper10 argues that free digital products which are paid for by advertising revenue are akin to subsidised supermarket products whose costs are added to other premium products. However, in this case, the free products are subsidised by the higher prices that are paid for products of the advertising firms11, which are already included in GDP. In this case there are parallels which are easily drawn with television services. Commercial television channels are delivered for free and are funded through advertising revenue. The OECD paper notes that the issue is not a matter of novelty but of scale.
To address the measurement of free digital content differently in national accounts, Nakamura and Soloveichik (2015) suggested expanding the core national accounts by arguing that consumers are in effect being paid to watch online advertisements by providing them with free content in exchange. So consumers’ income (and GDP) and their expenditure could be increased by an identical amount, to reflect the consumption of free digital contents. The free contents would be valued by the cost of creating the advertisements.
There is as yet no consensus on the measurement of output from the 2 other models of free digital production identified. The first of these is free digital content funded through commensurate sales, such as where the sale of databases generated from customer interactions (”big data”) is used to generate revenue. The second model is free content (for example, blog posts and Wikipedia) delivered by individuals either altruistically or as a form of intangible investment in their personal brand (altruistic production).The United Nation’s System of National Account Research Agenda is exploring certain situations where these transactions could affect GDP and ways to estimate the value of the free products consumed. Within our organisation, these discussions are being considered within the expanded national accounts framework, which includes the development of estimates of the unmeasured digital economy and household production.
Consequently, the group suggested a shadow prices approach towards estimating the unmeasured digital economy. A shadow price is a price which is applied to a good or service where a direct price cannot be determined. It could be sourced from the price of “a comparable” alternative, or its ”opportunity cost”.
For example, R is an open source statistical programme which we use as a substitute for other purchased statistical packages, such as STATA and SAS. One could therefore use the price of one of these products as a shadow price for R, as consumers would have alternatively been willing to pay this sum. However, this has to be consistent with the income and expenditure measures of GDP, in a fully balanced supply use framework.
2.4.3 Intermediation
The third aspect of digital content considered by the group was the growing role of digital intermediation. The Bean Review identified this phenomenon in relation to online service provision using the example of a travel agency. Comparing the booking of travel via traditional and electronic means, Bean (2016) argued that in the past, travel agencies occurred in physical high street shops (or over the telephone), whereas today, a growing proportion of this activity occurs in the home via digital technology. Bean argued that this activity had therefore transferred from the national accounts to the household account12.
“Today, contact with customers increasingly happens via the web. This has significant implications for consumer-facing business like banking, travel agency and insurance. Activities that were previously undertaken in the market economy have instead become part of ‘home production’ instead.”13
The group discussions raised 2 questions:
- Is the consumer’s role changing? For example, is exploration and investigation being done by the consumer instead of the intermediary?
- If the consumer’s role has changed, does this imply that output has transferred from GDP to the household account?
In the view of this group, however, every service transaction involves both a consumer and a provider. This is equally true for travel booked via a traditional, ‘travel agent’ model, and for transactions which take place via the internet and a travel company’s website. In all scenarios the consumer retains the role of the consumer and (not a producer) the intermediary in both scenarios is still the provider.
The main change brought about by digital provision is that the consumer accesses the service via a ‘different door’. A provider in the pre-internet world offered the service via a physical shop, while a modern provider can offer the service via a digital shop. As the cost of providing this service (setting up and maintaining the website, as well as ongoing support services) is captured in the national accounts (although it may be located overseas), the activity has not left the national accounts. It cannot therefore be in the household account.
If it is accepted that the activity itself may not have moved from the national accounts, the change in intermediation does have some impacts:
Firstly, as arranging holidays has got cheaper with the shift away from high street shops to online travel agents, there is an argument that this constitutes a consumer benefit which should be captured within the existing national accounts framework by applying an appropriate quality adjustment to the price deflator. This may also be achieved by separating high street and online transactions into separate products, each having a separate deflator.
The second impact of the shift to digital intermediation is that the variety of holidays on offer has increased. The national account does not currently capture the benefit consumers derive from this increase in variety, and accounting for increased variety is outside the current framework. It is arguable that this is an increase in consumer surplus that cannot be captured by GDP.
A third issue with digital intermediation is that the time saved by consumers from moving online is not counted as a benefit in the national accounts. This is correct within the existing framework as household activities are largely excluded. To incorporate this would require the development of household accounts making use of detailed time budgets - a major research effort and a different conceptual framework.
In broad terms, these impacts suggest that the quality of the service received – as distinct from the value of activity – may have changed over time in a manner which is not currently captured within the national accounting framework. The precise attributes on which this quality change can be measured will vary across products, but in this setting may include the range of choices available to consumers and the activities associated with online purchases such as price comparisons, reviews and price monitoring. If the quality of these services transactions is not captured effectively, then there are likely to be implications for the National accounts estimates of the volume of activity in this area. However, in this approach, the activity itself remains within the national accounts boundary.
This conclusion replicates the results of a recent OECD paper14, which argues that the conceptual boundary of GDP as outlined in the system of national accounts is not deficient in terms of measuring the digital economy. This states that in many areas where measurement problems exist within the current national accounts boundary, the issues are of scale rather than novelty. For intermediation services in particular, the paper suggests few conceptual or measurement difficulties for measuring intermediation revenues and value-added15 where the activity has shifted from traditional physical providers to web-based providers as long as both institutions are recorded in administrative statistical registers. However, they do highlight issues with cross-border activities.
Notes for the review:
Section J also includes industries 58 - Publishing activities, 59 - Motion picture, video and television programme production, sound recording and music publishing activities and 60 - Programming and broadcasting activities.
Prices of mobile phones in the CPI were previously hedonically adjusted between 2007 and 2014.
FEWS will produce results equivalent to a fully interacted time-dummy hedonic index based on all price determining characteristics of the products, despite not directly observing the product’s characteristics. FEWS has the potential to reduce the level of resources currently involved with the hedonic processes as it diminishes the need for collection of the product characteristics and the index appears computationally manageable with common statistical software. The procedure must be underpinned by a very large dataset, such as might be collected through web scraping, or from scanner data.
The CPI technical manual covers detailed discussions on quality adjustments.
The use of hedonic regression in the UK Consumer Price Index is discussed in Wells and Restieaux (2013).
The point here is that quality is held fixed so that we only measure price change.
Corrado, C. and Ukhaneva, O (2016).
In addition to subscription fees, firms providing this service can also generate revenue from advertising and/or sales of customer information (‘Big Data’).
There may be a complexity when these businesses are located overseas.
OECD, April 2016: Measuring GDP in a Digitised Economy.
While associated advertising revenue is an obvious proxy for free products paid for by advertising, measuring value becomes tricky for “big data” which is not sold to a third party.
The National Account captures all economic activity in the country, whereas the Household Account captures non-economic activity, that is all the time and effort expended in non-work activities (for example, leisure time, caring for children, cooking, cleaning, gardening) The Household Account does not count towards GDP. Bean therefore suggests we need to consider how to take account of this ‘home production’.
Paragraph 3.29, Chapter 3, Bean Review (2016).
OECD, April 2016: Measuring GDP in a Digitised Economy.
Note that the amounts involved here are the margin or service fees charged for intermediation (value added), not the value of the transacted service itself.
5. Findings and next steps
This working group has provided a platform through which industry experts, members of academia and statisticians have been working together towards understanding, reviewing and improving the measurement of economic statistics within a narrowly defined industry. There is potential for improvements delivered by this collaboration to be applied more widely.
The main issue relating to this review was whether the method for output measurement of technology products in the national accounts was excluding a significant portion of the value added being delivered by the producers of these products, as evidenced by the rate of technological change1. There was general consensus that the conceptual issues relating to the complexities of measuring output in the digital economy are not new, but the pace of change and the share of the economy which these affect is now much larger than in the past.
The main findings of the group are:
There is a disconnect between observable rates of technological change and the rate of growth of output and productivity, and by association the welfare gains usually associated with these.
The review identified quality adjustment of price deflators as the most likely mechanism for any measurement error in existing measures of output within the national accounts framework.
There is potentially scope to improve the measurement of output within the existing national accounts framework through a review of quality adjustments applied to ICT goods and particularly ICT services in the first instance.
Hedonic regression is the preferred method for quality adjusting ICT products. However, expanding the current scope of quality adjusted prices would require exploratory work into more efficient quality adjustment models with regard to data, time and resource requirements.
The development of wider measures of consumer welfare may need a new focus, as the traditional use of GDP as an adequate proxy for welfare may be weaker in the modern digital economy. This is because current output measures may not be able to wholly capture the scale of welfare gains arising from technological improvements. These welfare gains include higher quality of goods and services, increased choice, convenience, time saving and consumer surplus gained through transactions within the e-economy, including the proliferation of free digital products, which have an impact on national accounts, household production and consumer leisure activities.
The next step for the group is to work towards obtaining new datasets which would support the development of new and efficient quality adjustment models for ICT goods and services. The group welcomes comments and thoughts on any issues discussed in this paper.
Notes for finding the next steps:
- Details of the areas discussed by the group are outlined in Annex A.
6. References
Bean, C. (2016): Independent Review of UK Economic Statistics.
Corrado, C. and Ukhaneva, O. (2016): International Price Comparisons of Fixed Broadband Services: A Hedonic Analysis.
Gordon, R. J. (2016): The Rise and Fall of American Growth.
Griliches, Z. (1994): Productivity, R&D, and the Data Constraint.
Krsinich, F. (2014): The FEWS index: Fixed effects with a window splice; non-revisable quality adjusted price indexes with no characteristic information.
Nakamura, L. and Soloveichik, R. (2015): Valuing “free” media across countries in GDP.
Nordhaus, W.D. (1998): Do real-output and real-wage measures capture reality? The history of lighting suggests not.
OECD (2016): Measuring GDP in a digitalised economy.
ONS (2013): Quality and Methodology Information – Consumer Price Inflation.
ONS (2014): Consumer Price Indices Technical Manual.
ONS (2015): Quality and Methodology Information - Index of Services.
ONS (2016): Consumer Price Inflation 2016 Basket of Goods and Services.
Solow, R. M. (1988): Growth Theory and After.
Wells, J. and Restieaux, A. (2013): Review of Hedonic Quality Adjustment in UK Consumer Price Statistics and Internationally.
Nôl i'r tabl cynnwysManylion cyswllt ar gyfer y Erthygl
Related publications
- Labour productivity, UK: October to December 2019
- Productivity flash estimate and overview, UK: July to September 2025 and April to June 2025
- Management practices and productivity in British production and services industries - initial results from the Management and Expectations Survey: 2016
- Quality adjusted labour input: UK estimates to 2016
- International comparisons of UK productivity (ICP), first estimates: 2016
- Developing labour market metrics for the market sector, UK: 2016
- Public service productivity: quarterly, UK, October to December 2019
