Cynnwys
1. Main points
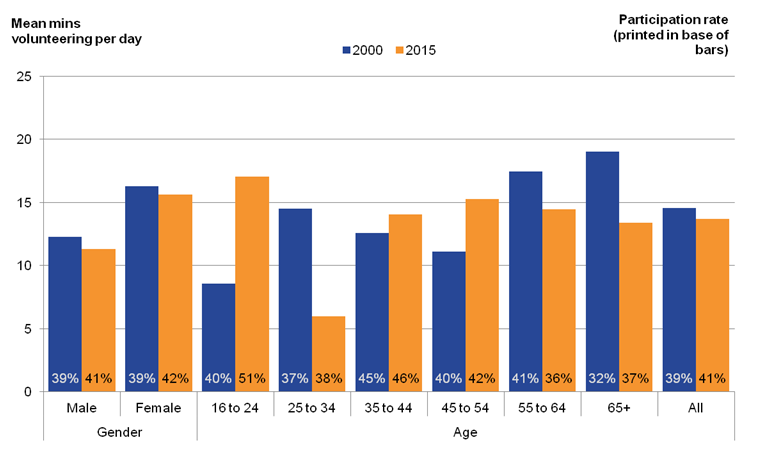
- The proportion of people volunteering over the last 12 months has increased in recent years, but at the same time, the average time spent volunteering per day has fallen. Between 2000 and 2015, participation rates increased from 39% to 41% for men and from 39% to 42% for women but the average time spent volunteering decreased from 12.3 to 11.3 minutes for men and 16.3 to 15.7 minutes for women.
- In 2015, volunteering participation rates for women and men were broadly similar over the year (42% and 41% respectively). However, women who volunteered spent on average 15.7 minutes per day volunteering compared to 11.3 minutes for men.
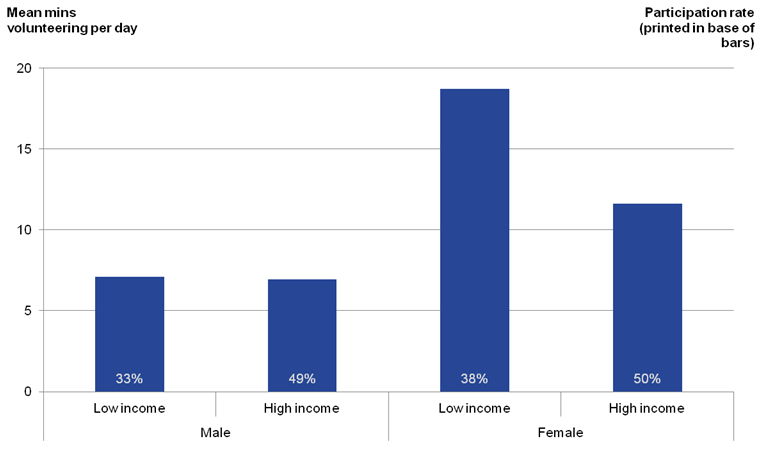
- In 2015, 50% of women from high income households volunteered over the year compared with 38% of women from low-income households. However, women from low income households spent 7.1 minutes more volunteering per day than those from high income households (18.7 minutes compared to 11.6 minutes respectively).
- In 2015, men in high income households were more likely to volunteer over the year than men in low income households (49% and 33% respectively), but spent a similar amount of time volunteering (7.1 minutes and 6.9 minutes respectively).
- In 2015, 51% of those aged 16 to 24 volunteered for an average of 17.0 minutes per day, over the year. This was the highest of all age groups both in terms of participation and average time spent volunteering.
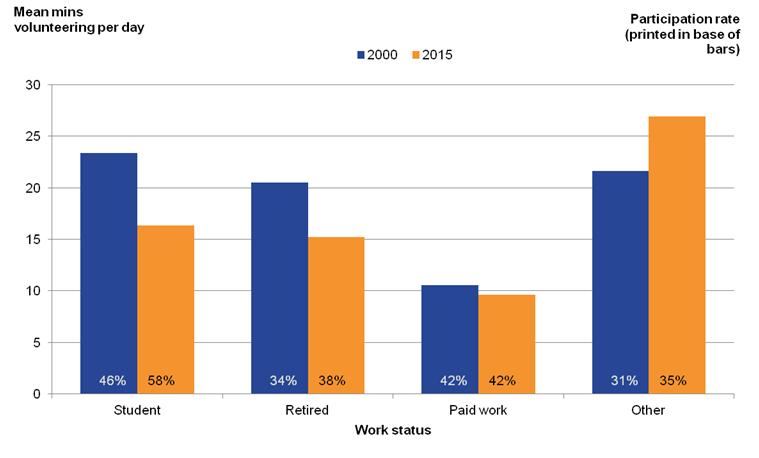
- Students are both more likely to volunteer and also spend longer per day volunteering than those in paid work. In 2015, 58% of students volunteered over the year for an average of 16.3 minutes per day, compared with 42% of those in paid work who volunteered for an average of 9.6 minutes per day.
- Non-retired volunteers from low income households were most likely to volunteer during weekday day-time hours. This contrasts with those from similar households who did not volunteer, who were more likely to be doing paid work, or looking after children during weekday day-time hours.
- Non-retired volunteers from high income households were more likely to be outside the home doing, for example, social, or cultural activities during weekday evening hours when not volunteering.
- Non-retired non-volunteers, regardless of household income, were more likely to engage in activities such as consuming media, and resting during the hours than others engaged in voluntary activity.
- Between 2014 and 2015, the value of formal volunteering fell from £22.8bn to £22.6bn. This was mainly due to a fall in the total number of hours volunteered between these years.
2. Introduction
This report analyses the 2015 Community Life Survey (CLS), the 2001 Home Office Citizenship Survey (CS) and the 2000 and 2015 time use surveys to get a better understanding of both the participation and time spent by volunteers. The CLS and CS give a good overall understanding of volunteering and the time use surveys give more detail, particularly about the time spent volunteering. The 2000 and 2015 time use surveys are the 2 most recent full UK time use surveys available. The release of the 2015 time use data offers – for the first time in 15 years – a unique opportunity to analyse changes in the amount of time people spend volunteering.
According to the latest household satellite accounts volunteering (defined as volunteering through a formal organisation) was worth about £23 billion in 2014 or 2% of the total value of unpaid work. Using time use data, allows the identification of those who are volunteering, and for how long they work, thereby enhancing the 2014 household satellite accounts estimates.
Feedback from stakeholders1 has reinforced our view that understanding the allocation of volunteering across households, families and communities is a high priority. Therefore, this report is structured for that purpose analysing voluntary activity for different profiles of volunteers.
Notes for: Introduction
- Recent feedback was established following consultation with the National Council for Voluntary Organisations (NCVO).
3. Things you need to know about this release
Volunteering in this report is defined as “formal volunteering” – voluntary activity in which people volunteer either for an organisation or through an organisation for free. The kind of activities included range from administrative work on behalf of clubs or teams to coaching, donating blood or helping out at refuges1.
Structure of the report
Sections 4 and 5 of this report analyse changes in the division and time spent volunteering in the UK. Section 4 focuses on time and participation invested in formal volunteering, Section 5 aims to illustrate how a typical day of a volunteer might differ from the typical day of a non-volunteer. Section 6 will provide estimates of the monetary value of formal volunteering.
Data sources
Sections 4 and 5 use a range of data sources to analyse who in the UK volunteers and how long they might do so for. The Community Life Survey (CLS, 2015) and the Home Office Citizenship Survey (CS, 2001) are used to measure volunteer participation rates of different groups in the UK population. The CLS is used for 2015 and the CS is used as a proxy for volunteering participation in 2000 (no data exist for 2000). The 2000 and 2015 UK time use surveys are used to analyse the time which different groups of volunteers within the UK spent volunteering. Volunteering participation rates taken from the CLS and CS are for England only (CLS) and England and Wales (CS) but in this report are used as proxy for the participation rates across the United Kingdom in its entirety. Section 6 uses the CLS and the Annual Survey of Hours and Earnings to create a value estimate for volunteering in the UK.
Measures of time
When the average time volunteering is estimated (in Figures 1, 2 and 5) the average time volunteering is calculated as a mean average for those who have indicated that they have carried out some volunteering in the last 4 weeks. Throughout the section, the time use of these self-reported volunteers is analysed to give an idea of the duration of volunteering across different groups.
Notes for: Things you need to know about this release
- A full list of the categories, their respective UK HETUS codes, descriptions and some examples are included in Table A2 in this report.
4. Time and participation in formal volunteering in the UK between 2000 and 2015
Age and sex of formal volunteer
Figure 1 provides the average time volunteering by sex and age group of volunteer for 2000 and 2015.
Figure 1: Average daily minutes of formal volunteering provided, by gender and age category
UK, 2000 and 2015
Source: UK Harmonised European Time Use survey (HETUS), 2000 and 2015; Home Office Citizenship Survey 2001; Community Life Survey (CLS), 2015/16
Notes:
- Mean average time volunteering is taken from the 2000 and 2015 HETUS surveys and is provided for those who indicated they had carried out some volunteering in the 4 weeks prior to being surveyed.
- Volunteering participation rates are taken from the CLS and reflect the proportion of any group who report regularly volunteering at least once every 12 months.
Download this image Figure 1: Average daily minutes of formal volunteering provided, by gender and age category
.png (44.5 kB) .xls (28.7 kB)For those aged 25 to 34, and over 55 there has been a decrease in the amount of time spent volunteering per day between 2000 and 2015. The data show that women generally carry out more volunteering on a volunteering day than men (11 minutes to 16 minutes of volunteering per day in 2015, respectively) and the average time dedicated to volunteering changes depending on your age. The data suggest that those in the youngest age group of 16 to 24 have increased the time they devote to volunteering while those in the next age category up have decreased their volunteering time.
In terms of participation, rates of volunteering have increased by more percentage points for women than for men and among the young and old more than those who were middle-aged. Those aged 16 to 24 saw the highest increase in volunteering participation with a percentage point increase of 11 percentage points between 2000 and 2015. Participation rate changes were then at lower positive growth levels for age groups 25 to 34, 35 to 44 and 45 to 54 (between 0 and 3 percentage points for each group) while those in the 55 to 64 age group saw their rate of participation fall by over 4 percentage points between 2000 and 2015.
Household income of formal volunteer
Figure 2: Average daily minutes of volunteering provided by gender and equivalised household income band
UK, 2015
Source: UK Harmonised European Time Use survey (HETUS), 2015; Community Life Survey (CLS), 2015/16
Notes:
- Mean average time volunteering is provided for groups who indicated they had carried out some volunteering in the 4 weeks prior to being surveyed.
Download this image Figure 2: Average daily minutes of volunteering provided by gender and equivalised household income band
.png (25.6 kB) .xls (19.5 kB)Figure 2 shows both the volunteering participation rate and the average time volunteering per day for groups based on their equivalised household income1 band and their sex. The data refer to 2015 only.
The data show that the higher average time volunteering performed by the women volunteer group (seen in Figure 1) was driven by women volunteers from low income households in 2015. In that year, those women volunteers performed the highest average time volunteering per day, at around 19 minutes per day.
Men from both high income and low income households performed lower amounts of volunteering than women, with the average duration of volunteering at around 7 minutes per day for men volunteers in 2015. Comparatively, women from high income households performed less volunteering than women from low income households but still volunteered for an average of 12 minutes per day.
Participation rates were higher for those from high income households regardless of sex. In 2015, among low income households 33% of men volunteered as compared with 49% of men from high income households. In the same year, 38% of women from low income households volunteered as compared with 50% of women from high income households.
Figure 3 explores volunteering participation based on household income further considering both household income and the age of the volunteer in combination. The aim of this is to evaluate if participation varies by age differently depending on household income.
Figure 3: Volunteering participation rates over the past 12 months by age and equivalised household income band, 2015
Source: Community Life Survey (CLS), 2015/16
Download this chart Figure 3: Volunteering participation rates over the past 12 months by age and equivalised household income band, 2015
Image .csv .xlsThe results (shown in Figure 3) suggest that the distribution of volunteering participation rates across age groups remains similar across income levels. Regardless of household income volunteering participation rates for the 25 to 34 age group are among the lowest (32% for low income households and 44% for high income households) while the participation rates of the 16 to 24 year olds were the highest (47% for low income households and 61% participation for high income households in 2015).
Work status and highest education of formal volunteer
Figure 4 analyses volunteering participation by full-time and part-time employment and highest education status. The results of Figure 4 show those who worked part-time had higher participation in volunteering than those who worked full-time. This could suggest that those with more available time are more likely to volunteer than those with less available time.
Figure 4: Volunteering participation rates over the past 12 months by employment status, type of employment and highest level of qualification, 2015
Source: Community Life Survey (CLS), 2015/16
Download this chart Figure 4: Volunteering participation rates over the past 12 months by employment status, type of employment and highest level of qualification, 2015
Image .csv .xlsFigure 4 also suggests that there may be a positive relationship between educational attainment and volunteering rates – over 50% of those with a degree or above volunteer. However, further analysis would be necessary to determine if education itself leads to higher volunteering participation or whether there are other “hidden” factors involved.
Figure 5: Average daily minutes of formal volunteering by work status of volunteer, 2000 and 2015
Source: UK Harmonised European Time Use survey (HETUS), 2000 and 2015; Home Office Citizenship Survey 2001; Community Life Survey 2015/16
Download this image Figure 5: Average daily minutes of formal volunteering by work status of volunteer, 2000 and 2015
.png (33.1 kB) .xls (18.9 kB)Figure 5 explores work status further and shows the average amount of time spent volunteering each day by a range of different groups. The results suggest that the average volunteering time for those of the “Other” work status was the highest. Volunteers in the “Other” group included the unemployed, long-term sick and disabled and other groups such as mothers on maternity leave. This was the only group to see their average time volunteering increase, rising from 22 minutes per day in 2000 to 27 minutes per day in 2015. Where those in paid work had the lowest average time volunteering per day, this supports the notion that those with more free time would perform more volunteering per day (as seen in Figure 4).
Those who were retired saw a fall in their average time volunteered, falling from 21 minutes per day in 2000 to 15 minutes per day in 2015. This is in line with the results shown in Figure 1, which showed a fall in average volunteering time for those aged over 55.
In terms of volunteering participation, rates have increased most for students, with student volunteering participation rising by 12 percentage points between 2000 and 2015. In 2000, there were 46% of students participating in volunteering while 58% of students participated in volunteering in 2015. Between 2000 and 2015, other groups have seen their participation rates rise less, particularly among those in paid work who saw their participation rate increase by just 0.1% over the same period. Participation in volunteering has increased for those in retirement by 3.6 percentage points and by 4 percentage points for those of “Other” work status.
Although the average time volunteered per day has decreased for those in the student or retired groups, the participation rate for both those groups has increased. This could mean that in 2015 there were more volunteers but on average they each contributed a lower volunteering time per day than similar volunteers in 2000.
Notes for: Time and participation in formal volunteering in the UK between 2000 and 2015
- This means that household income has been adjusted for the amount of people within the household who are dependent on the income.
5. Time use of non-retired formal volunteers and non-volunteers in 2015
The following section considers the sequential pattern of activity that made up a non-retired volunteer’s day during their week days1 in 2015. The analysis has also been broken down by equivalised household income group to better analyse why it has been suggested that those from high income households may carry out more volunteering than those from low income households.2 Figures 6, 7, 9 and 10 are presented as a contextual illustration of the typical day of non-retired volunteers and non-volunteers from either high or low income households.
Weekdays (Mon to Fri) of non-retired volunteers and non-volunteers
Figure 6: Participation rates in different activities by non-retired, high income formal volunteers, 2015
Source: UK Harmonised European Time Use survey (HETUS), 2015
Download this chart Figure 6: Participation rates in different activities by non-retired, high income formal volunteers, 2015
Image .csv .xlsFigure 6 shows that non-retired volunteers from high income households are likely to perform their formal volunteering during the afternoon or evenings on weekdays. It also shows that most are likely to be carrying out paid work or study during morning and afternoon hours peaking at 66% participation at 11:20 in the morning and again at 61% participation at 14:50 in the afternoon. The other noticeable feature of high income non-retired formal volunteer weekdays is a pocket of participatory activity between 18:00 and 22:00 in the evenings. This activity includes religious activities or meetings to organise events (for example, scout camps), meetings for political parties or parents’ evenings at schools.
Figure 7: Participation rates in different activities by non-retired, high income non-volunteers, 2015
Source: UK Harmonised European Time Use survey (HETUS), 2015
Download this chart Figure 7: Participation rates in different activities by non-retired, high income non-volunteers, 2015
Image .csv .xlsFigure 7 shows that non-volunteers share many of the same patterns of daily activity as those who are formal volunteers, with a high proportion at work between 08:00 and 16:30 and many carrying out the majority of their unpaid work activity in the early evening between 16:00 and 20:00. However, when considering the evening hours, it is also evident that non-volunteers are less active than formal volunteers, where formal volunteers show comparatively high levels of recreational activity between 18:00 and 21:00.
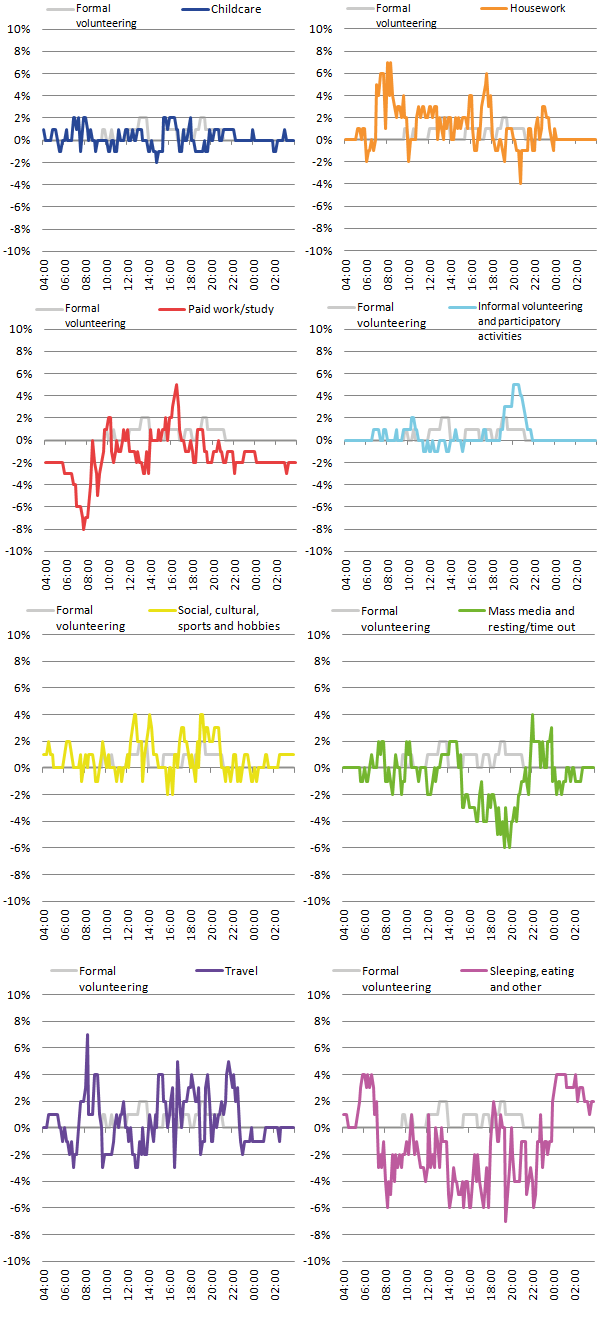
Figure 8: Difference in participation rates of non-retired, high income volunteers and non-volunteers, 2015
Source: UK Harmonised European Time Use survey (HETUS), 2015
Download this image Figure 8: Difference in participation rates of non-retired, high income volunteers and non-volunteers, 2015
.png (71.1 kB) .xls (29.7 kB)Figure 8 helps to draw out the differences between activities in Figures 6 and 7 for non-retired volunteers and non-volunteers from high income households. The activity participation rate of non-volunteers is subtracted from the activity participation rate of volunteers in such a way that any activity that appears in the top half of the chart is carried out more frequently by volunteers than non-volunteers. Similarly, if the activity appears in the lower half of the chart then it is performed more frequently by non-volunteers.
Figure 8 emphasises the active nature of volunteers from non-retired high income households, where the kind of activity that appears above the line is generally housework during the day, helping other households and participatory activities, social cultural, sports and hobbies or travelling in the evening. However, it is also clear that non-volunteers are more frequently engaged in paid work or study between the hours of midnight and 08:00, raising the possibility that shift work may be a more common attribute to the lives of non-volunteers as opposed to volunteers.
Figure 9: Participation rates in different activities by non-retired, low income volunteers, 2015
Source: UK Harmonised European Time Use survey (HETUS), 2015
Download this chart Figure 9: Participation rates in different activities by non-retired, low income volunteers, 2015
Image .csv .xlsFigure 9 shows that in 2015, non-retired low income volunteers tend to perform their volunteering throughout the day as opposed to in the evening on weekdays. This may be due to the lower proportion who are in paid work between 08:00 and 17:00 on weekdays.
A higher proportion of non-retired low income volunteers were also participating in unpaid housework tasks during the day than those from similar high income households.
Figure 10: Participation rates in different activities by non-retired, low income non volunteers, 2015
Source: UK Harmonised European Time Use survey (HETUS), 2015
Download this chart Figure 10: Participation rates in different activities by non-retired, low income non volunteers, 2015
Image .csv .xlsFigure 10 shows that in 2015, non-retired low income non-volunteers were more likely to participate in childcare activities than low income non-retired formal volunteers, particularly during the usual daytime working hours between 08:00 and 16:30.
It is also evident that a lower proportion of non-retired low income non-formal volunteers were engaged in paid work during the late afternoon hours. At 16:00 approximately 30% of non-retired low income volunteers were engaged in paid work where only 20% of non-retired low income non-volunteers were engaged in paid work at 16:00 on a weekday in 2015.
Figure 11: Difference in participation rates of non-retired, low income volunteers and non-volunteers, 2015
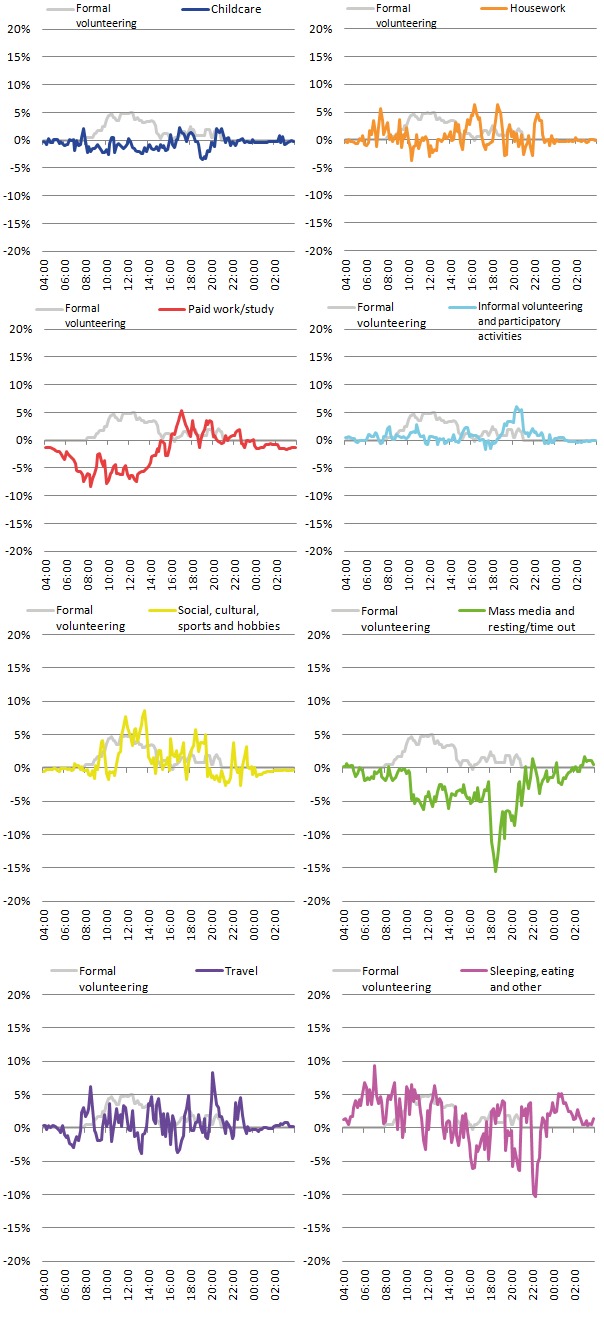
Source: UK Harmonised European Time Use survey (HETUS), 2015
Download this image Figure 11: Difference in participation rates of non-retired, low income volunteers and non-volunteers, 2015
.png (63.6 kB) .xls (29.7 kB)Figure 11 is similar to Figure 8 and is shown to help draw out the differences between activity shown in Figures 10 and 11 for non-retired volunteers and non-volunteers from low income households.
Figure 11 provides further clarity to the pattern of childcare being carried out more frequently by non-volunteers from low income households as compared with volunteers from low income households. This childcare clearly extends into the lower half of the chart and during the hours between 08:00 and 16:30, which is the time when volunteers from low income households are most frequently engaged in volunteering activity.
Non-retired volunteers from low income households are also fairly active as compared with non-retired non-volunteers from low income households, particularly during afternoon and evening hours. Unlike non-retired volunteers from high income households, non-retired volunteers from low income households are more likely to be sleeping, eating or performing other personal care from 04:00 through to 14:00.
Based on Figures 6 through to 11 and evidence provided earlier in the report, it is clear that non-retired volunteers from high income households are more likely to volunteer for shorter periods during evening hours, while those non-retired volunteers from low income households are more likely to volunteer for longer periods throughout the daytime on weekdays.
Notes for: Time use of non-retired formal volunteers and non-formal volunteers in 2015
- Weekends are omitted from this analysis but may be addressed in further follow up work.
- Based on Equivalised Household Income where income is adjusted using the OECD modified scale, first proposed by Hagenaars et al. (1994).
6. Valuation of unpaid formal volunteering
The following section reports the value of formal volunteering based on the total hours spent carrying out formal volunteering. This updates previous estimates last reported in the 2014 Household Satellite Accounts and, consistent with those estimates, is based on volunteering estimates from the Community Life Survey and wage rates from the Annual Survey of Hours and Earnings.
This section of the release looks at estimates of frequent volunteers who are those that volunteer at least once a month. This is in line with the methodology within the UK Household Satellite Accounts.
Figure 12: Total UK hours and value of frequent volunteers by year, 2012 to 2015
Source: Community Life Survey, 2012, 2013, 2014, and 2015
Notes:
- The value of volunteering in 2014 is slightly lower from that published in the 2016 UK Household Satellite Account due to methodological improvements relating to population estimation.
Download this chart Figure 12: Total UK hours and value of frequent volunteers by year, 2012 to 2015
Image .csv .xlsFigure 12 shows that the total number of frequent hours volunteered in the UK declined by 7%, from 2.1 billion hours to 1.9 billion hours between 2012 and 2015. This continues a trend of declining volunteer hours which is recorded in the UK household satellite account, where frequent hours of volunteering were recorded at 2.3bn hours in 2005 (ONS, 2016).
The value of frequent volunteering reduced by a smaller amount - of 4%, falling from £23.6 billion to £22.6 billion. In contrast to the number of hours - which decreased every year - the value of frequent volunteering increased between 2012 and 2013, before reducing in 2014 and 2015. For more information on the value of volunteering refer to the UK Household Satellite Accounts. These accounts are published on an annual basis with the last publication released in April 2016 and a follow up publication is currently planned for 2017.
Nôl i'r tabl cynnwys7. Acknowledgements
Oliver Mann, Office for National Statistics
Nick Ockenden, Head of Research, NCVO
Dominic Webber, Office for National Statistics
Richard Tonkin, Office for National Statistics
8. References
Commissions of the European Communities-Eurostat, International Monetary Fund, Organization for Economic Co-operation and Development, United Nations, World Bank. (2008). System of National Accounts. Brussels/Luxembourg, New York, Paris, Washington, D.C.
Gershuny, J., Sullivan, O. (2017). United Kingdom Time Use Survey, 2014-2015. Centre for Time Use Research, University of Oxford. [data collection]. UK Data Service. SN: 8128
Hagenaars, A., de Vos, K., and Zaidi, M.A. (1994). Poverty Statistics in the Late 1980s: Research Based on Micro-data, Office for Official Publications of the European Communities. Luxembourg.
ONS (2016) Household satellite accounts: 2005 to 2014. Office for National Statistics, Newport.
Nôl i'r tabl cynnwys