1. Abstract
This article presents annual multi–factor productivity (MFP) estimates for the UK market sector and component industries to 2015. MFP measures the change in real (inflation adjusted) economic output that cannot be accounted for by changes in measured inputs of labour and capital.
These estimates show that in 2015 MFP contributed one-third of the overall growth in market sector output, albeit still lower than the average annual contribution prior to the economic downturn. These estimates also suggest that lower capital services per hour worked and weaker than normal improvements in labour quality held back productivity growth in 2015.
Nôl i'r tabl cynnwys2. Introduction
About this release
This is the latest in a series of multi–factor productivity (MFP) releases, containing estimates of MFP growth for 1970 to 2015 consistent with Blue Book 2016. The previous edition was published in May 2016 (Blunden and Franklin, 2016a).
MFP estimates use experimental measures of quality adjusted labour inputs (QALI) and capital services within a growth accounting framework to decompose output growth into the relative contributions of the growth of labour and capital inputs and a residual component referred to as multi-factor productivity1. This approach complements traditional measures of labour productivity, which focus only on one input – labour – and do not take account of changes in the composition of labour over time. Capital input to production is measured by capital services which similarly take account of changes in the composition of the productive stock of capital over time.
Estimates are presented for the aggregate market sector and for 10 industry groups. The measurement of labour and capital attempts to adjust for compositional changes as well as pure volume movements. This is most apparent in the case of labour inputs, where the MFP framework distinguishes between changes in hours worked and a “labour composition” component. For more information on measurement of labour inputs, see Blunden and Franklin (2016b).
Within an MFP growth accounting framework, movements in capital inputs are captured through capital services. Conceptually this is analogous to the treatment of labour input insofar as weights are given to different forms of capital to reflect their estimated contribution to the production process, although unlike labour, where hours worked can be directly observed, there is no equivalent of a standard unit of capital service, and hence no distinction between the quantity and quality of capital. The weights used in this capital services framework differ from those used in measuring the value of the stock of capital in the Office for National Statistics (ONS) National Accounts. Intuitively this is because the monetary value of an asset can differ from its contribution to the production process. For more information on the derivation of the capital services estimates used in this release, see Evans, Franklin and Martin (2017).
Layout of article
The following section describes what's new in this edition. The main innovation is that industry-level labour inputs are now compiled on a bottom-up, market sector basis for all industries, whereas in the previous edition market sector labour input was defined by residual. This reflects development work described in Franklin (2016)2. For the first time this release provides estimates for all industries going back to 1970, allowing comparisons over previous economic cycles. This has required some estimation and linking of sources, as the core ONS National Accounts systems go back only to 1997, and the pre-1997 industry-level estimates are accordingly of lower quality than the post 1997 estimates.
Next is a short section on interpreting MFP statistics. A key point to note is that industry-level output is here measured net of intermediate consumption. At the present time we are not able to provide the conceptually preferable breakdown of gross output (including intermediate consumption as one of the inputs to production).
The following results section includes time series decompositions of value-added growth and labour productivity growth for the market sector.
MFP decompositions for individual industries are (a) volatile from year to year and (b) conceptually inferior to decompositions based on real gross output. For these reasons, the article focuses mainly on multi-year average annual decompositions, to highlight differences across industries.
The article concludes with a section on revisions to MFP since the previous estimates published in Blunden and Franklin (2016a), and on next steps, setting out priorities for future development and inviting feedback from users.
Further information on data sources and methodology is provided in Appendix 1.
Notes for: Introduction
This is also described elsewhere in the literature as disembodied technical change, the “Solow residual”, or total factor productivity (TFP).
QALI estimates used in this release incorporate some minor methodological improvements since October 2016, chiefly to ensure full additivity between market-sector and non-market estimates of hours worked and labour remuneration for all component industries.
3. What's changed in this release?
The main change from previous editions is that industry level estimates of labour inputs are compiled on a bottom-up basis for the market sector constituent parts of each industry. This is a change from the previous multi–factor productivity (MFP) release in May 2016. In that release, labour input was calibrated to the market sector by treating one aggregated industry as the residual, with labour input in all of the remaining industries identical to the whole economy series. This in turn reflects development work reported in Franklin (2016), which provides industry level estimates for market sector hours worked and for labour remuneration. One consequence of this change is that this release presents estimates for 10 component industries rather than 9 as in the previous release.
There are differences between whole economy and market sector estimates (that is, there are non-zero non-market sector components) in 6 out of the 10 industries reported in this release, although in several of these the differences are fairly small. The Results section below will explore the differences between the two measures in more detail.
As in the previous MFP release, this release uses previously unpublished component level market sector gross value added (GVA) estimates and factor-income weights for those industries with non-market elements. These estimates are available from our National Accounts systems back to 1997. Estimates prior to this date have been compiled from various sources including ONS (capital services, index of production and some high-level aggregate), EU-KLEMS and the Bank of England. Although we have sought to achieve internal consistency wherever possible, readers should be aware that the pre-1997 estimates are of lower quality that the estimates from 1997 onwards.
Estimates of hours worked and labour composition in this release have been revised slightly from those published in the most recent quality adjusted labour inputs (QALI) release (Blunden and Franklin, 2016b). These revisions chiefly reflect revised estimates of hours worked originating from annual benchmarking (described further in the January 2017 Labour Productivity release). In addition, we have made some small changes to the experimental methodology described in Franklin (2016), where quality assurance has identified cases where market sector estimates of hours and/or labour remuneration are higher than the whole economy estimates. The impact of these modifications is negligible.
Lastly this article includes for the first time some estimates of capital productivity, defined as output per unit of volume of capital service. We welcome feedback from users on whether these estimates are useful.
Nôl i'r tabl cynnwys4. Interpreting these statistics
Using a growth accounting framework, developed by Solow (1957), growth in output can be decomposed into contributions from growth in labour inputs (in terms of both its quantity and composition) and from growth in capital services. The residual output growth that cannot be accounted for by growth in labour and capital inputs is hence an estimate of multi–factor productivity (MFP). Alternatively, the growth accounting framework can be expressed as a decomposition of labour productivity growth, by dividing all of the elements by the volume of labour input (actual hours worked in this case) into the contributions of weighted labour composition (the difference between the growth of quality adjusted and unadjusted labour inputs), capital deepening (defined as the weighted growth in capital inputs per hour worked) and MFP.
Conceptually the MFP residual can be thought of as capturing technological progress, including the effect of changes in management techniques and business processes or more efficient use of factor inputs. It is important to note that improvements in the quality of capital are examples of “embodied technical change”. In principle, such quality changes are captured in the measurement of capital services and are not included in MFP. MFP is linked, therefore, not to an increase in the quantity or quality of measured factor inputs but rather to how they are employed.
In practice the MFP residual may also capture a number of other effects such as adjustment costs, changes in other factors of production not captured in labour and capital measures (for example, infrastructure), economies of scale and measurement error in inputs and outputs. For example, an improvement in the quality of the labour force not captured by the quality adjusted labour inputs or returns on expenditures that are not currently treated as capital formation within the national accounts framework, such as workplace based training, design and branding, will be incorporated into the MFP residual.
The formal growth accounting methodology was set out in Appendix 2 of the 2012 MFP article (Appleton and Franklin, 2012) and is not repeated here. More information on data sources is set out in Appendix 1 of this release.
Note that due to the volatility of year on year MFP growth, some of the results are presented as averages over the periods. Estimates by industry and year are available back to 1970 in the accompanying dataset.
Nôl i'r tabl cynnwys5. Results
Total market sector
This section presents growth accounting results over the period 1997 to 2015 for the market sector as a whole. Further details are available in the accompanying dataset.
Figure 1 decomposes annual market sector output growth from 1998 to 2015 into contributions from capital and labour input growth (the latter separated into contributions from hours and labour composition) and the residual MFP contribution. MFP made a positive contribution to output growth in 2015 (1.0 percentage points, out of 3.0 percentage points of output growth). This was slightly lower than the MFP contribution in 2014, and a little lower than the average annual contribution prior to the economic downturn (1.5 percentage points). The main driver of output growth in 2015 was an increase in hours worked (1.4 percentage points). Capital input contributed 0.7 percentage points to output growth in 2015. This was the strongest contribution since 2008 and reflects an upward trend in the volume of business investment. Labour composition made a tiny negative contribution to output growth in 2015, the weakest performance of this component since 2004.
Figure 1: Decomposition of annual output growth, 1998 to 2015
UK, Market sector
Source: Office for National Statistics
Download this chart Figure 1: Decomposition of annual output growth, 1998 to 2015
Image .csv .xlsThe growth accounting framework can be re-arranged to provide a breakdown of movements in labour productivity measured by output per hour, as shown in Figure 2. In this presentation the capital contribution reflects changes in capital services per hour worked (known as capital deepening). Differences between capital input (Figure 1) and capital deepening (Figure 2) are particularly apparent in the period since 2009, where the positive contributions of aggregate capital input in Figure 1 turn into negative contributions in terms of capital deepening. This is because the growth of aggregate capital services has been slower than the growth of hours worked, resulting in less capital per hour. Labour composition and MFP are identical in Figures 1 and 2.
Market sector output per hour rose by an estimated 0.8% in 2015, well below the pre-downturn 10-year average of around 2.5% per year. Negative capital deepening (negative 0.1 percentage points) compares with average positive contributions of 0.8 percentage points per year prior to the economic downturn.
Figure 2: Decomposition of annual labour productivity growth, 1998 to 2015
UK, Market sector
Source: Office for National Statistics
Download this chart Figure 2: Decomposition of annual labour productivity growth, 1998 to 2015
Image .csv .xlsHistorical perspective
Figure 3 looks at the long-run trend in the decomposition of labour productivity for the market sector, carrying the series in Figure 2 back to 1971. There is clear evidence of economic downturns coinciding with periods of negative multi–factor productivity (MFP), in the mid-1970s, the early 1980s and early 1990s as well as 2008 to 2009. The 2008 to 2009 downturn notably had the largest decrease in MFP in comparison with other downturns. Equally there is evidence of rebounds of above-trend MFP following previous downturns, for example in the mid-1970s, early 1980s and mid-1990s. Thus far there has been no such rebound in MFP following the 2008 to 2009 downturn. In fact, MFP turned sharply negative in 2012. The prolonged weakness of MFP following the economic downturn is one of the defining characteristics of the UK productivity puzzle.
The evidence of a trend decline in capital deepening is striking. Between 1970 and 1997, capital deepening contributed, on average, 1.3 percentage points a year to labour productivity growth. Since 1997, this has fallen to 0.5 percentage points per year on average, and since 2009 the average contribution of capital deepening has been minus 0.3 percentage points per year.
Until recently, movements in labour composition have been in the opposite direction and have acted to partly offset the declining contribution of capital deepening on growth of labour productivity. At the total market sector level, the average contribution of labour composition has increased from around 0.2 percentage points per year prior to 1997 to around 0.4 percentage points per year between 1997 and 2012. However, improvements in labour composition have tailed off sharply in the period 2013 to 2015.
Figure 3: Decomposition of annual labour productivity growth, 1971 to 2015
UK, Market sector
Source: Office for National Statistics
Download this chart Figure 3: Decomposition of annual labour productivity growth, 1971 to 2015
Image .csv .xlsOn average, despite the poor performance since 2008, MFP growth has been higher since 1997 (0.5 percentage points per year) than prior to 1997 (0.2 percentage points per year). This reflects extraordinarily consistent MFP growth in the decade prior to the economic downturn. On the other hand, MFP growth since 2007 has averaged negative 0.8 percentage points per year, which is the worst performance over any 8-year period since 1973 to 1981. This, together with the downward trend in capital deepening, largely accounts for the decline in labour productivity growth since 2007. This however, does not provide any rationale for why MFP has declined in this period.
Results by industry
This section decomposes labour productivity growth (gross value added (GVA) per hour worked) by industry. Categories on the X-axis for figures 4, 5 and 6 refer to the industry groupings set out in Table 1. Total MS is the total market sector.
Table 1: Industry descriptions
| Industry descriptions | |
| Industry1 | Industry Description |
| ABDE* | Agriculture; forestry and fishing; Mining and quarrying; Utilities |
| C | Manufacturing |
| F | Construction |
| GI | Wholesale and retail trade; Accommodation and food services |
| H* | Transportation and storage |
| J* | Information and communication |
| K | Financial and insurance activities |
| LMN* | Real estate activities; Professional and scientific activities; Administrative and support activities |
| PQ* | Education; Health and social work |
| RSTU* | Arts and entertainment; Other services |
| Total MS | Total Market Sector |
| Source: Office for National Statistics | |
| Notes: | |
| 1. Standard Industrial Classification (2007) | |
| 2. * Denotes industry affected by removal of non-market sector components | |
Download this table Table 1: Industry descriptions
.xls (27.1 kB)The main industries in Table 1 that are affected by the exclusion of non-market activities are LMN, PQ and RSTU. For LMN, the adjustments remove imputed rent and non-market R&D. For PQ, we remove non-market education and health services as well as the whole of O (public administration and defence), which has no market element in terms of GVA. For RSTU we remove non-market arts activities and charities. There are smaller adjustments in industries H (Network Rail), J (broadcasting) and ABDE (waste collection). Industries C, F, GI and K do not contain any non-market elements in terms of GVA.
Figure 4 presents the decomposition of labour productivity growth by industry, expressed as annual averages over the period 1998 to 2015. It can be seen from the chart that average MFP contributions over the last 18 years have varied substantially. Industry J (information and communication) has seen by far the largest positive contribution of MFP (2.8 percentage points per year). There has also been moderate MFP growth over this period in C (manufacturing) and LMN (real estate, professional and administrative activities).
But MFP growth has been heavily negative on average in PQ (market sector education and health), ABDE (agriculture, mining and quarrying, utilities) and RSTU (arts and other services). MFP made small positive contributions to labour productivity growth in 3 industries: GI (wholesale and retail trade, accommodation and food services), H (transport services) and K (financial services), and a small negative contribution in F (construction).
The significant negative contributions of the groupings PQ, ABDE and RSTU should not be perceived as alarming; they only represent 5%, 7% and 4% of total market sector GVA respectively, with the largest industries in GVA terms being GI, LMN, and C at 19%, 18% and 16% respectively over this period.
Figure 4: Decomposition of annual average labour productivity growth, 1998 to 2015
UK, Market sector, By industry
Source: Office for National Statistics
Notes:
- See Table 1 for full industry descriptions.
Download this chart Figure 4: Decomposition of annual average labour productivity growth, 1998 to 2015
Image .csv .xlsContributions from capital deepening have also varied across industries although by less than MFP. Capital deepening is estimated to have made the largest positive contribution in industries K, F and ABDE, and weakly positive or negative contributions in LMN, PQ and RSTU. Labour composition made positive contributions across all industries, with the largest impacts in industries K, RSTU and C, although this effect is weakening in the most recent periods.
Focusing on the period since the economic downturn (Figure 5), labour composition is again estimated to have made positive contributions to productivity across the board. Capital deepening has been negative in 5 of the 10 industries over this period (noticeably so for J and RSTU) and lower than over the longer period shown in Figure 4 for all industries other than ABDE. However, these elements are dwarfed by MFP contributions which have been large and negative in 3 out of 10 industries (ABDE, K and PQ), positive in 6 industries (particularly F, J and LMN), zero for RSTU and fractionally positive for the market sector as a whole.
Over this period, movements in MFP constitute the largest component of the change in labour productivity for all industries apart from RSTU. Put another way, had changes in MFP been more uniform across industries, then the distribution of labour productivity performance would have been less pronounced than actually observed. It is apparent too that movements in MFP across different industries are not related to movements in other components. For example, negative movements in MFP were associated with positive capital deepening in ABDE and K, but negative capital deepening in PQ. Similarly, positive MFP was associated with positive capital deepening in F but negative capital deepening in J and LMN.
Figure 5: Decomposition of annual average labour productivity growth, 2010 to 2015
UK, Market sector, By industry
Source: Office for National Statistics
Notes:
- See Table 1 for full industry descriptions.
Download this chart Figure 5: Decomposition of annual average labour productivity growth, 2010 to 2015
Image .csv .xlsThe varying contributions of MFP across industries may reflect differences in the diffusion of disembodied technological change, or may provide an indication of measurement error. Measurement error can vary by industry as, for example, it is generally more difficult to differentiate between volume and price movements in service industries than in production industries. Moreover, as noted above, decomposition of productivity movements below the whole economy level should ideally take account of contributions of (real) intermediate inputs.
A decomposition of labour productivity in 2015 (Figure 6) shows how much MFP, labour composition and capital deepening can differ across industries in a single year. Yearly estimates of MFP are quite volatile and figure 6 should mainly be used as a tool to highlight further the divergences in productivity across industries. As with the period averages shown above, differences in MFP account for much of the difference in labour productivity across industries.
Figure 6: Decomposition of annual labour productivity growth, 2015
UK, Market sector, By industry
Source: Office for National Statistics
Notes:
- See Table 1 for full industry descriptions.
Download this chart Figure 6: Decomposition of annual labour productivity growth, 2015
Image .csv .xls6. Revisions
Revisions to multi–factor productivity (MFP) estimates since our last release (Blunden and Franklin, 2016a) arise from revisions to the component series and can be categorised into 4 broad groups:
revisions to output growth rates arising from changes to the UK National Accounts introduced in Blue Book 2016 and, for some industries, adjustments to remove the non-market components
revisions to capital services source data; as detailed in Evans, Franklin and Martin (2017), these are dominated by revisions to the detailed source data on capital formation by asset and industry, including revisions arising from a review of historic sources; we also made some minor methodological changes, although the impact of these was minimal
revisions to labour inputs (hours worked and labour composition) arising partly from revisions to source data, and partly from development of a full bottom-up QALI model of the market sector, as described in Franklin (2016) and Blunden and Franklin (2016b); as noted above, there have been further revisions to source data since the last quality adjusted labour inputs (QALI) publication and we have made some very minor methodological changes
minor revisions to factor income shares reflecting adoption of Blue Book 2016 industry level income constraints
To give an indication of the drivers of revisions to output growth, Figure 7 plots the average contributions at the total market sector level for the most recent and previous estimates. The data cover the period 1998 to 2014, over which comparable data are available.
Average output growth has been revised down very slightly over this period. There have also been downward revisions to growth of capital inputs, hours worked and labour composition. Together the revisions to these components are greater than the revision to output growth, so the residual MFP component has been revised upwards. More information on revisions is available in the dataset published alongside this article.
Figure 7: Contributions to annual average output growth, 1998 to 2014
UK, Market sector, Current and previous estimates
Source: Office for National Statistics
Download this chart Figure 7: Contributions to annual average output growth, 1998 to 2014
Image .csv .xls7. Capital productivity
Using the multi–factor productivity (MFP) compilation framework it is straightforward to compute time series estimates of capital productivity for the market sector and component industries, as output divided by volume of capital services. Such estimates are not strictly analogous to conventional measures of labour productivity such as output per hour, because capital services take account of compositional changes (that is, the analogous concept in terms of labour would use a quality adjusted labour inputs (QALI) index as the denominator). Capital productivity is similar in concept to the inverse capital stock to output ratio, selected estimates of which are published in our Capital stocks, consumption of fixed capital release.
Long time series for capital productivity for the market sector as a whole and for manufacturing are shown in Figure 8. Estimates for all industries covered in this release are available in the accompanying dataset. As is immediately apparent from Figure 8, capital productivity has not trended upwards over time. In fact, the economic downturns in 1974 to 1975, 1980 to 1981, 1991 and 2008 to 2009 seem to be associated with step declines in capital productivity, and apart from the 1980 to 1981 downturn (and possibly 2008 to 2009), there is little evidence of subsequent recoveries in capital productivity. This may suggest that some capital is rendered permanently obsolete or otherwise unproductive when the economy undergoes a major downturn.
Figure 8: Capital productivity, 1970 to 2015
UK, Market sector and manufacturing

Source: Office for National Statistics
Download this image Figure 8: Capital productivity, 1970 to 2015
.png (24.4 kB) .xls (21.5 kB)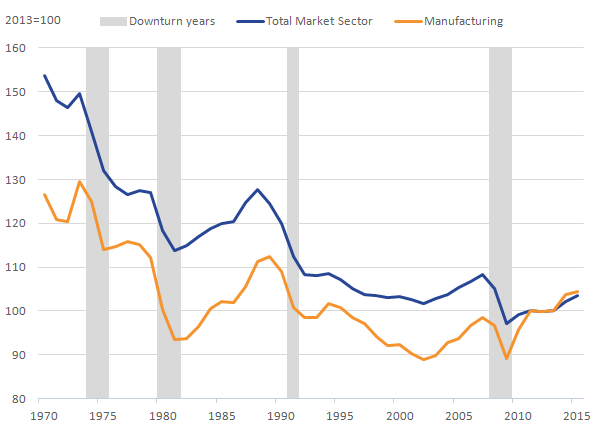
Figure 9 shows annual average capital productivity growth since 1997 by industry. The variation across industries is apparent, and is strongly correlated with the variation in MFP contributions shown in Figure 4 above. Industries J and LMN with positive capital productivity growth also exhibited positive MFP contributions over this period, while industries ABDE and PQ show large negative capital productivity and large negative MFP. Since MFP reflects movements in output that cannot be accounted for by movements in factor inputs, it follows that, other things equal, an increase or decrease in MFP will also be reflected in increased or decreased capital and labour productivity. Figure 9 also shows that for the market sector as a whole, capital productivity has been virtually unchanged since 1997.
Figure 9: Annual average capital productivity growth, 1998 to 2015
UK, Market sector, By industry
Source: Office for National Statistics
Notes:
- See Table 1 for full industry descriptions.
Download this chart Figure 9: Annual average capital productivity growth, 1998 to 2015
Image .csv .xls8. Next steps
We are publishing an updated Economic Statistics and Analysis Strategy (ESAS) paper in April 2017. This will outline our high-level strategic priorities pertaining to multi–factor productivity (MFP) within (i) a broader productivity agenda and (ii) the overall strategy for economic statistics and analysis over the period to 2021. The ESAS paper will confirm our intention to move towards a quarterly publication schedule for MFP, with the first quarterly estimates scheduled for publication in early 2018.
The capital services framework is currently annual rather than quarterly. Following discussion with Nick Oulton (one of the ONS Economic Fellows and a member of the Economic Experts Working Group) we have decided to re-code this as a quarterly system (rather than deriving quarterly estimates as a secondary process from an underlying annual framework). Given the commonalities between capital services and capital stocks, we are working with the capital stocks development team on a common platform for the shared processes.
As well as moving to a quarterly frequency we would like to increase the industry granularity of MFP, beyond the 10 industries covered in this release. The constraint here is quality adjusted labour inputs (QALI), and we are currently exploring avenues to expand the industry granularity of the QALI system by for example utilising information from our Annual Survey of Hours and Earnings (ASHE) survey. We are keen to hear from users on their preferred industry breakdown, particularly where additional detail below letter-level is required. For example, should we prioritise a breakdown of manufacturing to 2-digit level over more articulation of service industries? You can communicate feedback to us via productivity@ons.gov.uk.
Nôl i'r tabl cynnwys10. References
Appleton J and Franklin M (2012) ‘Multi-factor Productivity, Indicative Estimates to 2010’, Office for National Statistics.
Blunden A and Franklin M (2016a) 'Multi-factor productivity estimates: Experimental estimates to 2014', Office for National Statistics.
Blunden A and Franklin M (2016b) 'Quality adjusted labour input: UK estimates to 2015', Office for National Statistics.
Evans A, Franklin M and Martin J (2017) ‘Volume index of UK capital services (experimental): estimates to 2015’, Office for National Statistics.
Franklin M (2016) ‘Developing labour market metrics for the market sector, UK: 2016’, Office for National Statistics.
Gill P and Kliesmentyte D (2015) ‘Comparing public service productivity estimates with other productivity estimates’, Office for National Statistics.
Phelps M (2010) 'Comparing different estimates of productivity produced by the Office for National Statistics', Economic and Labour Market Review, vol. 4, no. 5, May 2010.
Solow R (1957) ‘Technical Change and the Aggregate Production Function’, Review of Economics and Statistics, vol. 39, no. 3, pp. 312-320.
Nôl i'r tabl cynnwys11. Appendix 1 - MFP Sources and Methods
The growth accounting approach taken in this article is relatively undemanding in terms of data requirements. It uses gross value added (GVA) as an output measure and quality adjusted labour input (QALI) and capital services as its factor inputs. In addition, the income share of each factor of production, labour and capital, is required to determine its contribution to output growth.
Quality adjusted labour input (QALI)
The use of QALI allows labour contribution to be attributed to both an increase in the volume of labour, in terms of actual hours worked, and an increase in the quality of labour, in terms of skill composition of the workforce. QALI is mainly derived from quarterly Labour Force Survey (LFS) data, which captures information on the educational, age and gender composition of the workforce.
QALI makes the assumption that workers are paid their marginal product, the hours worked by each of these compositional categories are weighted by their share in total labour outcome. That is, labour input is broken down by industry, age, education and gender and each component is weighted by its income share. The QALI estimates used in this release have been benchmarked to labour income weights consistent with Blue Book 2016 (and specifically the Supply-Use tables of the Blue Book release).
Capital services
Capital services are akin to QALI in capturing compositional changes in capital inputs more fully than alternative measures of capital input, such as changes in net capital stocks. Capital services differ from National Accounts capital stock measures as they weigh together the growth in the net stock of assets using rental prices rather than purchase prices. Rental prices better reflect the cost of owning an asset over a specific time period, which can differ greatly from the costs of ownership over the whole asset life. Further, using rental prices is conceptually more appropriate for use in growth accounting analysis since, under the assumption that factors receive their marginal products, rental prices better reflect the marginal productivity of a given capital asset.
For further information about capital services and the most recent methodological developments, see Evans, Franklin and Martin (2017).
Output and income shares
Output measures used in MFP analysis are chained volume indices of GVA at basic prices, consistent with the Quarterly National Accounts (QNA) published on 31 March 2017. We do not publish industry level market sector GVA estimates. These have been compiled by the ONS Productivity team in conjunction with the GDP(O) team.
Labour and capital income shares are derived in a consistent fashion from the income presentation of the National Accounts and include a decomposition of the income of the self-employed, which is recorded in the national accounts as mixed income. Mixed income includes returns to both capital and labour. Capital income includes gross operating surplus (GOS), estimates of which for the market sector are available from the ONS Supply-Use framework. We exclude that part of GOS attributable to ownership of dwellings, which are not deemed to be part of the productive capital stock. We also exclude non-market capital consumption, which records returns to non-market capital stocks.
An alternative approach to growth accounting is to use a gross output measure and calculate the contributions to growth not only from capital and labour inputs but from intermediate inputs as well. An example of this approach is the EU-KLEMS project which additionally apportions output growth to the intermediate inputs of energy, materials and services. Whilst this approach is conceptually preferable, its data requirements are much more onerous. In particular, constant price supply use tables, which we do not currently publish, represent a barrier to adoption of this approach.
Historical estimates
Capital services estimates are available on a consistent basis over the entire period back to 1970. Estimates of QALI prior to 1994 are constructed using data from the EU-KLEMS project, which contains industry component series for hours worked and labour composition.
Aggregate market sector GVA (series L48H) is available only back to 1997. We have back-cast this series back to 1991 using an earlier vintage of data, and we have back-cast back to 1970 using growth in an aggregate market sector series taken from EU-KLEMS. Industry level GVA series are available for the production industries from ONS systems. Other industry series have been taken from the Bank of England “Three centuries of economic data” dataset and from EU-KLEMS. Industry level factor income shares are not available prior to 1997 and have been assumed constant at 1997 values. These approximations should be taken into account when interpreting estimates for the early years in this release.
Nôl i'r tabl cynnwysManylion cyswllt ar gyfer y Erthygl
Related publications
- UK productivity introduction: Oct to Dec 2016
- Labour productivity, UK: October to December 2016
- Quarterly public service productivity (Experimental Statistics): Oct to Dec 2016
- Exploring labour productivity in rural and urban areas in Great Britain: 2014
- International comparisons of UK productivity (ICP), final estimates: 2015
- Labour productivity measures from the Annual Business Survey: 2006 to 2015
- Introducing quarterly regional labour input metrics
- An initial assessment of regional management practices: 2015