1. Main points
This article provides the means to explore how employee jobs in different industries are located spatially across Great Britain; for example, employee jobs in scientific research and development were geographically concentrated in the East of England and South East.
The article also allows you to examine the industrial specialisations in individual areas; for example, in Surrey, East and West Sussex, air transport was the industry with the highest relative specialism followed by insurance, reinsurance and pension funding.
2. Introduction
There is currently a great deal of interest in understanding more about both the structure of local economies and the distribution of employment within specific industries. Devolution policy to city regions, the development of an industrial strategy and the Brexit vote have all led to greater focus on the relative performance of different parts of the country and a focus on particular industries. This article seeks to provide some useful information on the distribution of employment across the country, particularly focusing on individual industries and in identifying those areas of the country specialising in them.
Using the interactive map and datasets associated with the release, it is possible for you to investigate the data for different industries and different areas of the country and this article has been designed with this purpose in mind. The article highlights just a small number of industry and location examples to provide some insight into the data available.
Nôl i'r tabl cynnwys3. Things you need to know about this release
This article uses the number of employees by industry to examine the spatial distribution of industries and industrial specialisation in the 39 Nomenclature of Territorial Units for Statistics (NUTS) 2 areas in Great Britain. In England, NUTS 2 areas correspond to counties or groups of counties, in Wales NUTS 2 areas are equivalent to groups of unitary authorities and in Scotland they are broadly combinations of council areas and local enterprise companies (LECs). NUTS 1 areas correspond to English regions and the countries of Scotland and Wales.
The main analysis technique used is the calculation of location quotients. Location quotients are used to assess both the industrial specialisation of local areas and the geographical concentration of industries.
In the context of geographical concentration, a location quotient of 1.0 indicates that the local share of total employee jobs in an industry is equal to the local share of total employee jobs relative to Great Britain. A location quotient greater than 1.0 indicates a relative concentration of the industry in the geographic area while a location quotient of less than 1.0 indicates there is not a relative concentration of that industry in the area. For example, if an area has 5% of all employee jobs in Great Britain overall and also has 5% of employee jobs in Great Britain in industry X, then that area will have a location quotient of 1.0 for that industry. If the area has more than 5% of all employee jobs in Great Britain in industry X, then its location quotient for that industry will be greater than 1.0, indicating a concentration of that industry in the area relative to Great Britain. More information and examples of geographical concentration can be found in section 4 of this article.
When used in the context of industrial specialisation, a location quotient of 1.0 indicates that the local share of employee jobs in an industry is equal to Great Britain’s share of employee jobs in that industry. A value above 1.0 indicates an area has a relative specialism in the industry. For example, if 5% of employee jobs in Great Britain occur in industry X, then any area which also has 5% of its employee jobs in that same industry will have a location quotient for industry X of 1.0. If the area has more than 5% of its employee jobs in industry X, then its location quotient for that industry will be greater than 1.0. Therefore, the higher the location quotient the more an area has a specialisation in that industry relative to Great Britain overall. In this article a location quotient value of 2 or more has been used to identify particular relative specialisms in an industry. Industrial specialisation results can be found in section 5 of this article.
In addition to location quotients, the analysis in this article also uses the Krugman index, a relative specialisation measure which compares the industrial structures of 2 geographical areas. It runs from zero, if an area has the same employee jobs split across industries as the reference area, to 2 if they have employee jobs in entirely different industries to each other. Results from the Krugman index can also be found in section 5 of this article.
The Standard Industrial Classification (SIC), used in this article, is a hierarchical 5-digit system, which provides a framework for the collection, tabulation, presentation and analysis of data. UK SIC (2007) is divided into 21 sections, each denoted by a single letter from A to U. The letters of the sections can be uniquely defined by the next breakdown, the divisions (denoted by 2 digits). The divisions are then broken down into groups (3 digits), then into classes (4 digits) and, in several cases, again into subclasses (5 digits). In this article, data are provided for the industry sections, divisions and groups only. There are 21 sections, 88 divisions and 272 groups.
For further information on the calculation methods for location quotients and the Krugman index, see the Quality and methodology section.
Nôl i'r tabl cynnwys4. The spatial distribution of industries
In some industries, employee jobs are concentrated in a small number of areas and therefore these industries have a high level of geographical concentration. The areas that have concentrations of employees in an industry may be spread across the country or they may be located together in neighbouring areas. Conversely, in some industries, employee jobs are spread relatively evenly across the country and therefore have very little geographical concentration. Spatial patterns for all sectors, together with the different divisions (SIC 2 industries) that make up the sector, can be examined in detail via our interactive map.
Embed code
The following analysis focuses on these patterns of spatial distribution for examples of a few selected industries. The location quotient concentration tool, available in the datasets accompanying this article, can also show which regions, NUTS 2 or local authority areas have concentrations of employee jobs within the industry being examined.
Professional, scientific and technical activities
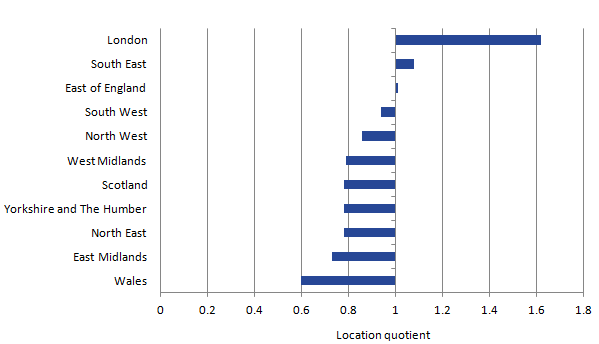
Within Great Britain, a spatial concentration of employees is seen particularly in some of the knowledge-intensive service industries such as information and communication, and professional, scientific and technical activities. Figure 1 shows the location quotients for the professional, scientific and technical activities sector (Section M of the 2007 UK SIC) for each region as well as Scotland and Wales.
Figure 1: Location quotients for M: Professional, scientific and technical activities
by NUTS 1 region, 2015
Source: Office for National Statistics
Download this image Figure 1: Location quotients for M: Professional, scientific and technical activities
.png (9.4 kB) .xls (52.7 kB)The professional, scientific and technical activities sector is concentrated in London. In 2015, London had over one and a half times the share of employee jobs in professional, scientific and technical activities (location quotient 1.6) compared with London’s share of total employee jobs. Employee jobs in professional, scientific and technical activities were also relatively concentrated in the South East and East of England. Both also had location quotients greater than 1.0 indicating that their local shares of employee jobs in this industry were greater than their share of total employee jobs. The area with the lowest relative share of employee jobs in the professional, scientific and technical activities sector was Wales, which had just over half the share of employee jobs in professional, scientific and technical activities (location quotient 0.6) compared with the share of total employee jobs in Wales.
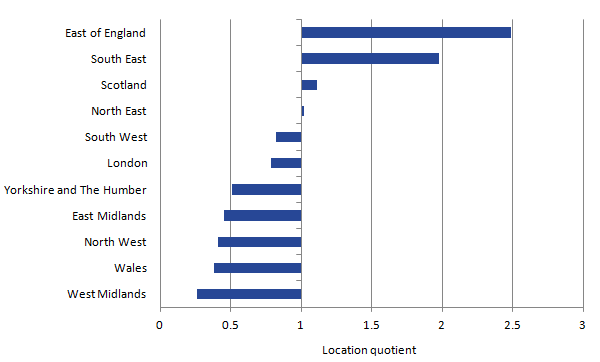
The professional, scientific and technical activities sector is made up of 9 SIC 2 industries including legal and accounting activities, management consultancy, architectural and engineering activities and scientific research and development. Location quotients by NUTS 1 region for scientific and development are shown in Figure 2.
Figure 2: Location quotients for 72: Scientific research and development
by NUTS 1 region, 2015
Source: Office for National Statistics
Download this image Figure 2: Location quotients for 72: Scientific research and development
.png (9.1 kB) .xls (45.1 kB)At a regional level, employee jobs in scientific research and development were concentrated in the East of England and the South East. The North East and Scotland also had location quotients greater than 1 indicating their shares of employee jobs in scientific research and development were higher relative to their share of total employee jobs in Great Britain. There were low relative shares of employee jobs in scientific research and development in the Midlands, Wales and the North West. London also had a low relative share of employee jobs in scientific research and development although had the highest location quotient for the professional, scientific and technical activities sector overall. This was because London had high concentrations of employee jobs in other SIC 2 industries within the sector, in particular the activities of head offices and advertising and market research.
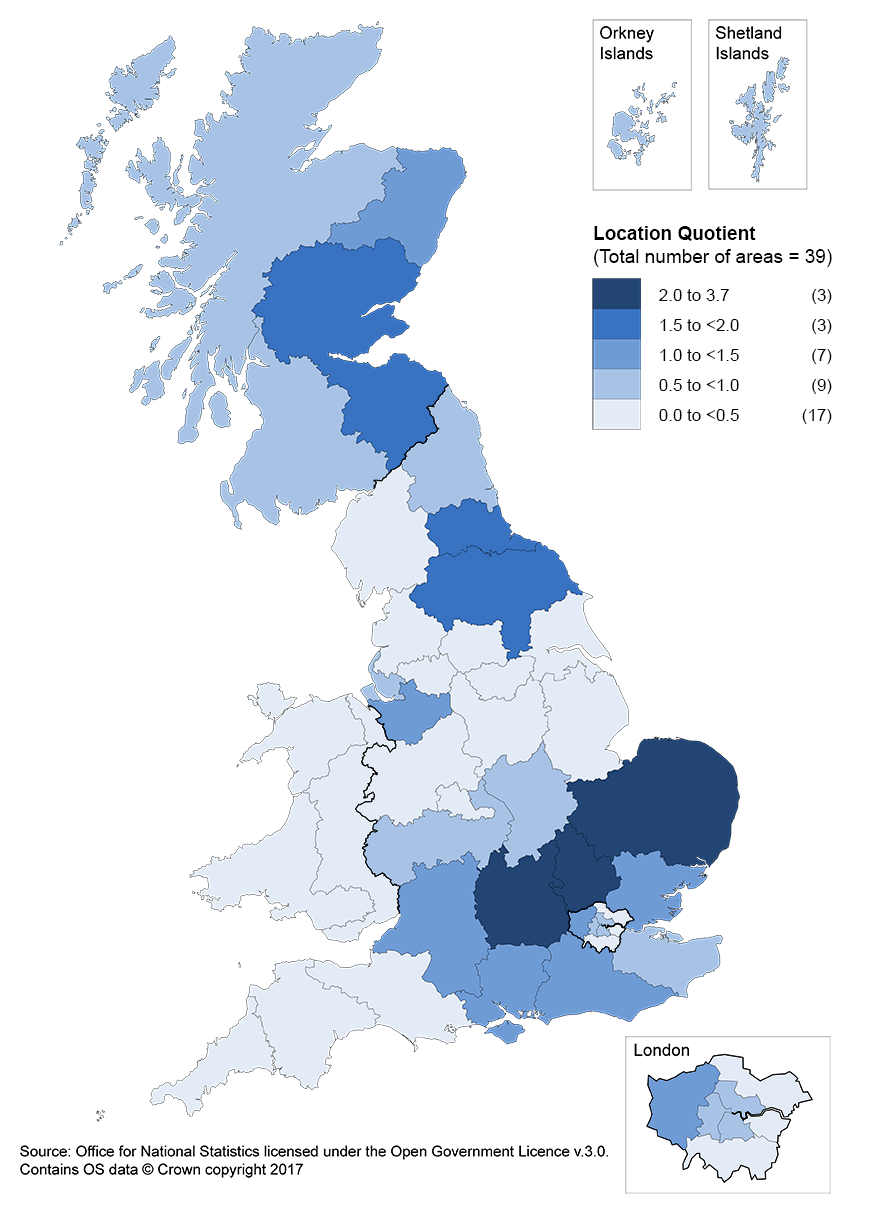
At the NUTS 2 level, employee jobs in scientific research and development were highly concentrated in Berkshire, Buckinghamshire and Oxfordshire in the South East and East Anglia in the East of England. In both areas the share of employee jobs in scientific research and development was 3 and a half times greater than their share of all employee jobs in Great Britain.
Figure 3: NUTS 2 areas with the highest location quotients for 72: Scientific research and development
Great Britain, 2015
Source: Office for National Statistics
Download this chart Figure 3: NUTS 2 areas with the highest location quotients for 72: Scientific research and development
Image .csv .xlsFigure 4 shows that employee jobs in scientific research and development were clustered around the South East and East of England. Clusters of employee jobs in scientific research and development can also be seen around Eastern Scotland and North Eastern Scotland as well as Tees Valley and Durham, and North Yorkshire.
Figure 4: Map of location quotients for 72: Scientific research and development
NUTS 2, 2015
Source: Office for National Statistics licensed under the Open Government Licence v.3.0. Contains OS data © Crown copyright 2017
Download this image Figure 4: Map of location quotients for 72: Scientific research and development
.png (318.8 kB)Financial and insurance activities
The financial and insurance activities sector (Section K) also displays strong geographical concentration in Great Britain. The majority of NUTS 2 areas had a relatively small share of employee jobs in financial and insurance activities, compared with their share of national employee jobs. However, the 2 Inner London NUTS 2 areas, Inner London East and Inner London West both had high concentrations of employee jobs in the sector.
The financial and insurance activities sector is composed of 3 SIC 2 industries: financial service activities, insurance activities and activities auxiliary to financial and insurance services. Financial service activities and activities auxiliary to financial and insurance services, were highly concentrated in London. Insurance activities were highly concentrated in the South East and Wales.
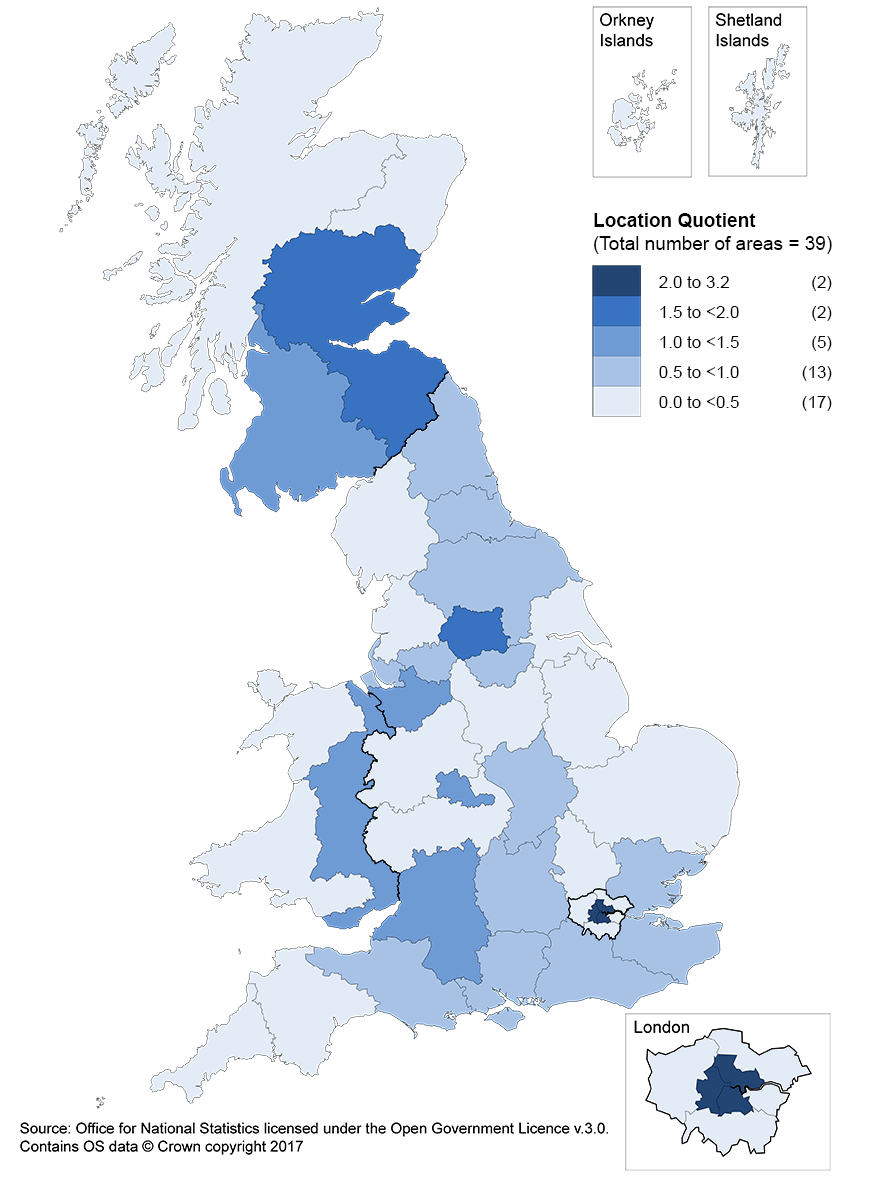
Figure 5 shows the NUTS 2 areas that had the highest location quotients for the financial service activities SIC 2 industry. Aside from a high concentration in central London, the financial service activities industry was also concentrated in a few other NUTS 2 areas. After the two Inner London NUTS 2 areas, Eastern Scotland had the next highest location quotient at 1.7, followed by West Yorkshire (1.6).
Figure 5: NUTS 2 areas with the highest location quotients for 64 Financial service activities, except insurance and pension funding
Great Britain, 2015
Source: Office for National Statistics
Download this chart Figure 5: NUTS 2 areas with the highest location quotients for 64 Financial service activities, except insurance and pension funding
Image .csv .xlsAside from the areas in London and Scotland, Figure 6 shows that the other areas where employee jobs in financial service activities are concentrated are spread across the country, for example, West Yorkshire and the West Midlands.
Figure 6: Map of location quotients for 64: Financial service activities, except insurance and pension funding
NUTS 2, 2015
Source: Office for National Statistics licensed under the Open Government Licence v.3.0. Contains OS data © Crown copyright 2017
Download this image Figure 6: Map of location quotients for 64: Financial service activities, except insurance and pension funding
.png (316.0 kB)Manufacturing
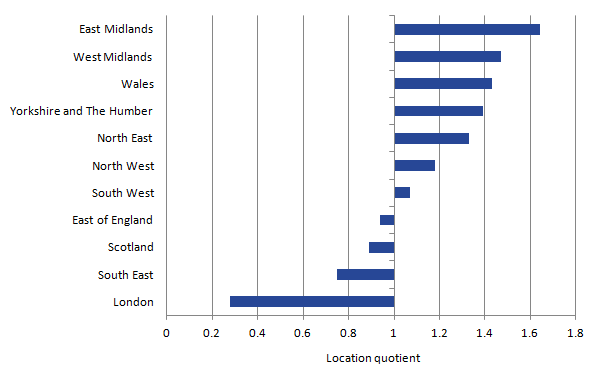
The manufacturing sector (Section C) has a more mixed spatial distribution. Figure 7 shows the location quotients for each NUTS 1 region for the manufacturing sector. It shows that manufacturing employee jobs were concentrated in the East Midlands and the West Midlands. Manufacturing employee jobs were also highly represented in Wales and in the northern regions of England but virtually absent from London.
Figure 7: Location quotients for C: Manufacturing
by NUTS 1 region, 2015
Source: Office for National Statistics
Download this image Figure 7: Location quotients for C: Manufacturing
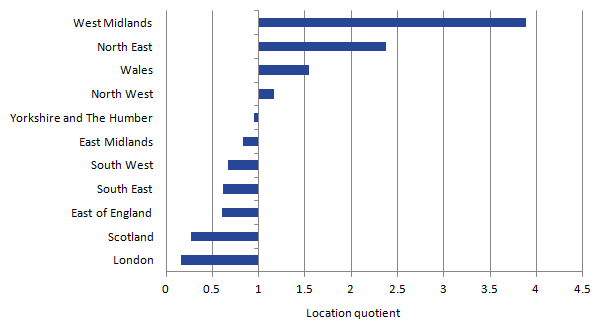
.png (10.4 kB) .xls (44.5 kB)One SIC 2 industry within the manufacturing sector is the manufacture of motor vehicles. Employee jobs in the manufacture of motor vehicles were highly concentrated in the West Midlands region, which accounted for a third of all employment in this sector nationally. In particular (shown in Figure 9), the NUTS 2 area of Herefordshire, Worcestershire and Warwickshire had a high concentration of employee jobs in the manufacture of motor vehicles, with 4.6 times its share of employment in this industry than its share of total employee jobs in Great Britain.
Figure 8: Location quotients for 29: Manufacture of motor vehicles, trailers and semi-trailers
by NUTS 1 region, 2015
Source: Office for National Statistics
Download this image Figure 8: Location quotients for 29: Manufacture of motor vehicles, trailers and semi-trailers
.png (9.3 kB) .xls (133.1 kB)Outside the West Midlands, employee jobs in the manufacture of motor vehicles were also concentrated in the North East. Within the North East, Northumberland and Tyne and Wear had the greatest concentration of employees in the manufacture of motor vehicles, with its share of employees in this industry 3.4 times its share of total employee jobs in Great Britain.
Figure 9: NUTS 2 areas with the highest location quotient for 29: Manufacture of motor vehicles, trailers and semi-trailers
Great Britain, 20151
Source: Office for National Statistics
Notes:
- As a result of disclosure control, data is unavailable for Inner London East, Outer London East and North East, Eastern Scotland and Highlands and Islands.
Download this chart Figure 9: NUTS 2 areas with the highest location quotient for 29: Manufacture of motor vehicles, trailers and semi-trailers
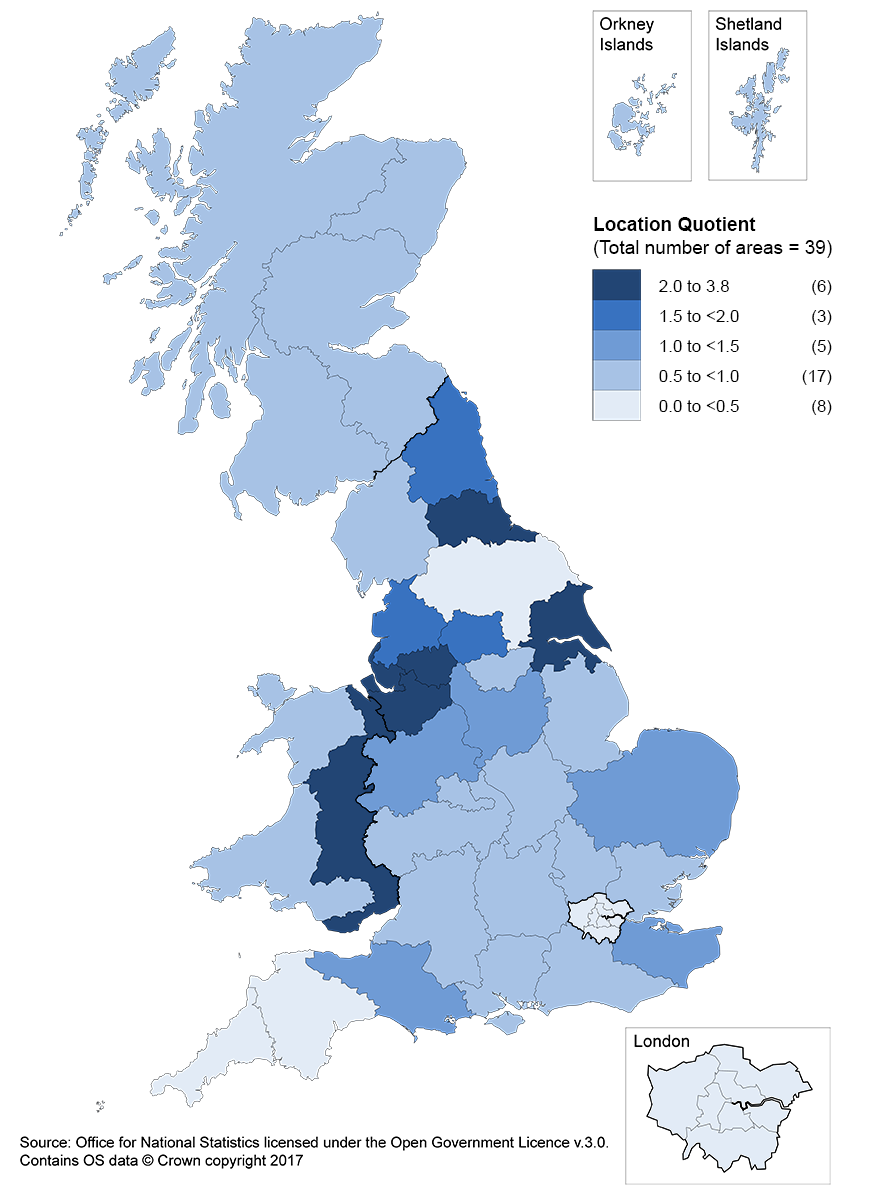
Image .csv .xlsThe manufacture of chemicals is another industry within the manufacturing sector and displays a different spatial distribution to the manufacture of motor vehicles. Employee jobs in the manufacture of chemicals were concentrated in the north of England and not the Midlands.
Figure 10: NUTS 2 areas with the highest Location Quotients for 20: Manufacture of chemicals and chemical products
Great Britain, 2015
Source: Office for National Statistics
Download this chart Figure 10: NUTS 2 areas with the highest Location Quotients for 20: Manufacture of chemicals and chemical products
Image .csv .xlsEmployee jobs in the manufacture of chemicals were highly concentrated in Tees Valley and Durham in the North East. Four of the 5 NUTS 2 areas in the North West also appeared among the NUTS 2 areas with the highest location quotients, shown in Figure 10. These concentrations in the north of England can be seen in Figure 11. In the south of England the NUTS 2 areas with relative concentrations in the manufacture of chemicals (Kent, East Anglia, and Dorset and Somerset) were dispersed.
Figure 11: Map of location quotients for 20: Manufacture of chemicals and chemical products
NUTS 2, 2015
Source: Office for National Statistics licensed under the Open Government Licence v.3.0. Contains OS data © Crown copyright 2017
Download this image Figure 11: Map of location quotients for 20: Manufacture of chemicals and chemical products
.png (317.5 kB)5. Industrial specialisation
Industrial specialisation looks at the industrial structure of a particular area. Location quotient specialisation tools for NUTS 1 regions, NUTS 2 areas and local authorities are available in the datasets accompanying this article and allow you to investigate the industrial specialisations of areas of your choice. The examples in this section demonstrate output from the tool for 3 selected geographical areas at 3 different levels of industrial breakdown.
Industrial specialisation by NUTS 2 area
For the 39 NUTS 2 areas, data are available for up to 84 SIC 2 industries. Figure 12 displays the 10 SIC 2 industries with the highest location quotients in Surrey, East and West Sussex. There were 3 SIC 2 industries for which the location quotient was 2 or above, indicating particular relative specialisms in Surrey, East and West Sussex in these industries. Air transport was the industry with the highest relative specialism followed by insurance, reinsurance and pension funding. For both industries the share of employee jobs in Surrey, East and West Sussex was around 3 times the national share of employment in these industries.
It should be noted that this section examines the relative specialism of an area. This means that for an area, the share of employee jobs in an industry is not examined by itself (absolute specialism) but it is compared with the share of employee jobs in that industry in Great Britain. These location quotients therefore give a picture relative to Great Britain.
Figure 12: Highest Location Quotients for SIC 2 industries in Surrey, East and West Sussex
NUTS 2, 2015
Source: Office for National Statistics
Download this chart Figure 12: Highest Location Quotients for SIC 2 industries in Surrey, East and West Sussex
Image .csv .xlsIndustrial specialisation by NUTS 1 region
For the 11 NUTS 1 regions, data are available for up to 259 SIC 3 industries. Figure 13 displays the 8 highest location quotients for SIC 3 industries in the West Midlands. The West Midlands is shown to be most specialised in the manufacture of other porcelain and ceramic products, with its share of employee jobs in this industry over 7 times the share of employee jobs in the industry in Great Britain. All of the SIC 3 industries displayed in Figure 13 with the highest location quotients in the West Midlands were within the manufacturing sector.
Figure 13: Highest Location Quotients for SIC 3 industries in the West Midlands
NUTS 1, 2015
Source: Office for National Statistics
Download this chart Figure 13: Highest Location Quotients for SIC 3 industries in the West Midlands
Image .csv .xlsIndustrial specialisation by local authority
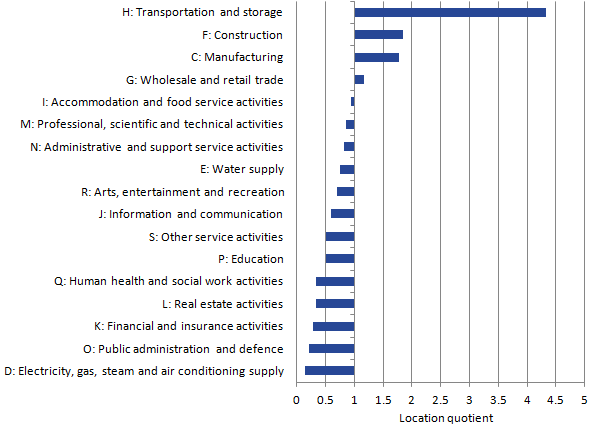
For local authorities, data are available for up to 19 industrial sectors. Figure 14 displays the location quotients by industrial sector for the local authority of North Warwickshire. North Warwickshire had a high relative specialism in transportation and storage, with a location quotient of 4.3. North Warwickshire’s relative share of jobs in construction, manufacturing, and wholesale and retail trade was also greater than the share of jobs in Great Britain in these sectors.
Figure 14: Location Quotients for sectors in North Warwickshire
Local Authority, 20151
Source: Office for National Statistics
Notes:
- As a result of disclosure control, data is unavailable for North Warwickshire Local Authority for section A: Agriculture, forestry and fishing and Section B: mining and quarrying.
Download this image Figure 14: Location Quotients for sectors in North Warwickshire
.png (17.8 kB) .xls (82.4 kB)Comparing industrial structures between areas
This section uses the Krugman index to examine how similar or dissimilar an area’s industrial structure is relative to the industrial structure of Great Britain overall. Broadly, areas with particular specialisms are likely to be seen as more dissimilar to either Great Britain overall or to most other areas. A lower Krugman index score (up to a value of 2) indicates a more similar industrial structure and a higher Krugman index score indicates a more dissimilar industrial structure. A tool is provided that allows the comparison of industrial structure between areas as well as against Great Britain.
Firstly, comparing the industrial structures of regions in turn showed the South East and the East of England had the most similar industrial structures, with the lowest Krugman index score of 0.24. London came out as the most dissimilar region to all other regions and was also the most dissimilar to Great Britain overall.
Figure 15 shows the Krugman index scores for each of the NUTS 1 regions against the West Midlands. Yorkshire and The Humber had the most similar industrial structure to the West Midlands followed by the East Midlands and the North West. London was the region that had the most dissimilar industrial structure to the West Midlands. The full Krugman index matrix for all regions can be viewed in the Krugman index tool, available in the datasets accompanying this article.
Figure 15: Krugman Index score for the West Midlands region against the remaining NUTS 1 regions
2015
Source: Office for National Statistics
Download this chart Figure 15: Krugman Index score for the West Midlands region against the remaining NUTS 1 regions
Image .csv .xlsLooking at the industrial structures of NUTS 2 areas, Table 1 gives the NUTS 2 areas with the most and least similar industrial structures to Great Britain. Inner London West had the least similar industrial structure to Great Britain, followed by North Eastern Scotland. The most similar NUTS 2 area to Great Britain in terms of its industrial structure was Gloucestershire, Wiltshire and Bath/Bristol area.
Table 1: NUTS 2 areas with the most similar and most dissimilar industrial structures to Great Britain
| Most similar | Krugman Index | Most dissimilar | Krugman Index |
| Gloucestershire, Wiltshire & Bath/Bristol area | 0.14 | Inner London - West | 0.65 |
| Greater Manchester | 0.14 | North Eastern Scotland | 0.47 |
| East Anglia | 0.18 | Inner London - East | 0.47 |
| Hampshire and Isle of Wight | 0.19 | Highlands and Islands | 0.46 |
| Kent | 0.19 | Cumbria | 0.41 |
| Source: Office for National Statistics | |||
Download this table Table 1: NUTS 2 areas with the most similar and most dissimilar industrial structures to Great Britain
.xls (26.6 kB)Through the tool it is also possible to compare the industrial structures of NUTS 2 areas with other NUTS 2 areas. An example of the areas with the most similar and most dissimilar industrial structures compared with Hampshire and the Isle of Wight can be seen in Table 2.
Table 2: NUTS 2 areas with the most similar and most dissimilar industrial structures to Hampshire and the Isle of Wight
| Most similar | Krugman Index | Most dissimilar | Krugman Index |
| Surrey, East and West Sussex | 0.18 | Inner London - West | 0.67 |
| Kent | 0.19 | Inner London - East | 0.50 |
| Gloucestershire, Wiltshire and Bath/Bristol area | 0.20 | North Eastern Scotland | 0.50 |
| East Anglia | 0.22 | Highlands and Islands | 0.49 |
| Essex | 0.22 | Cumbria | 0.42 |
| Source: Office for National Statistics | |||
Download this table Table 2: NUTS 2 areas with the most similar and most dissimilar industrial structures to Hampshire and the Isle of Wight
.xls (26.6 kB)6. Quality and methodology
This article uses the number of employees by industry to examine the spatial distribution of industries and the relative industrial specialisation in NUTS 1 regions, NUTS 2 areas and local authorities. The number of employees by industry comes from the Business Register and Employment Survey (BRES) 2015. BRES is our primary source for jobs estimates at a detailed geographical and industrial level. It contains information on the number of employees by industry down to 5-digit industrial classification as defined in the UK Standard Industrial Classification (SIC 2007) and by geographic area down to local authority.
The term “employee job” is used throughout this article to emphasise that all the data in this article is focused on the workplace of an employee. However, it should be noted that strictly speaking the BRES data used in this article is not a count of the number of jobs filled by employees in an area, but rather a count of the number of employees who work in an area. Self-employed jobs, working proprietors and HM Forces and government-supported trainees are not included in the data. Estimates are subject to sampling error, which increase as geographic areas become smaller and industry classification becomes more detailed.
For some industries it has not been possible to calculate location quotients for all NUTS 2 areas because some industry data is disclosive. This can happen where employee jobs are concentrated in only a small number of firms and the number of employee jobs in such cases is likely to be low. However, where an industry in an area is dominated by one or a small number of very large plants or firms, then there may be a specialisation in that area, which it was not possible to show in the results due to this issue of data disclosure.
Location quotients
Location quotients can be considered as measures of either concentration or specialisation. The results produced are equivalent whichever method is used.
For concentration they are calculated as the quotient between the local share of employee jobs in a specific industry and the local share of national employee jobs. The formula is:
where Ei,r is the number of employee jobs in industry i region r, Ei is the number of employee jobs in industry i, Er is the number of employee jobs in region r and E is the number of employee jobs in Great Britain.
A value of 1.0 means that region r has the same share of employee jobs in industry i as its share of national employee jobs. For example, region r has 4% of manufacturing employee jobs in Great Britain and also 4% of total employee jobs in Great Britain. A value greater than 1.0 means that region r has a higher share of employee jobs in industry i than its share of national employee jobs.
Location quotients can also be interpreted as a measure of industrial specialisation for local areas. In the context of specialisation they compare for each industry, the industry's share of local area employee jobs with its share of total employee jobs. The formula is:
where Ei,r is the number of employee jobs in industry i region r, Er is the number of employee jobs in region r, Ei is the number of employee jobs in industry i and E is the number of employee jobs in Great Britain.
A value of 1.0 means that an industry's share of employee jobs in region r is the same as its share of national employee jobs in Great Britain. For example, industry i makes up 5% of employee jobs in region r and also 5% of employee jobs in Great Britain. A value greater than 1.0 means that industry i makes up a larger share of employee jobs in the local area than at the national level.
Krugman index
The Krugman index is a relative specialisation measure that compares the industrial structures of 2 geographical areas. It runs from zero, if an area has the same employee jobs split across industries as the reference area, to 2 if they have employee jobs in entirely different industries to each other.
The equation for calculating the Krugman index is:
where Ei,r are employee jobs in industry i in region r, Er is the total number of employee jobs in region r, Ei is total employee jobs in industry i and E is the national total of employee jobs.
Nôl i'r tabl cynnwys