1. Introduction
This report documents the methodology and data used in producing the 2014-based subnational population projections for England published on 25 May 2016. It also discusses the impact that the methodology or data used may have had on assumptions made and the resulting projections. There have been changes to the methodology used for the subnational population projections over time. These are summarised in Annex A.
The 2014-based subnational population projections for England provide an indication of the possible size and structure of the future population, based on the continuation of recent demographic trends and are produced on a consistent basis across all local authorities in England. Population projections for English regions, counties and clinical commissioning groups (CCGs) are produced from the local authority projections.
Subnational projections are usually published every 2 years by the Office for National Statistics (ONS), although interim 2011-based projections were published on 28 September 2012 to fulfil a specific user requirement for projections based on the 2011 Census results. The 2012-based subnational population projections were subsequently published on 29 May 2014.
The projections are trend-based, making assumptions about future fertility, mortality and migration levels based on trends in recent estimates, usually over a five-year reference period. They give an indication of what the future population size and age and sex structure might be if recent trends continued. They are not forecasts and generally take no account of policy nor development aims that have not yet had an impact on observed trends.
The Department for Communities and Local Government uses projections as an input into producing household projections. The projections are also used by the Department for Health for healthcare planning, by central and local government for modelling and longer term planning purposes, and by various other groups for planning and research purposes.
The subnational population projections usually have a consultation period. For the 2014-based projections ONS consulted all users about what they need from the projections and related outputs. Additionally English local authority and county council representatives were invited to see and comment on the provisional projections for their area. ONS’s response to the consultation has been published.
Nôl i'r tabl cynnwys2. Overview of methodology
The subnational population projections use the internationally accepted cohort component methodology. These 2014-based projections take the local authority 2014 mid-year population estimates as their starting point. Change in population is calculated by modelling trends. Data for up to 6 preceding years are used, so for the 2014-based projections trends were based on data from the years 2009 to 2014. The projections based on these trends are constrained to the assumptions made for the principal 2014-based national population projection for England.
The projections model splits population between the armed forces and civilian population and treats them differently. The population of armed forces are treated as a ‘static population’ whose size and age and sex structure does not change over the projection period.
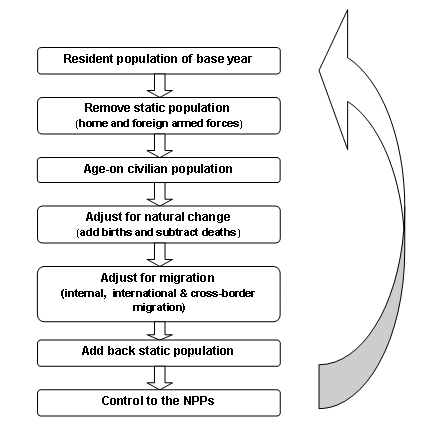
The projections for each year are calculated by first removing this static population to produce a civilian population. The civilian population from the previous year is then aged-on, local fertility and mortality rates are applied to calculate projected numbers of births and deaths, and the population is adjusted for internal (movement between areas within England), cross-border (movements between England and the other countries of the UK), and international (movements between England and countries outside of the UK) migration. For example, for the first year of these projections, the mid-2014 to 2015 change is applied to the mid-2014 base to produce the new mid-2015 population estimate.
Each component (except internal migration) is constrained to its respective total in the 2014-based national population projection for England. Similarly, once the static population has been added back, the projected population is controlled to the 2014-based England principal population projection. This process is repeated for each year of the projection period.
This diagram below illustrates the projection process.
The population at the end of each cycle becomes the base population of the next cycle. The process in each stage is discussed in more detail in later sections of this report.
Projections for CCGs are not produced directly using this method but are based on the projections created for local authorities. In many cases CCG areas are coterminous with local authorities or aggregations of local authorities, in which case projections for these areas would be calculated by aggregating the appropriate local authority projections. Where areas are not coterminous, CCG projections will be produced by apportioning local authority level projections, based on estimates of CCG populations, by age and sex at June 2014.
Nôl i'r tabl cynnwys3. Base population, static population and ageing on
The 2014 mid-year population estimates, rolled forward from the 2011 Census and published on 25 June 2015, provide the starting point as the base data for these projections. These estimates refer to the population at their usual place of residence. This includes all those temporarily away from home (for 6 months or less) and excludes visitors. Armed forces stationed outside England are not included, but those stationed inside England are included. Asylum seekers and visitor switchers (people who enter a country intending to visit, but stay 12 months or more to become usual residents) now residing in England are included. Students are taken to be resident at their term-time address.
The resident population is divided into 2 types for the purposes of projection:
- the civilian population
- armed forces (both home and foreign)
The civilian population refers to the usually resident population excluding home and foreign armed forces who are also usually resident. Home and foreign armed forces constitute a separate population type and are treated as a static population in that their size and age and sex structures are assumed to remain constant over the projection period in the local area they reside at 30 June 2014. See the discussion in the international migration section for information about how the armed forces returning from Germany assumed in the national projections have been treated in the subnational projections.
Data on UK armed forces are supplied by the Defence Statistics, Ministry of Defence and data on foreign armed forces originate mainly from US Air Force statistics. They will include numbers of home and foreign armed forces usually resident in an area. They do not include armed forces dependants; these are included in the civilian population.
Resident armed forces are removed from the usually resident population to create the civilian population at the start of processing each projection year. The civilian population is then aged-on 1 year to become the appropriate age in the following year of the projection. For example 17-year-olds in Birmingham in one year will become the basis for the 18-year-olds in Birmingham for the next year. The population is then adjusted for births, deaths and migration, and in the final stage the resident armed forces are added back in.
Nôl i'r tabl cynnwys4. Births
Projected numbers of births are calculated by applying assumed local authority age-specific fertility rates (ASFRs) to the population to derive a number of births, by age of mother. It is then further assumed that for every 100 girls born there will be 105 boys born. This is the same ratio as used in the national projections. These births figures for local authorities are then constrained to add up to the number of births projected in the 2014-based national population projections for England, and finally these are added to the aged-on population.
Data used
Birth data come from registered births collected by the General Register Office by local authority, age of mother (ages 15 to 44 inclusive) and sex of child. The population estimates used to calculate fertility rates are the latest available based on the mid-2014 population estimates and the revised back series of population estimates which include the results of the 2011 Census.
Detailed methodology
The projections model calculates local authority-level ASFRs for each of the past 5 years using births between mid-year points by age of mother and the population at the end of that period. National-level ASFRs are calculated in a similar way using the total number of births in a year and the total population at the end of the year. The sum of the 5 local ASFRs is then divided by the sum of the 5 national ASFRs to create an average differential for each local authority. The differentials are then applied to the national ASFRs from the first year of the national population projections in order to calculate local ASFRs.
The projected number of births is then calculated for each year by multiplying the local level ASFRs by the number of women of the corresponding age, local authority and year. Projected total births are then split by sex of child using a fixed national sex ratio at birth (105 boys to every 100 girls).
The total number of births is controlled to the national projected total of births by dividing the national birth data by the aggregated local authority birth data for each combination of age of mother against sex of child. This gives a scaling factor for each age/sex combination, which are then applied to the local authority level data. This method ensures that the component, in this case births, sums to the national total.
The following adjustments were made in the 2014-based subnational projections to improve the projections of births in local areas:
- fertility rates are capped to be no greater than 5 times the national fertility rate. No areas were affected by this capping for the 2014-based projections.
- For the Isles of Scilly, fertility rates were replaced by the assumed fertility rates used in the national population projections for England. This is because fertility rates for this area are highly volatile due to its small population size.
- Where fertility rates for a single year of age were zero, these were replaced by the projected national rates. The ASFRs for 15 and 16 year old women in City of London, 15 year old women in Ribble Valley and 15 year old women in West Somerset were replaced by the national rates. As fertility rates for these ages are very low the impact of this adjustment on the projected number of births for these areas was minimal.
These births then become the infants for the year being projected.
Nôl i'r tabl cynnwys5. Deaths
Projected numbers of deaths are calculated by applying assumed local authority-level age/sex-specific mortality rates (ASMRs) to derive numbers of deaths, by age and sex. These are then controlled to add up to the number of deaths projected in the national population projections for England, and finally these are subtracted from the aged-on population.
Data used
Death data come from registered deaths collected by the General Register Office by local authority, age and sex. The population estimates used to calculate mortality rates are the mid-2014 population estimates and the revised back series of population estimates which include the results of the 2011 Census.
Detailed methodology
The projections model calculates local authority-level ASMRs in a similar method to that used for the fertility rates. ASMRs are created for each of the past 5 years using number of deaths occurring between mid-year points by age and sex and the population at the end of the year. National-level ASMRs are calculated in a similar way using the total number of deaths in a year and the total population at the end of the year. The sum of the 5 local ASMRs is then divided by the sum of the 5 national ASMRs to create an average differential for each local authority. The differentials are then applied to the national ASMRs from the first year of the national population projections in order to calculate local ASMRs.
The projected number of deaths is then calculated for each year by multiplying the local-level ASMRs by the population for each age and sex in each local authority.
The total number of deaths at that age and sex is controlled to the national projected total of deaths by dividing the national death data by the local authority death data. This gives scaling factors by age and sex which are applied to the local authority level data. This method ensures that the number of deaths sums to the national total.
The following adjustment was made in the 2014-based subnational projections to improve the projections of deaths in local areas:
- mortality rates are capped to be no greater than 5 times the national mortality rate. No areas were affected by this capping for the 2014-based projections.
- for the Isles of Scilly and the City of London, mortality rates were replaced by the assumed mortality rates used in the national population projections for England. This is because mortality rates for these areas are highly volatile due to their small population size.
- where mortality rates were zero for an individual age/sex for an area these were replaced by the projected national rate for that age/sex. Most local authorities were affected by this adjustment.
These deaths are then subtracted from the aged-on population.
Nôl i'r tabl cynnwys6. Internal migration
Adjusting for the expected number of people entering and leaving a local authority by age and sex is done separately for internal, cross-border and international migration using different methodologies. This section describes the data sources and methods for internal migration.
An internal migrant is defined as someone who changes their local authority of residence between one year and the next. In the subnational population projections, internal migration is defined as migration between areas within England only. For some other uses internal migration is defined as including migrant flows between England and Wales, Scotland and Northern Ireland, but in the subnational projections these are referred to as cross-border flows. This is because the methodology used to project internal migration requires a full matrix of flows into and out of each local authority by single year of age and sex. This level of detail is not required to project cross-border migration and it is therefore treated separately.
Internal migration estimates produced by ONS provide an origin-destination matrix which provides information on moves from each local authority to every other local authority by sex and single year of age. To project internal migration moves, five-year trend data from 2009/10 to 2013/14 are used to estimate the average proportion of the population at that age and sex that has left a particular local authority and where they have moved to. By applying these proportions to the population figures, estimates of internal migration flows between areas are calculated. By adding up the estimated number of outflows of internal migrants from every other authority into a particular authority, the inflows into that authority are calculated. The population is then adjusted for these internal moves between areas and at the end of this step we have a temporary population which has been adjusted for internal migration.
Data used
Migration is recognised as the most difficult component of population change to estimate as there is no compulsory system within the UK to record movements of the population. At present ONS uses a combination of 3 administrative data sources as a proxy for internal migration within England and Wales: the National Health Service Central Register (NHSCR), the Patient Register Data Service (PRDS) and Higher Education Statistics Agency (HESA) data. ONS uses these data sources to calculate the internal migration component of the mid-year population estimates, which forms the basis upon which projected internal migration is calculated.
The published population estimates series data for internal migration are used to calculate the trends in the 2014-based subnational population projections. The methodology used to create the internal migration estimates changed with the 2011/12 estimates. Further information on the methodology used to estimate internal migration between 2007 and 2011 and the current methodology is available.
The population estimates used to calculate internal migration rates are the mid-2010 to mid-2014 population estimates.
Detailed methodology
The proportion of people moving from one local authority is calculated by dividing the number of people moving out of the area by the number of people living there. This is calculated separately for males and females by single year of age for each of the trend years individually and then a five-year average is calculated to produce rates of out-migration by age and sex. In some local authorities with small numbers of moves and/or populations, this can lead to atypical rates which produce unrealistic results in the projected population. To overcome this, adjustments are sometimes made to smooth the data. These can take the form of upper limits (or caps) on migration rates, or the replacement of rates with appropriate alternatives. The following adjustment was applied in the 2014-based projections:
- the assumed proportion of people of any individual age and sex group moving out of an area was capped at a maximum rate of 0.75. Four local authorities have been affected by this capping; Chiltern, Isles of Scilly, Oadby and Wigston, and Rutland
- for Oadby and Wigston, the internal out migration probabilities for males were replaced by those for females for ages 19 to 25. This was to overcome a known issue in the population estimates regarding a first year University of Leicester student hall of residence situated in Oadby and Wigston. More detail relating to this adjustment is available in the 2014-based subnational population projections quality and methodology information report.
No other specific local authority adjustments have been made to the internal migration assumptions for the 2014-based projections.
The out-migration rates are applied to the aged-on civilian population (after adjusting for births and deaths) in each authority in order to estimate the number of internal out-migrants for the projected year.
To distribute the projected out-migrants to a destination local authority, the origin-destination matrix is used. The probability of a person moving from local authority A to local authority B given that they are moving from local authority A is calculated by dividing the number of people moving from A to B by the total number moving out of A using 5 years’ trend data.
The total inflow for each authority is calculated by adding the outflows from every other authority into this particular authority.
The net internal migration adjustment for each local authority, by age and sex, is calculated by subtracting outflows from inflows. The total net internal migration adjustment across all local authorities in England must sum to zero, as these are movements within the country, not between countries.
The population is then adjusted for these internal moves between areas and at the end of this step we have a temporary population which has been adjusted for internal migration
Impacts of methodology and data used
In 2013 we extended the method used to estimate internal migration for the population estimates and projections to better reflect moves of students, both to and from their place of study. A paper outlining this work was published on the ONS website. We are continuing research into internal migration, in particular looking at further improving the estimation of students' destinations when they move after leaving study; estimating moves of armed forces and prisoner populations; and better estimating moves within the year of people who are not present at the start (or the end) of the year. We plan to publish an update on this work later in 2016.
The internal migration assumptions are set in terms of the probability of moving out of an area. For the majority of areas and most ages, the calculated probabilities are realistic even though there are delays in some people registering with a GP after moving. This is because either, there are no material delays in GP registration for that age group, this would be expected for families and older people, or the delays cancel out. For example, any estimate of 22 year old movers will include those who moved in the year the estimates refer to, while they were 22, and re-registered with a new GP. It will also include some people who moved in previous years, when they were younger (for example aged 20 or 21) but who delayed re-registering with a new GP until the year the estimate refers to, by which time they had turned 22. However, the estimate will also miss 22 year olds who did move during the reference period but who have not yet changed their GP registration. When these individuals do re-register in future, they will contribute to estimates referring to a different year, and for an older age group depending on their age by that point (for example estimates of 23 or 24 year olds). If the additional 22 year olds in an estimate are similar to the missed 22 year olds, errors will cancel out and the estimated out migration probabilities used in the projections model would still be realistic.
However, for some age groups in some areas, there are reasons why they may not be similar. These areas are more likely to be those with large student populations. The impact of this will be an over estimation of the migration rates at some ages and an under estimation at other ages. We plan to review this issue prior to the next round of population projections.
Overall ONS believes that the projections for the total population in an area to be robust. However, users are advised to take this into account when interpreting the projected figures by age.
Nôl i'r tabl cynnwys7. Cross-border migration
Adjusting for the expected number of people entering and leaving a local authority by age and sex is done separately for internal, cross-border and international migration using different methodologies. This section describes the data sources and methods used to create the cross-border migration. Cross-border migration is the moves made by people between England and the rest of the UK.
Data used
Cross-border migration between England and the rest of the UK is captured in a similar way to internal migration flows. Flows between England and Wales are produced using the same data sources as for internal migration.
Information on moves in to, and out of, Scotland and Northern Ireland are collected and treated differently from moves within England and Wales, by using data from National Records of Scotland and the Northern Ireland Statistics Research Agency. Further information is available in the internal migration estimates methodology guide.
Detailed methodology
To calculate cross-border moves, an average of 5 years’ cross-border estimates data from 2009/10 to 2013/14 has been used to give an average count of moves between local authorities in England and the other countries of the UK (Wales, Scotland and Northern Ireland).
The assumption is that this average remains constant for the whole projection period; however, this is not strictly accurate, as with the other components, the cross-border migration is controlled to the national population projections, by age and sex for each year, so the local authority level figures may be scaled up or down according to the national projected cross-border moves. In the 2014-based national population projections, cross border moves were set as rates rather than as a fixed number of migrants for the first time. The constrained local authority projections therefore reflect this change to the method. For technical reasons, there is a small discrepancy (approximately 200) between the NPP cross-border flows for England and the total of the SNPP flows for 2022 onwards: however consistency between NPPs and SNPPs is maintained through the final constraining process.
The population is then adjusted for these cross-border moves and at the end of this step we have a temporary population which has been adjusted for cross-border migration.
Nôl i'r tabl cynnwys8. International migration
Adjusting for the expected number of people entering and leaving a local authority by age and sex is done separately for internal, cross-border and international migration using different methodologies. This section describes the data sources and methods for international migration.
The national projections international migration assumptions are made in terms of in and out flows of international migrants (including adjustments for visitor and migrant switchers) and asylum seekers into England. These streams are used in the subnational population projections with the inflows (immigration), outflows (emigration) and asylum seekers modelled separately. The data sources and methods are described for each stream below.
The outflows from each stream are subtracted from their respective inflows to calculate the net flow for each stream by local authority, age and sex. These net flows are then added to the temporary population, which was created in the preceding migration step.
Data used
The main source of information on international migration is the International Passenger Survey (IPS). This is a voluntary sample survey of passengers travelling through airports, seaports and the Channel Tunnel. It provides information on the number of people intending to stay in, or leave, the UK for 12 months or more. Adjustments are made to account for people who enter or leave the country initially for a short stay but subsequently decide to remain for a year or more (“visitor switchers”) and people who originally intend to be migrants but in reality stay in the UK or abroad for less than 1 year (“migrant switchers”).
The 2014-based subnational population projections use the published international migration component of population change as used in the published population estimates series. Estimates from mid-2006 to mid-2011 include the adjustments for additional EU8 migrants identified when the population estimates were revised after the 2011 Census. Details about this can be found in the report Methods used to revise the subnational population estimates 2002 to 2010. The 2014-based subnational projections use an average of international migration estimates for year ending mid-2009 to year ending mid-2014.
Local authority estimates for immigration are created by distributing migration estimates directly from the national to local authority level using administrative data sources. Details about this methodology were first published with the indicative mid-year population estimates in November 2011. Estimates of emigration for local authorities are created by using a statistical model which uses the IPS and other data sources to create a more robust estimate of emigration at local authority level. Details about this methodology were published with the improvements to the mid-2008 population estimates in November 2009.
The 2014-based subnational projections trend data for international migrants are already adjusted for visitor and migrant switchers so they are being modelled as part of the international migration flows.
Detailed methodology
For immigration (international inflows) an average of 6 years’ historic trend data from year ending mid-2009 to year ending mid-2014 has been used to give an average count of moves of international migrants into local authorities in England. The assumption is that this average remains constant for the whole projection period; however, as with the other components, this inflow is controlled to the national population projections, by age and sex for each year, so according to the national projected immigration the local authority level figures may be scaled up or down. See section discussing some impacts of constraining to the national population projections.
The method used for calculating emigration (international outflows) in the 2014-based subnational population projections remains unchanged. For consistency with previous projections, 6 years of historic trend data are used. To ensure that each year’s trend data is not more heavily weighted than any other, the 6 years of trend data are averaged using weights based on data at a national and regional level to create an average count of moves of international migrants out of local authorities. Within this process the assumption is that this average remains constant for the whole projection period; however, as with the other components, this outflow is controlled to the national population projections, by age and sex for each year, so according to national projected emigration the local authority level figures may be scaled up or down.
Some impacts of constraining to the national population projections
As already mentioned controlling to the 2014-based national population projections migration assumptions will entail scaling of the local trends calculated. Therefore there may be a step change between recent trends locally and the assumptions used in the subnational population projections. Six years’ data are used to create the local trends in the subnational projections, however, the national projections use different models and a much longer time series in setting the national long term assumptions. Therefore it is not unusual for the assumptions made for international migration to be at a different level to a simple average of the latest local data.
For the 2014-based national projections, a linear trend from the mid-2014 international migration estimate to the long-term migration assumption was applied to the inflow and outflow data to derive the short-term assumptions. In the first year of the projection a further adjustment was made to the projected immigration assumption for all countries of the UK based on provisional migration data available for the first 6 months of the year. The international migration assumptions for England therefore show a rise in immigration in 2014 to 2015 from the mid-2014 estimate followed by a decline to the long-term assumption which is constant from 2020 to 2021 onwards. For emigration there is a very small gradual rise from the mid-2014 estimate to the long term assumption. Due to constraining it is common for the international migration projections for a local authority to mirror these England-assumed trends.
The 2014-based national population projections made allowance in the international migration assumptions for planned returning armed forces personnel and their dependants from Germany between the year ending mid-2016 and the year ending mid-2018. The standard subnational population projection methodology distributes these according to the international migration flows and not where armed forces are currently based in England. Local authorities where there are large numbers of armed forces need to be aware of this and make allowance for these separately in their planning if they have specific information about this. However, in the case of Wiltshire, a specific adjustment was made for the anticipated return of armed forces to the area. More detail relating to this adjustment is available in the 2014-based subnational population projections quality and methodology information report.
Nôl i'r tabl cynnwys9. Asylum seekers
Data on asylum seekers and their dependants are provided by the Home Office and the National Asylum Support Service. Applications for asylum (excluding an estimate of those removed from the UK within 1 year and a small number of asylum seekers captured by the IPS) provide the basis for estimated inflows of asylum seekers. Data on removals, refusals, withdrawals and appeals for principal applicants and dependants are used to estimate outflows of asylum seekers leaving the UK after 12 months or more without being captured by the IPS.
Only the most recent year of data is used, and the numbers are assumed to remain constant through the projection period. Asylum seeker data at local authority level are controlled to the national projections to produce the assumptions.
Nôl i'r tabl cynnwys10. Final constraining stage
At the England level, the subnational population projections are consistent with the 2014-based national population projections for England. The underlying assumptions used in the national projections are agreed in liaison with the devolved administrations following consultation with key stakeholders and after seeking expert advice. 2014-based national population projections data and supporting documentation are available on the ONS website.
After adjusting for natural change and migration, the home and foreign armed forces populations are added back to the adjusted civilian population, and a final constraining stage for the population figures is undertaken.
The birth, death and migration components have all been controlled to the corresponding England data at the end of each projection year. However, the subnational projections components of change do not always fully explain the change in total population between one year and the next. This is due to a difference in the processing order and way mortality and fertility rates are applied in the national population projections and the subnational population projections. Consequently a final controlling step takes place to ensure that the subnational population projections add up to the national population projections by both age and sex. This is done as the last process in the cycle of producing the projection for a year which then forms the base population for the next year’s calculation. This process is repeated to produce each year’s subnational population projections and is why the components of change in the subnational population projections do not necessarily fully equal the population change between one year and the next in the projections.
Nôl i'r tabl cynnwys11. Annex A – Changes to subnational population projections methodology
Table 1: Changes to subnational population projections methodology
| Methodology changed | Description | Projections round change first implemented |
| Cross-border migration | National population projections cross-border migration assumptions set as rates rather than numbers of migrants. Although subnational migration methodology is not directly changed, figures are constrained to national flows calculated on the new basis. | 2014-based |
| International migration | Visitor switchers are no longer being modelled separately because data for visitor switchers are now included with the main international migration data and are therefore modelled with these flows. | 2012-based |
| Internal migration | Capping of the proportion of people of any individual age and sex group moving out of an area to another area within England was changed to 0.75 (was 0.80 in 2010-based projections) | 2012-based |
| International migration | Up to mid-2008, estimates of migration from the Republic of Ireland were made separately from IPS flows and were therefore treated separately in the subnational population projections methodology. They are now included in IPS flow data so are projected along with other international migration flows. | 2010-based |
| International migration | Projections are based on the migration estimates from the indicative mid-year estimates which used new methods to distribute in-migrants to local authorities. These were based on distributing migration estimates directly from the national to local authority level using administrative data sources. | 2010-based |
| Source: Office for National Statistics | ||