1. Introduction
This report provides a brief summary of the results of the 2014-based national population projections for the UK and provides additional charts and summary tables illustrating the results of the projections. For discussion of the results see the statistical bulletin.
Included are sections on:
results, which can also be examined using the interactive population pyramids, which allow comparisons of the projected age structure up to mid-2039
the role of migration in population growth
comparison with the results of the 2012-based national population projections
charts for the UK and constituent countries, which are available in the appendices, showing:
- estimated and projected total population, year ending mid-1971 to year ending mid-2089
- estimated and projected births and deaths, year ending mid-1971 to year ending mid-2089
- percentage age distribution for the period, year ending mid-1971 to year ending mid-2089
- estimated and projected total population for the principal and key variant projections, year ending mid-1981 to year ending mid-2039
- change in the projected population at 2039 by age and sex compared with the 2012-based projections
2. Summary of results
Results
The UK population is projected to increase gradually from an estimated 64.6 million in mid-2014 to reach 74.3 million by mid-2039. Of the projected 9.7 million increase between mid-2014 and mid-2039, approximately 4.7 million (49%) is due to projected natural increase (more births than deaths) while the remaining 5 million (51%) is the assumed total number of net migrants.
Summary results tables
Table 2.1 presents a summary of the projection results by components of change from mid-2014 to mid-2039, for the UK. The equivalent tables for the constituent countries of the UK, England and Wales, and Great Britain can be found in the data download of this table.
Table 2.1: Components of change: summary (annual average), UK, mid-2014 to mid-2039
| Thousands | ||||||
| 2014-15 | 2015-20 | 2020-25 | 2025-30 | 2030-35 | 2035-39 | |
| Population at start | 64,597 | 65,097 | 67,360 | 69,444 | 71,353 | 73,044 |
| Births | 776 | 796 | 810 | 803 | 801 | 815 |
| Deaths | 605 | 566 | 578 | 606 | 648 | 690 |
| Natural change | 171 | 229 | 232 | 197 | 153 | 125 |
| Migration | 329 | 223 | 185 | 185 | 185 | 185 |
| Total change | 500 | 453 | 417 | 382 | 338 | 310 |
| Population at end | 65,097 | 67,360 | 69,444 | 71,353 | 73,044 | 74,284 |
| Source: Office for National Statistics | ||||||
| Note: | ||||||
| 1. Figures may not sum due to rounding | ||||||
Download this table Table 2.1: Components of change: summary (annual average), UK, mid-2014 to mid-2039
.xls (85.5 kB)Charts of summary results
This section presents charts for the UK for the year ending mid-1971 to the year ending mid-2089. The equivalent charts for the constituent countries of the UK are available in the appendices A to D.
Figure 2.1 presents the estimated and projected total population in the UK between mid-1971 and mid-2089 and shows that the population is projected to continue to rise gradually over the period to mid-2089.
Figure 2.1: Estimated and projected total population, UK, year ending mid-1971 to year ending mid-2089
Source: Office for National Statistics
Download this chart Figure 2.1: Estimated and projected total population, UK, year ending mid-1971 to year ending mid-2089
Image .csv .xls
Figure 2.2: Estimated and projected births and deaths, UK, year ending mid-1971 to year ending mid-2089
Source: Office for National Statistics
Download this chart Figure 2.2: Estimated and projected births and deaths, UK, year ending mid-1971 to year ending mid-2089
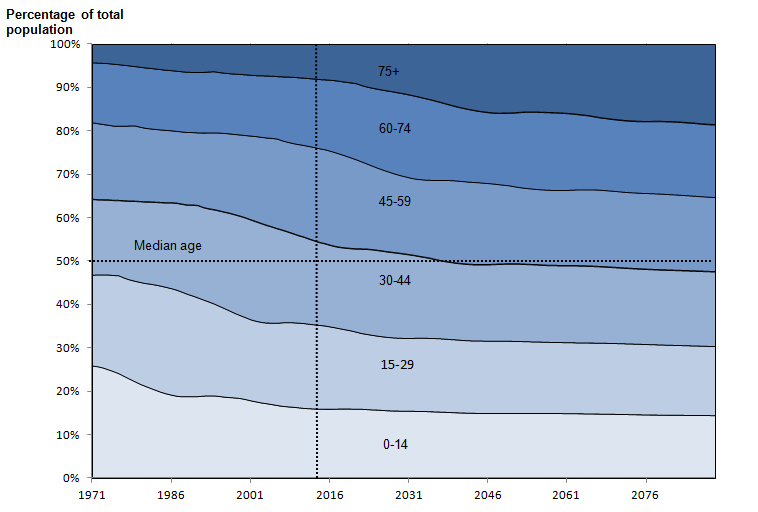
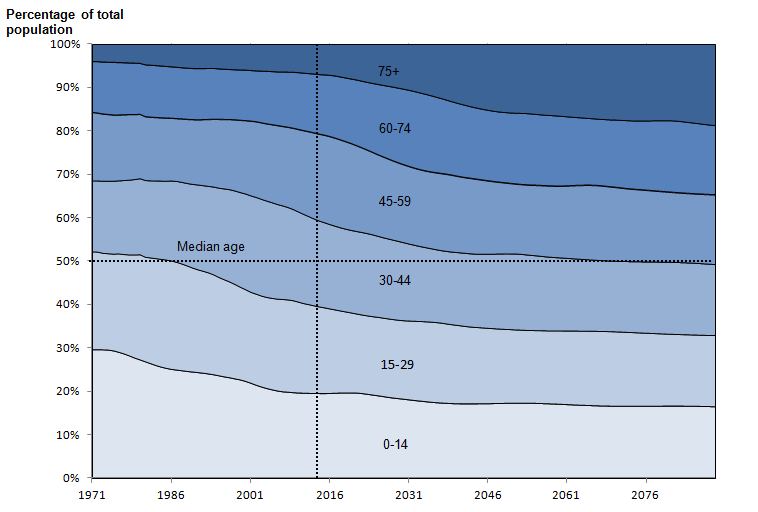
Image .csv .xlsFigure 2.3 shows how the age distribution of the UK is projected to change, illustrating how the median age of the population increases through the projection period.
Figure 2.3: Percentage age distribution, UK, year ending mid-1971 to year ending mid-2089
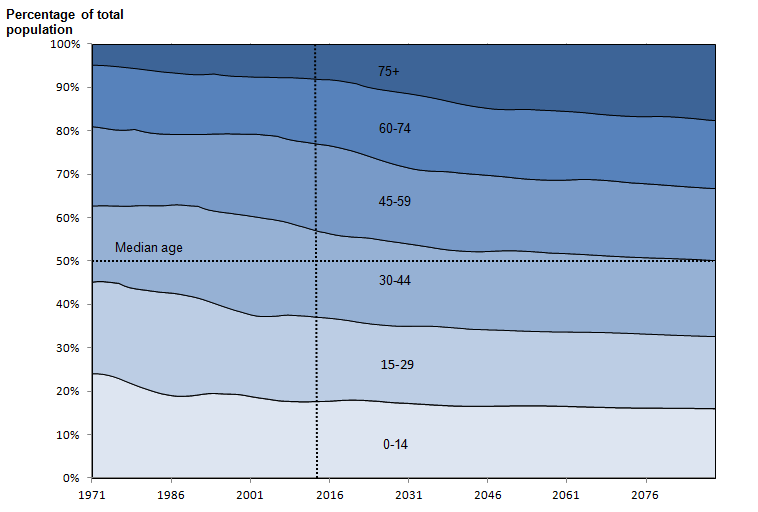
Source: Office for National Statistics
Download this image Figure 2.3: Percentage age distribution, UK, year ending mid-1971 to year ending mid-2089
.png (22.0 kB)Variant projections
Table 2.2 presents projections of the total population under the principal projection, standard variant projections and special case scenarios for the UK and its constituent countries in mid-2039. Three additional measures are also included: the percentage of the population under 16, percentage of population 65 and over, and dependants per 1,000 persons of working age.
A further 7 variant projections (2 standard variants and 5 special case scenarios) are due to be released on 26 November 2015.
Table 2.2: Measures of population structure under the principal projection, standard variant projections and special case scenarios, UK, mid-2039
| Projection | Total population (000s) | % of population aged under 16 | % of population aged 65 & over | Dependants per 1,000 persons of working age* |
| Principal projection | 74,284 | 17.8 | 24.3 | 666 |
| SINGLE COMPONENT VARIANTS | ||||
| High fertility | 75,765 | 19.0 | 23.8 | 689 |
| Low fertility | 72,504 | 16.4 | 24.9 | 642 |
| High life expectancy | 75,051 | 17.6 | 25.0 | 680 |
| Low life expectancy | 73,488 | 18.0 | 23.6 | 652 |
| High migration | 76,786 | 18.0 | 23.7 | 654 |
| Low migration | 71,783 | 17.6 | 25.0 | 679 |
| COMBINATION VARIANTS | ||||
| Largest/smallest total population size | ||||
| High fertility, High life expectancy, High migration | 79,090 | 19.0 | 23.8 | 691 |
| Low fertility, Low life expectancy, Low migration | 69,273 | 16.4 | 24.9 | 640 |
| SPECIAL CASE SCENARIOS | ||||
| Zero migration (natural change only) | 67,658 | 16.8 | 26.3 | 690 |
| Source: Office for National Statistics | ||||
| Notes: | ||||
| * Dependants are children under 16 and people of state pensionable age and over. Working age and pensionable age populations are based on state pension age (SPA) for given year. Between 2012 and 2018, SPA will change from 65 years for men and 61 years for women, to 65 years for both sexes. Then between 2019 and 2020, SPA will change from 65 years to 66 years for both men and women. Between 2026 and 2027 SPA will increase to 67 years and between 2044 and 2046 to 68 years for both sexes. This is based on SPA under the 2014 Pensions Act. | ||||
Download this table Table 2.2: Measures of population structure under the principal projection, standard variant projections and special case scenarios, UK, mid-2039
.xls (74.2 kB)Figure 2.4 shows the actual and projected population for the UK between mid-1981 and mid-2039, by principal projection and selected standard variants.
Figure 2.4: Estimated and projected total population, UK, year ending mid-1981 to year ending mid-2039
Source: Office for National Statistics
Download this chart Figure 2.4: Estimated and projected total population, UK, year ending mid-1981 to year ending mid-2039
Image .csv .xlsThe equivalent charts for the constituent countries of the UK can be found in the relevant appendices.
Nôl i'r tabl cynnwys3. Migration and population growth
deaths and because of positive net migration. However, the components of population change are not independent of each other. In particular, the projected numbers of future births and deaths are themselves partly dependent on the assumed level of net migration.
An understanding of the overall effect of migration on population growth can be obtained by comparing the results of the principal and main variant projections with those of the zero net migration ("natural change only") variant projection. The zero net migration variant assumes that net migration will be zero at all ages in future, but makes the same assumptions about fertility and mortality as the principal projection. In this analysis, the effect of net migration on population growth in the period to mid-2039 is considered.
If annual net inward migration to the UK was to average 185,000 a year (the long-term assumption in the principal projection) this would lead to a total net inflow of 4.625 million migrants in the period between mid-2014 (the base year of the projections) and mid-2039. In fact, the projected total number of net migrants during this period in the principal projection is slightly higher (4.96 million) due to the higher migration assumptions for the first few years of the projection.
The assumed fertility and mortality rates are the same in the principal projection, the zero net migration variant projection and the high and low migration variants. However, because migration is concentrated at young adult ages, the different assumed numbers of migrants affect the number of women of childbearing age and hence the future number of births.
There is no comparable effect on deaths, at least in the period to mid-2039. At ages over 35, assumed net migration flows fall considerably in the principal projection and the high and low migration variants so the projected number of deaths over the period to mid-2039 is similar under all the migration variants.
Table 2.3 shows the projected components of population change in the period to mid-2039 in the principal projection, the high and low migration variants (which assume long-term annual net inward flows of 265,000 and 105,000 a year respectively), and the zero net migration variant projection.
Table 2.3: Projected population change, UK, mid-2014 to mid-2039
| Thousands | |||||
| High migration variant | Principal projection | Low migration variant | Zero net migration variant | ||
| Population at mid-2014 | 64,597 | 64,597 | 64,597 | 64,597 | |
| Population change (2014-39) | |||||
| Births | 20,677 | 20,087 | 19,498 | 18,304 | |
| Deaths | 15,408 | 15,360 | 15,312 | 15,242 | |
| Natural change | 5,269 | 4,727 | 4,186 | 3,061 | |
| Net migration | 6,920 | 4,960 | 3,000 | 0 | |
| Total change | 12,189 | 9,688 | 7,186 | 3,061 | |
| Population at mid-2039 | 76,786 | 74,284 | 71,783 | 67,658 | |
| Source: Office for National Statistics | |||||
Download this table Table 2.3: Projected population change, UK, mid-2014 to mid-2039
.xls (25.6 kB)Table 2.4 shows how the projected population growth is broken down between the assumed level of net migration and projected natural change.
Table 2.4: Projected population growth by component, UK, mid-2014 to mid-2039
| Thousands | |||
| High migration variant | Principal projection | Low migration variant | |
| Total population increase between 2014 and 2039 | 12,189 | 9,688 | 7,186 |
| Resulting from: | |||
| Assumed net migration | 6,920 | 4,960 | 3,000 |
| Natural change assuming zero net migration | 3,061 | 3,061 | 3,061 |
| Additional natural change from assumed level of net migration | 2,207 | 1,666 | 1,124 |
| Source: Office for National Statistics | |||
Download this table Table 2.4: Projected population growth by component, UK, mid-2014 to mid-2039
.xls (23.0 kB)In the principal projection, the population of the UK is projected to grow by 9.7 million between mid-2014 and mid-2039. Some 5 million of this increase is directly due to the assumed number of net migrants. Natural change accounts for a further 4.7 million –- the difference between 20.1 million births and 15.4 million deaths. Just over 3 million of this natural change (increase) would occur with zero net migration. The remaining 1.7 million is the net effect of the assumed annual level of net migration on natural change (almost entirely the effect on births).
Some 51% of population growth in the principal projection is therefore directly attributable to the assumed number of net migrants. The remaining 49% is attributable to projected natural change (of which 32 percentage points would occur with zero net migration and 17 percentage points arise from the effect of net migration on natural change). In total, therefore, some 68% of population growth in the period to mid-2039 in the principal projection is attributable, directly or indirectly, to future net migration.
It should be emphasised that these calculations are based on comparing alternative projections which make the same assumptions about future fertility and mortality rates irrespective of the assumed level of net migration. In practice, fertility and mortality rates for new migrants are likely to differ, to some extent, from those for the existing population.
Note that the principal projection and the zero net migration variant projection for the UK are calculated by aggregating equivalent projections for the 4 constituent countries of the UK. The resulting UK level fertility and mortality rates are therefore effectively weighted averages of those for the individual countries. This leads to some very small differences at UK level between the effective fertility and mortality rates used in the principal projection and the zero net migration variant. This has no significant effect on the analysis in this section.
Nôl i'r tabl cynnwys4. Comparisons with previous projections
Base population
Overall, the published mid-2014 population estimate for the UK is 86,000 (0.1%) higher than the 2012-based projection of the population at mid-2014.
Projected future population
The projected population of the UK at mid-2039 is about 419,000 (0.6%) higher than in the 2012-based projections. This is because the population of the UK is projected to grow at a faster rate in the 2014-based projections than the 2012-based projections. This is mainly due to the 2014-based projections assuming higher levels of international migration.
At mid-2039, populations are projected to be lower than in the 2012-based projections for Scotland and Wales but slightly higher for England and Northern Ireland. The percentage difference by mid-2039 is greatest for Scotland (1.8% lower) where the projected levels of births and net migration have fallen. The projected population of Wales is 1.5% lower than in the 2012-based projections. Conversely, the populations of England and Northern Ireland are projected to be 0.9 and 0.5% higher, respectively, than previously projected.
Compared with the previous projections, the UK population at mid-2039 is higher in all broad age groups apart from those aged 75 and over, where it is 164,000 lower than the 2012-based projections.
Comparisons with the previous (2012-based) projections are given in Tables 2.5 and 2.6 and illustrated in Figure 2.5.
Table 2.5: Changes in projected births, deaths and net migration compared with the 2012-based projections, UK
| 2014 to 2015 | 2015 to 2025 | 2025 to 2035 | 2035 to 2039 | |||||
| 000s | % | 000s | % | 000s | % | 000s | % | |
| Births | -34 | -4.2 | -105 | -1.3 | 24 | 0.3 | 6 | 0.2 |
| Deaths | 57 | 10.3 | 154 | 2.8 | 104 | 1.7 | 44 | 1.6 |
| Net migration | 165 | 358 | 200 | 80 | ||||
| Total change | 74 | 99 | 120 | 41 | ||||
| Source: Office for National Statistics | ||||||||
| Note: | ||||||||
| 1. Net migration and total change can be positive or negative and hence it is not possible to express change in percentage terms | ||||||||
Download this table Table 2.5: Changes in projected births, deaths and net migration compared with the 2012-based projections, UK
.xls (95.2 kB)
Table 2.6: Changes in projected population by age compared with 2012-based projections, UK
| mid-2014 | mid-2025 | mid-2035 | mid-2039 | |||||
| Age group | 000s | % | 000s | % | 000s | % | 000s | % |
| 0-14 | 48 | 0.4 | 17 | 0.1 | 181 | 1.5 | 194 | 1.6 |
| 15 - 29 | -40 | -0.3 | 115 | 0.9 | 70 | 0.5 | 79 | 0.6 |
| 30 - 44 | 29 | 0.2 | 66 | 0.5 | 18 | 0.1 | 19 | 0.1 |
| 45 - 59 | 33 | 0.3 | 122 | 1.0 | 124 | 1.0 | 116 | 0.9 |
| 60 - 74 | 19 | 0.2 | 93 | 0.8 | 151 | 1.2 | 175 | 1.5 |
| 75 & over | -4 | -0.1 | -155 | -2.1 | -165 | -1.8 | -164 | -1.6 |
| All ages | 86 | 0.1 | 259 | 0.4 | 378 | 0.5 | 419 | 0.6 |
| Source: Office for National Statistics | ||||||||
Download this table Table 2.6: Changes in projected population by age compared with 2012-based projections, UK
.xls (114.7 kB)The equivalent tables for the constituent countries of the UK can be found in the Excel download.
Figure 2.5 shows change in the projected population for the UK at mid-2039, compared with the 2012-based projections.
Figure 2.5: Change in projected population at mid-2039 by age and sex compared with the 2012-based projections, UK
Source: Office for National Statistics
Notes:
Where the percentage change is greater than 0, the 2014-based projection is greater than the 2012-based projection.
Where the percentage change is less than 0, the 2014-based projection is less than the 2012-based projection.
Download this chart Figure 2.5: Change in projected population at mid-2039 by age and sex compared with the 2012-based projections, UK
Image .csv .xlsThe equivalent charts for the constituent countries of the UK can be found in the relevant appendices.
Nôl i'r tabl cynnwys
