1. Introduction
The 2014-based national population projections for the UK and its constituent countries were produced by the Office for National Statistics (ONS) on behalf of the National Statistician and the Registrars General of Scotland and Northern Ireland.
This chapter provides the background to the national population projections, including their history, purpose and availability. It describes the methodology used to produce the projections and provides an outline of the related projections available.
Nôl i'r tabl cynnwys2. Background
Purpose
Projections relate to the usually resident population of the UK and its constituent countries. The population includes all usually resident persons, whatever their nationality. The usually resident population includes all long-term international migrants (people changing their country of usual residence for at least one year) but excludes short-term migrants who come to or leave the UK for less than one year.
The projections are based on the population estimates as at 30 June 2014 and a set of underlying demographic assumptions regarding future fertility, mortality and migration. The assumptions were based on the best statistical evidence available at the time and were agreed in liaison with the devolved administrations – Welsh Government, National Records of Scotland (NRS) and Northern Ireland Statistics and Research Agency (NISRA) – following consultation with the main users of projections in each country and advice from an expert academic advisory panel.
The primary purpose of the national population projections is to provide an estimate of the future population of the UK and its constituent countries which is used as a common framework for national planning in a number of different fields. They are also used as the base for other official population projections such as subnational projections, household projections and in the calculation of life tables. These official sets of projections ensure that the many users of projections can work on consistent assumptions.
The projections are the outcome of a calculation showing what happens if particular assumptions are made. As a forecast of the future population they would inevitably be proved wrong, to a greater or lesser extent. As well as not taking into account future government policies, there is uncertainty in the underlying data – for example, estimates of the current population or of past migration flows – on which the projections are based. In addition, there is inevitable uncertainty in the assumptions reflecting the inherent unpredictability of demographic behaviour. The latter reason means that projections become increasingly uncertain the further they are carried forward into the future. To give users of the projections an indication of this uncertainty, in addition to the principal (main or central) projection, a number of variant population projections have also been produced based on alternative assumptions of future levels of fertility, mortality and migration. These are discussed in the variants chapter.
We published the 2014-based principal and key variant projections on 29 October 2015, with additional variants released on 26 November 20151.
Projections history
The first projections of the population of the UK were made by the Government Actuary’s Department (GAD) in the 1920s. One of the main uses of these earliest projections was in connection with long-term financial estimates under the Contributory Pensions Acts and other schemes of social insurance. Projections made since the war, however, have been increasingly used in all areas of government planning. New projections were produced each year from 1955 to 1979 and then every second year until 1991. There was then a 1992-based set and since then projections have resumed to being produced every second year.
Additional “interim” projections are occasionally produced. The 2001-based projections were published following the 2001 Census and an additional set were produced based on the 2003 estimates to incorporate revisions to the population estimates for England and Wales. Responsibility for the production of national population projections transferred to ONS on 31 January 2006.
Publications
This volume, the latest in a regular series which started in 1970, gives details of the 2014-based national population projections produced by ONS (based on the estimated population of mid-2014). These replace the 2012-based projections published on 6 November 2013.
Expert advisory panel
As part of the production process for the 2004-based projections round, an expert academic panel was convened in 2005 to advise us on current and emerging demographic trends and their possible implications for the national population projections. An expert panel has met to discuss appropriate assumptions for each subsequent round of projections. The panel’s role is to advise only. Responsibility for final decisions on the assumptions remains with ONS and the statistical offices of the devolved administrations.
A note of the 2015 meeting of the expert panel is included in the 2014-based projections October release, in Appendix A of the Background and Methodology paper.
Nôl i'r tabl cynnwys3. Base population and projection period
Population estimates
The projections for England and Wales are based on the mid-2014 population estimates2 that were published on 25 June 2015. The projections for Scotland are based on the mid-2014 population estimates published by National Records Scotland (NRS) on 30 April 2015 and likewise the projections for Northern Ireland are based on the mid-2014 estimates published by Northern Ireland Statistics and Research Agency (NISRA) on 4 June 2015. These estimates are based upon 2011 Census results with allowance for subsequent births, deaths, migration and ageing of the population. The population includes all persons resident, or intending to stay, for 12 months or more. Members of HM armed forces in the UK are included, as are foreign armed forces stationed in the UK. Members of HM armed forces and their families who are abroad are excluded from the population estimates and are treated as migrants when they return home.
In October 2015, National Records of Scotland announced small errors in the mid-year population estimates (MYE) for areas in Scotland. Whilst these errors do not affect the total population of Scotland, or other parts of the UK, they do have a small effect on the age and sex distribution of the population. The impact of these errors is much smaller than the uncertainty around the estimates due to sampling error from the census. NRS will publish corrected MYEs in April 2016.
The 2014-based national population projections are based on the original release of the Scottish MYE in April 2015 and thus do not reflect the correction to the MYE for Scotland used as the base population for the projection. The errors will also have a small effect on the projected age distribution of cross-border migration flows from Scotland to England and Wales. These effects are very small compared to other sources of uncertainty in the projections.
Table 1.1 shows the estimates of the population at mid-2014 upon which the 2014 projections are based.
Table 1.1: Base population estimates for 2014-based projections
| Constituent countries of the UK | thousands |
| England | 54,317 |
| Wales | 3,092 |
| Scotland | 5,348 |
| Northern Ireland | 1,840 |
| UK | 64,597 |
| Source: Office for National Statistics | |
Download this table Table 1.1: Base population estimates for 2014-based projections
.xls (24.6 kB)Estimates of the population aged 90 and over
Official mid-year population estimates produced by the Office for National Statistics (ONS), NRS and NISRA are prepared by individual age to the age of 89, with an upper age band for all those aged 90 and over. Estimates of the population aged 90 to 104 by single year of age and for the 105 and over age group are prepared using the Kannisto Thatcher survivor ratio method3, with the results controlled to agree with the official estimates of all those aged 90 and over. Estimates of the very old4 are published for England and Wales on an annual basis. Scotland has published population estimates of people aged 90 and over5 by single year of age to 105 and over. Northern Ireland has published estimates of the population aged 85 and over6 by single year of age to 105 and over.
Projections period
The main focus of the 2014-based projections is on the next 25 years up to mid-2039, though longer-term projections to mid-2114 are also produced. Long-term figures should be treated with great caution since population projections become increasingly uncertain the further they are carried forward, particularly so for smaller geographical areas and age-sex breakdowns.
For more information on how our population projections meet user needs, along with information on their fitness for purpose, including strengths and limitations, please see the report on quality and methodology7.
Nôl i'r tabl cynnwys4. Methodology
The cohort component method
The projections are made for successive years running from one mid-year to the next using the cohort component method.8 The starting population, taking into account net migration less the number of deaths, produces the number in the population, one year older, at the end of the year. Age is defined as completed years at the last birthday. To this has to be added survivors of those born during the year.
Migration is assumed to occur evenly throughout the year. For computing purposes, this is equivalent to assuming that half the migrants in a given year at a given age migrate at the beginning of the year and half at the end of the year. Therefore, the number of net migrants to be added to obtain the population aged x+1 at the end of the projection year consists of half of those migrating during the year at age x and half of those migrating during the year at age x+1.
The number of deaths in a year is obtained by adding half of the net inward migrants at each age to the number in the population at the beginning of the year and applying the mortality rate qx. The mortality rates (qx) used in the projections represent the probabilities of death between one mid-year and the next, according to a person's age last birthday at the beginning of the period. The appropriate rate of "infant mortality", that is, the probability of a new-born child not surviving until the following mid-year is also given. This is about 85% of the full, first year of life infant mortality rate used in official statistics.
The number of births in the year is calculated by multiplying the average number of women at each single year of age during the year (taken as the mean of the populations at that age at the beginning and end of the year) by the fertility rate applicable to them during that year. The total number of births in a year is assumed to be divided between the sexes in the ratio of 105 males to 100 females, in line with recent experience. The number of infants aged 0 at the end of the year is calculated by taking the projected number of births, deducting the number of deaths (found by applying the infant mortality rate to the projected number of births) and adding half the number of net migrants aged 0 last birthday.
The principal projections are computed for each of the constituent countries of the UK and the results are added together to produce projections for England and Wales, Great Britain and the UK.
The fertility and mortality assumptions have been set using rates based on a consistent series of population estimates which reflect the results of the 2011 Census.
In the 2014-based projections, the method of projecting "cross-border flows" of migration between countries of the UK has changed from being based on assumed absolute levels to being calculated from assumed rates of migration based on an average of estimates for the previous 5 years. This change in methodology is described in full in Chapter 5. International migration assumptions continue to be set as a fixed number of migrants based on historical trends.
Lexis diagram
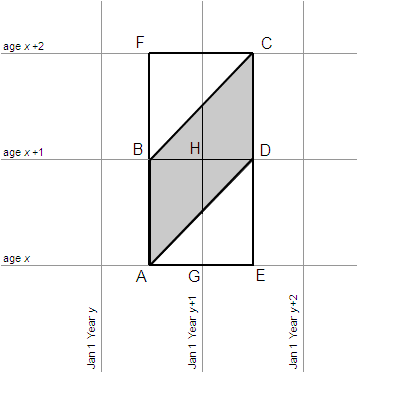
The projection process can be illustrated by means of a Lexis diagram (see Figure 1.1) where age is represented on the vertical axis and time on the horizontal axis. The life of an individual (or of a birth cohort), is represented by a diagonal line (or parallelogram) running from bottom left to top right.
The line AB represents the population aged x at mid-year y. The size of this cohort one year ahead, that is, aged x+1 at mid-year y+1, is represented by the line DC. To calculate this population one year ahead (for x greater than or equal to 0), it is necessary to project deaths and net migration occurring to this cohort between mid-year y and mid-year y+1. The relevant interval of time for this cohort is represented by the shaded parallelogram ABCD.
The net number of migrants aged x between mid-year y and mid-year y+1 is represented by the square ABDE in the Lexis diagram. Similarly, the net number of migrants aged x+1 between mid-year y and mid-year y+1 is represented by the square BFCD.
As noted above, it can be assumed that half the migrants in a given year at a given age migrate at the beginning of the year and half at the end of the year. Thus, of net migrants aged x between mid-year y and mid-year y+1, it can be assumed that half add to the population represented by the line AB in the diagram and the other half to the population represented by the line ED. Similarly, of the migrants aged x+1 in this period, half can be added to the population denoted by the line BF and half to the population represented by the line DC. Net migration in the parallelogram ABCD is therefore obtained by adding half of the net migrants aged x (that is, those adding to the population AB) and half of those aged x+1 (that is, those adding to the population DC) in this interval.
Figure 1.1: Lexis diagram illustrating the calculation of population projections

Source: Office for National Statistics
Download this image Figure 1.1: Lexis diagram illustrating the calculation of population projections
.PNG (10.6 kB)The number of deaths in a year is obtained by adding half of the net inward migrants at each age to the number in the population at the beginning of the year and applying the mortality rate qx. This produces the number of deaths in the parallelogram ABCD. Finally, there is the special case of projecting the number of infants aged 0 at mid-year y+1 as described above. So if x=0, the required population is represented by the line ED and it is therefore necessary to project births, deaths and net migration in the triangle represented by ADE.
The relationship between mx and qx
The mortality rates (qx) are given, for each individual age, in the data tables available on our website. However, in other statistical publications, and in the mortality chapter, mortality rates are often shown as central death rates (mx). These are obtained by dividing the number of deaths during a year at a given age by the average population at that age during the year (usually taken to be the population at the midpoint of the year). The relationship between qx and mx is shown by the following equation:

Note that this equation is an approximation as it assumes deaths occur evenly between exact age x and exact age x+1. It does not hold for infant mortality, as infant deaths are concentrated in the first few months of life.
The qx rates used in the projections are the results of 2 interpolations. The first interpolation takes place between the qx rates for adjacent calendar years and produces rates on a mid-year to mid-year basis. The second interpolation is between adjacent ages and gives a set of qx rates that, in life table terms, relate to exact age x+½ on a mid-year basis. These are assumed to be applicable to the mid-year population at age last birthday.
Nôl i'r tabl cynnwys6. Data availability
Website
Detailed results of the 2014-based national population projections for the UK and its constituent countries are available from our website. The results include the principal and variant projections for each country and a summary of the assumptions upon which they are based.
For each projection, the following datasets can be downloaded in Microsoft Excel format:
- components of change, summary age distributions and dependency ratios
- population in 5 year age groups
The projected population numbers are shown in thousands but stored to 3 decimal places (that is, to unit level). This does not imply that the projections are accurate to that level of detail. Results should always be presented in thousands.
In addition a number of open datasets are available in XML format. These have been published as part of the government’s open data agenda, mainly for modelling purposes. An open dataset is available for each country and variant combination and contains the underlying assumptions and projected figures for the 2014-based national population projections. Each file contains:
- population by single year of age (0 to 104), age groups (105 to 109, 110 and over) and sex
- fertility assumptions by single year of age (15 to 46)
- mortality assumptions by single year of age (0 to 125) and sex
- cross-border rates for each country flow by single year of age (0 to 125) and sex
- births by single year of age of mother (15 to 46)
- deaths by single year of age (0 to 105 and over) and sex
- in, out and net cross-border migration by single year of age (0 to 105 and over) and sex
- in, out and net international migration by single year of age (0 to 105 and over) and sex
- in, out and net total migration by single year of age (0 to 105 and over) and sex
For the principal projection, figures cover the period mid-2014 to mid-2114. For the variant projections, files contain projected figures to mid-2039. Variant projections up to 100 years ahead can be requested from the Population Projections Unit.
The interactive population pyramids18 allow you to analyse the age structure of the population more easily. By animating the graph, you can compare the alternative projections and show how the population structure is projected to change over time.
An interactive article19 “How big will the UK population be in 25 years time?”, allows you to view trends in the principal and variant projections graphically to mid-2039.
Period and cohort life expectancy data20 derived from historic mortality rates (from 1981 to 2014) and assumed calendar year mortality rates from the 2014-based national population projections are also available on our website.
Further information
Further information about the national population projections may be obtained from the Office for National Statistics, Population Projections Unit, Population Statistics Division, Segensworth Road, Titchfield, Fareham, Hampshire PO15 5RR.
Telephone: +44 (0) 1329 444652
E-mail: projections@ons.gov.uk
Nôl i'r tabl cynnwys