1. Main figures
There were an estimated 2.8 million internal migration moves into local authorities in England and Wales in the year ending June 2012; this includes moves from other local authorities in England and Wales, as well as moves from Northern Ireland and Scotland
The peak age for internal migration was 19 with approximately 23% of 19-year-olds living in England and Wales in mid-2012 having moved there from another local authority in the UK during the previous year
Net migration had the biggest impact in the London region with an estimated 52,000 more migrants leaving the region than arriving. Yorkshire and The Humber had the smallest regional net migration with an estimated 2,200 more internal migrants leaving than arriving
The largest local authority flows (both inflows and outflows) were shown to be for Birmingham. An estimated number of 42,300 people moved into Birmingham and 45,500 people moved out
2. Output details
This bulletin contains the latest estimates of internal migration for England and Wales for year ending June 2012 which incorporate a new method that better captures the migration of students.
Internal migration is defined as residential moves between different local authorities in the UK. It does not include moves within a single local authority, and also excludes any international moves into or out of the UK.
The outputs provide estimates of internal migration broken down by age and sex at country, region and local authority level for England and Wales. They are published on an annual basis, usually around 12 months after the end of the migration period and are timed to coincide with the publication of the mid-year population estimates. A downloadable data file is also released that includes records of estimated internal migration moves by age and sex between local authorities in England and Wales. The dataset also includes moves, in both directions, between local authorities in England and Wales, and Scotland and Northern Ireland.
The estimates are produced using a combination of administrative data and currently represent the best available source of information on internal migration in England and Wales. A change to the methods used to estimate the migration of students has been introduced in this release. The improvement has been made by linking data sources to better reflect student migration. A detailed description of this new methodology (44.4 Kb Pdf) was published last November (2012).
As well as being of interest to the media and the general public, internal migration estimates are used for planning by Government and local government. Internal migration is a key component of population change and is used in the production of mid year population estimates and sub-national population projections. Academia and special interest groups use the estimates as inputs to their own population models.
This bulletin presents statistics on levels and patterns of internal migration in England and Wales and between its regions and local authorities, and also looks at international comparisons.
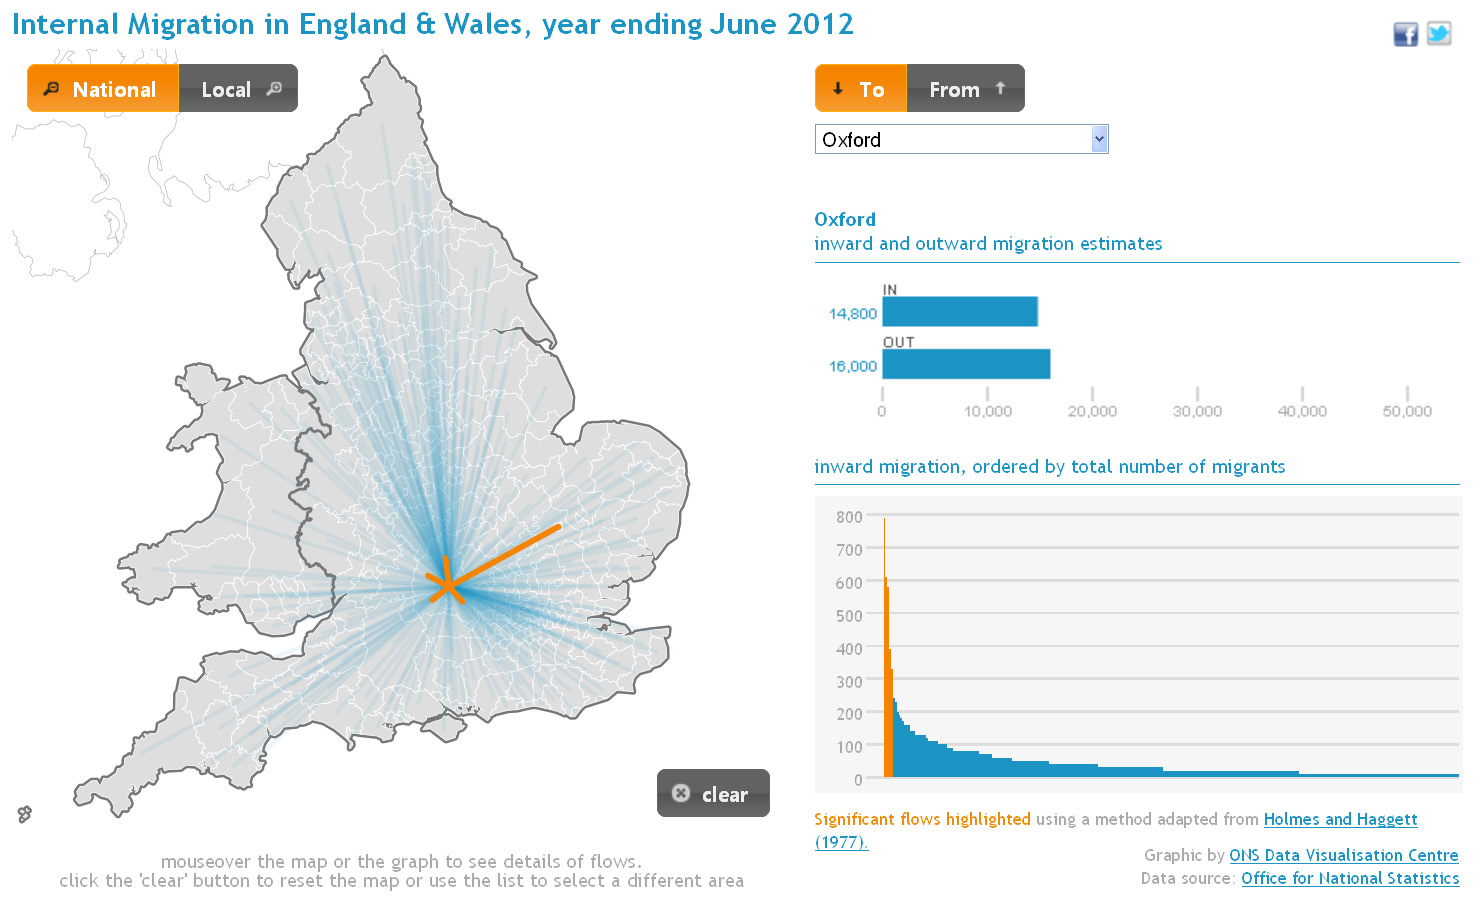
To accompany this release, ONS are presenting an interactive map of internal migration flows for England and Wales. The map can be used to visualise the flows between selected local authorities and also displays levels of inflows and outflow of internal migrants to a particular area.
Nôl i'r tabl cynnwys3. Overall levels of internal migration
For the year ending June 2012, there were an estimated 2.8 million internal migration moves into local authorities in England and Wales. This is 8% higher than in the year ending June 2011. This change is likely to be linked to the improvements in estimating internal migration moves made by students. To better understand the impact of the new methodologies ONS intends to re-estimate the equivalent internal migration estimates for the years ending mid-2009 to mid-2011 and publish the outputs in a research paper.
Figure 1, shows the pattern of internal migration moves over the last decade. 2012 has the highest level of internal migration moves over this period. However the new methodology is likely to be a key factor in this.
Figure 1: Internal migration moves for England and Wales (mid-2003 to mid-2012)
Source: Office for National Statistics
Download this chart Figure 1: Internal migration moves for England and Wales (mid-2003 to mid-2012)
Image .csv .xlsFigure 2 shows the age distribution of all moves into local authorities in England and Wales in the year ending June 2012 as a proportion of mid-2012 population estimates. Young adults were the most likely to migrate. Almost 1 in 4 of those living in England and Wales in mid-2012 aged 19 had moved from a different local authority in the UK during the previous year; this constitutes around 6% of all moves in the year ending mid-2012. Age 19 was the peak age of moves for both males and females. Another peak can be seen in those aged 22, with 15% of all 22 year olds in mid-2012 having moved from a different local authority.
Compared with the year ending mid-2011, the number of moves by 19 year olds in the year ending mid-2012 was 15,000 (10%) higher and the number of moves by 22 year olds was 8,000 (7%) lower. The change may be linked to the introduction of the new method used to capture internal migration moves made by students.
Figure 2: Proportion of England and Wales population, by age, who had moved local authority within the UK during the year ending June 2012
Source: Office for National Statistics
Download this chart Figure 2: Proportion of England and Wales population, by age, who had moved local authority within the UK during the year ending June 2012
Image .csv .xls4. Regional level moves
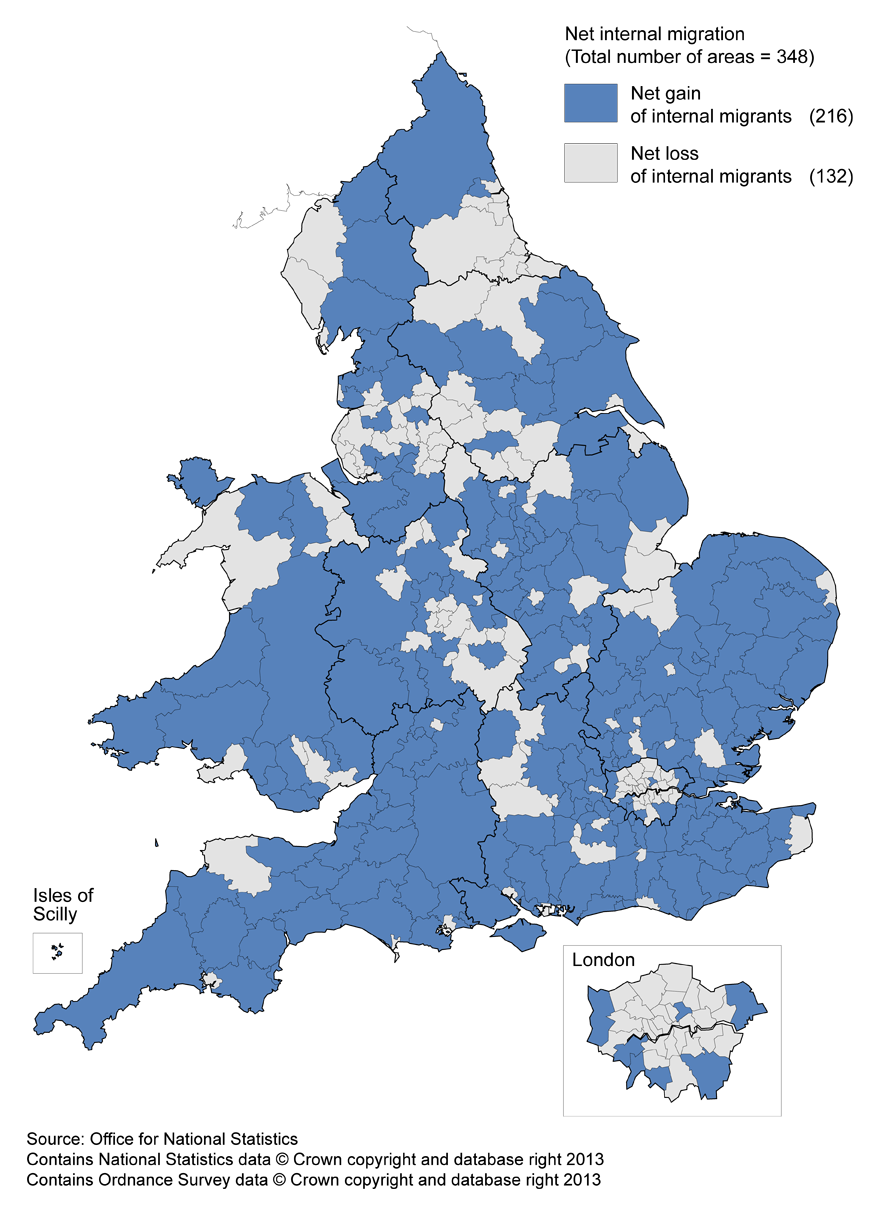
Figure 3 shows net regional flows for the year ending June 2012. The figures show the London region had the largest net difference with an estimated 52,000 more migrants leaving than arriving. The London region also had the largest turnover of internal migrants in England and Wales with 203,000 estimated moves into the region and 255,000 estimated moves out of the region.
London is an interesting region within England and Wales; whilst its population continues to rise as a result of net international migration, it remains the region with the largest net outflow of internal migrants. In the year ending June 2012, the net outflow for the London region was approximately 10,000 higher than in the previous year.
The Yorkshire and The Humber region had the smallest net difference with an estimated 2,200 more migrants leaving the region than arriving. In terms of regional population gains due to internal migration, the South East region had the largest positive net difference with an estimated 24,300 more migrants arriving then leaving; this represented around 0.3% of its mid-2012 population estimate.
Figure 3: Regional level net internal migration moves, year ending June 2012
Source: Office for National Statistics
Download this chart Figure 3: Regional level net internal migration moves, year ending June 2012
Image .csv .xlsWhen comparing the net changes for regions in England and discounting the London region, there is a noticeable difference between the regions in the south and east when compared with those in the north. The general trend is for more people to arrive than leave for the regions in the south and east, whereas for the more northern regions, the net flows show that more people are leaving than arriving.
In total, Wales had an estimated net gain of 4,400 internal migrants for the year ending June 2012; this constitutes 0.14% of the mid-2012 population. More people moved to Wales from the regions in England than left, apart from London where approximately 670 more people moved out of Wales than arrived.
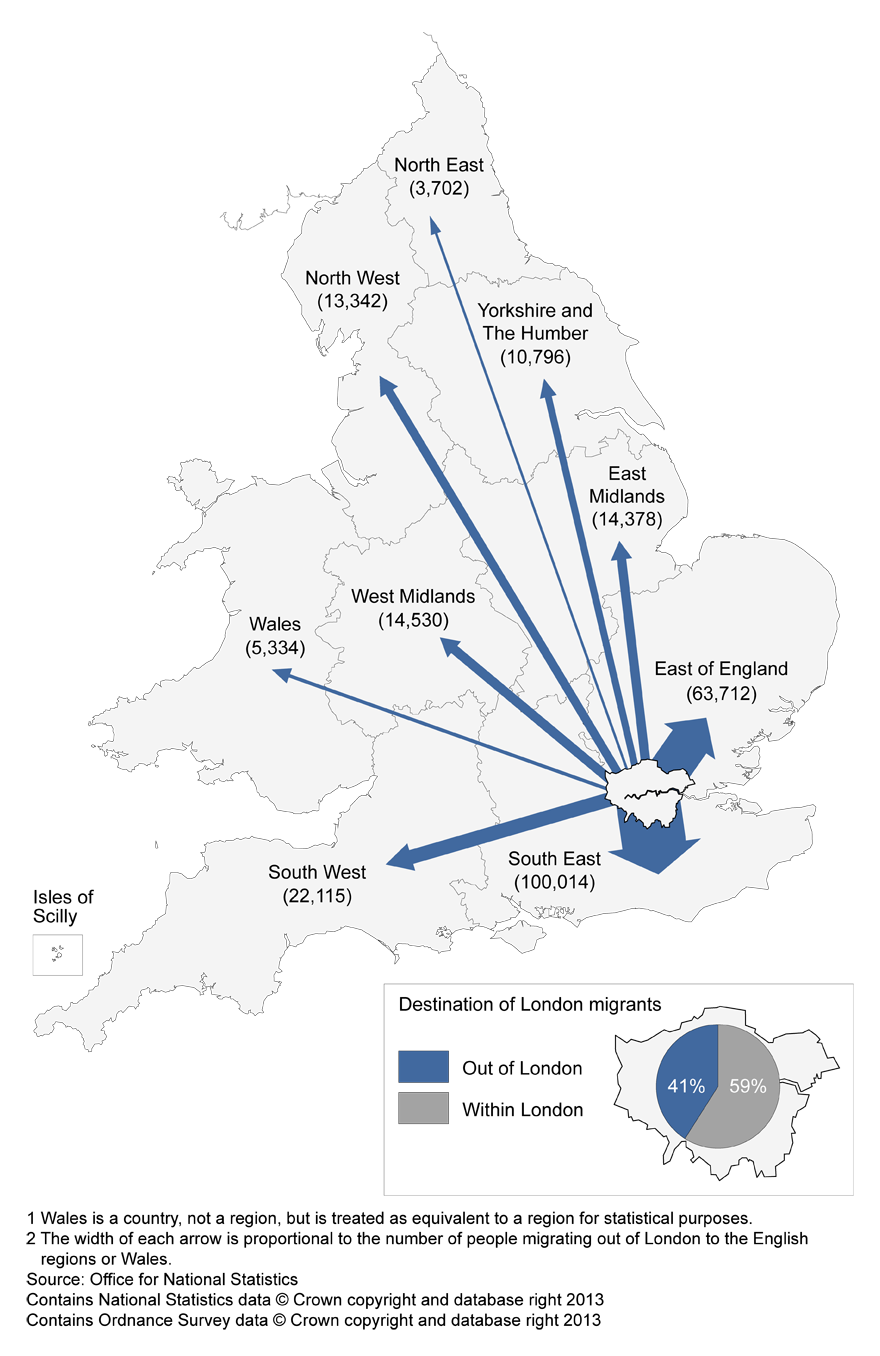
As Figure 4 shows, for the year ending June 2012 a total of 59% of all internal moves out of local authorities in London were to elsewhere in the London region, while the other 41% of internal migrants moved to other regions in England and to Wales. Moves out of London in mid-2012 were mostly to the neighbouring regions of the South East and the East of England. The South East region was the destination for around 40% of the moves out of London and within this figure approximately 6 out of 10 of these movers were aged between 16 and 44.
Figure 4: Flows from London to regions in England and Wales, mid-2012

Source: Office for National Statistics
Download this image Figure 4: Flows from London to regions in England and Wales, mid-2012
.png (277.0 kB)6. International comparisons
The 2001 data covering internal migration previously published by Eurostat suggested the UK had relatively high rates of internal migration compared with other EU countries, with about 3.5% of the UK population moving between NUTS3 areas in that year. Caution should be taken when making international comparisons due to differences in geographies and definitions. The magnitude and patterns of internal migration remain poorly documented in many countries, particularly in the developing world, due to the lack of sufficiently detailed source datasets being collected on a consistent basis.
Nôl i'r tabl cynnwys7. Using the estimates
As there is no single system to record population movements within England and Wales, internal migration estimates must be derived from proxy sources. Three administrative data sources are used, namely the National Health Service Central Register (NHSCR), the Patient Register Data System (PRDS) and the Higher Education Statistics Agency (HESA) data. Overall, the accuracy of NHS-based data depends on patients re-registering with a new doctor when they change residence or informing their current GP of any change of residential address. It is known that re-registration rates vary by sex and age group. Despite some limitations, research has shown that there is no one other available source that has as good coverage and quality as the combinations of these data sources. Detailed information on the methodology and limitations are available on the ONS website in a Quality Methodology Information Document (194.3 Kb Pdf). (Please note this document is due for revision to reflect the methodological changes as part of the estimation of internal migration by students).
The combination of data sources ensures that the majority of moves are covered for England and Wales. Given that not all moves are covered, there will be some error around these estimates to the level of detail supplied in the tables. However, it would be appropriate to treat the estimates as reliable when calculating population estimates for a local authority or when assessing whether internal migration for a particular local authority has risen or fallen over time.
To further improve estimation of student migration within England and Wales, methodological changes to implement an additional adjustment for students based on HESA data have been introduced to the year ending mid-2012 estimates. It is important to note that internal migration estimates for the years prior to the year ending mid-2012 have not been adjusted for students using the revised methodologies. Information covering the new student adjustment method was published on the ONS website in November 2012 and is available in an Information Note (44.4 Kb Pdf).
Further information on how to use the Internal Migration estimates is available from the following Estimating Internal Migration Customer Guidance Notes - November 2012.
Nôl i'r tabl cynnwys8. Data visualisation of internal migration flows in England and Wales
Figure 6 includes an example snapshot from the interactive map that accompanies this release. This tool can be used to reveal patterns of internal migration for specific local authority areas and an example is available showing the internal migration flow from Oxford to Cambridge.
The visualisation uses over 60,000 internal migration flows with the statistically significant flows to and from each local authority being highlighted in orange.
The interactive output of internal migration flows for England and Wales using the mid-2012 data release is available on the ONS website as an interactive map.
Internal Migration in England and Wales, year ending 2012 interactive map


