1. Main points
Estimates from the Annual Population Survey show that an average of 2.2 million people worked in the construction industry between 2014 and 2016 accounting for 7% of workers across all industries in the UK.
7% of workers in the construction industry in the UK are EU27 nationals and 3% are non-EU – compared with all other industries in the UK (excluding construction) – 6% EU27 nationals and 4% non-EU nationals.
In London, 28% of construction workers are EU27 nationals and 7% are non-EU nationals; this compares to 13% who are EU27 nationals and 10% non-EU nationals for all other industries in London (excluding construction).
Of the 165,000 EU27 nationals working in construction, it is estimated 49% are EU8 nationals, 29% EU2 nationals, 11% EU15, 10% Irish nationals and the remainder EU other; compared to EU27 nationals working in all other industries (excluding construction) 47% are EU8 nationals, 9% EU2 nationals, 35% EU15 nationals, 8% Irish nationals and the remainder EU other.
The construction workforce is ageing, there was a 13% increase in the numbers of workers aged 45 years and over in the construction industry between 1991 and 2011, but non-UK nationals are younger (18% aged 45 years and older) compared to UK nationals (47% aged 45 years and older).
41% of those working in construction were self-employed between 2014 and 2016; EU8 (63%) and EU2 nationals (66%) in the construction industry are more likely to be self-employed compared to all other nationalities (39%).
33% of the resident non-UK nationals who work in construction occupations in the UK work in general labour.
The construction sector is very flexible but fragmented, which makes gathering data on the workforce intrinsically difficult; further work is needed to build a comprehensive evidence base of the skills and skill gaps within the industry.
2. Introduction
There is widespread demand for more information on the impact migrants have in the UK, including the sectors in which they work. Approximately 10% of workers in the UK construction industry are non-UK citizens; 7% are from EU27 countries and 3% from non-EU countries. This can be compared to the figures for all industries, excluding construction, 10% being non-UK nationals and 6% from EU27 countries and 4% non-EU nationals.
This article uses official data sources to look at the current composition of the overall construction contracting labour market in the UK. This includes looking at how the workforce is ageing, the concentration of workers in London and the South East, high levels of self-employment, and an occupational breakdown in the industry with a focus on how these characteristics differ between UK and non-UK nationals.
In putting together this article we discovered substantial user need to understand variation within the construction industry across regions and constituent countries of the UK and variation across sub-sectors within the industry which could not be met within the timescales of this article. We will therefore publish a follow-up article with this information in August 2018.
To provide detailed information of the characteristics of those in the UK construction industry, this article analyses data from the Annual Population Survey (APS) three-year-pooled dataset for the UK. The Office for National Statistics has combined the data from 2014, 2015 and 2016 into a three-year average from January 2014 to December 2016 to allow more robust analysis at lower level geographies, which isn’t always possible using the single year APS dataset. The data shows respondents who were counted in the construction industry at the time they were surveyed – it doesn’t measure how long they were in the industry within the year the survey related to.
In addition, this report uses data from the ONS Longitudinal Study (LS) which is a 1% sample of England and Wales, based on four birth dates, collected at each census since 1971. The LS is the largest longitudinal data source in England and Wales. The LS is updated on an annual basis with life events such as births, deaths, immigrations and emigrations. The ONS LS is used to identify long-term trends in the construction industry and allows insight into transitions into and out of the construction industry.
The construction sector is very flexible but fragmented, which makes gathering data about the industry intrinsically difficult. Therefore, this article also considers improvements needed to data to further address user need.
Nôl i'r tabl cynnwys3. Things you need to know about this report
Definitions
Construction industry
The construction industry in this report refers to the construction of buildings of all kinds, sometimes referred to as “construction contracting” to distinguish it from “construction products” and “construction services”. This encompasses sectors 41, 42 and 43 within the Standard Industrial Classification (SIC) codes (2007), covering three main sub-sectors in the construction industry:
41 – Construction of buildings includes the development of buildings, residential and non-residential buildings, commercial buildings and domestic buildings. Residential and domestic buildings commonly referred to as home building
42 – Civil Engineering includes construction of roads, railways, motorways, bridges, tunnels, utility projects and water projects. This is also referred to as the infrastructure sub-sector
43 – Specialized construction activities include demolition and site preparation, completion and finishing activities, electrical, plumbing and other installation activities
This excludes sectors in other services such as 71.1 “Architectural and engineering activities and related technical consulting” and 74.90/2 “Quantity surveying activities”.
Migrant
It is important to note that the data sources in this report use two definitions of a migrant. When considering statistics about migrants in the labour market, nationality is the preferred definition as it reflects someone’s right to work and access services in the UK. Nationality is used to identify migrants using the Annual Population Survey (APS) and Country of birth is used to identify migrants using the ONS Longitudinal Study (LS) as someone’s Nationality was not asked until the 2011 Census. People who were born abroad may have obtained British citizenship since their arrival in the UK and cannot be considered foreign in the APS analysis, although the LS data may still identify them as foreign-born. This is a significant factor for workers born outside the EU but much less for those from another EU country. This may also impact those people born in Northern Ireland but who within the Annual Population Survey have reported as Irish. Where possible analysis has been split to show Irish separate from other EU countries as due to this classification of nationality, it is possible that some UK citizens may be captured under Irish nationality. Differences in the use of these two definitions are fully explained in the January 2017 report, What information is there on British migrants living in Europe?
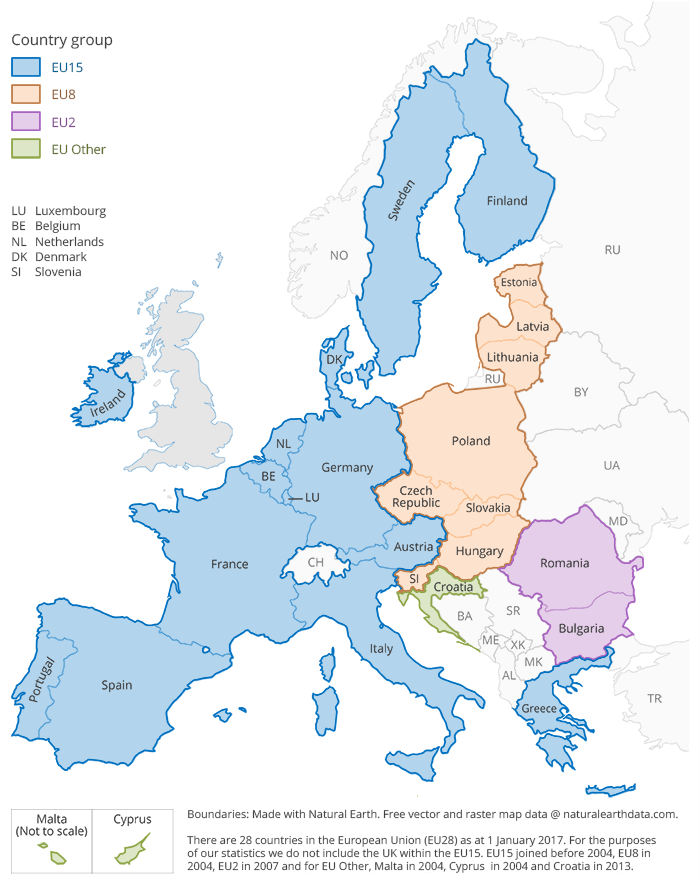
EU country groupings used in this report
Figure 1 shows the EU country groupings that have been used in this report.
Due to the large numbers of Irish nationals working in the UK construction industry there is a strong user need for Irish nationals to be included in EU totals in this report. It is noted that Irish nationals are subject not only to EU legislation but as nationals of the Common Travel Area they have rights to live and work in the UK. It is not possible, due to sample sizes, to provide a breakdown of the characteristics of Irish nationals in the construction industry separately from EU nationals although where possible it has been done for high level figures.
EU2
Refers to Romania and Bulgaria; two countries that joined the EU on 1 January 2007. Between 2007 and 2013, EU2 nationals had certain restrictions placed on them; generally, they could work as self-employed workers but not as employees. These restrictions were lifted on 1 January 2014.
EU8
Refers to Poland, Lithuania, Czech Republic, Hungary, Slovakia, Slovenia, Estonia and Latvia joined the European Union at the same time (2004).
EU15
Refers to Austria, Belgium, Denmark, Finland, France, Germany, Greece, Ireland, Italy, Luxembourg, Netherlands, Portugal, Spain, Sweden and the UK.
EU27
Refers to Austria, Belgium, Bulgaria, Croatia, Cyprus, Czech Republic, Denmark, Estonia, Finland, France, Germany, Greece, Hungary, Ireland, Italy, Latvia, Lithuania, Luxembourg, Malta, Netherlands, Poland, Portugal, Romania, Slovakia, Slovenia, Spain and Sweden. This group does not include the UK.
EEA
The European Economic Area (EEA) includes all EU countries and also Iceland, Liechtenstein and Norway allowing them to be part of EU’s single market.
Figure 1: EU groupings used within UK migration statistics, 2018
Download this image Figure 1: EU groupings used within UK migration statistics, 2018
.png (189.3 kB)
4. Characteristics of those in the construction industry
To provide detailed information on the characteristics of people working in the construction industry, we have chosen to use Annual Population Survey (APS) data, averaged over a three-year period, from 2014 to 2016.
The APS estimates that there were 2,224,000 people whose main job was in the construction industry from 2014 to 2016 accounting for 7% of workers of all industries in the UK.
Non-UK nationals in the construction industry
Non-UK nationals currently make up a large minority of the resident workforce in the construction sector, their share varies across industry sub sectors and has increased over time.
Of UK residents employed in the construction industry, the Annual Population Survey estimates that 90% (2,010,000) were UK nationals between 2014 and 2016, 7% (165,000) from another EU country (including Ireland) and the remainder non-EU nationals (49,000). Of UK residents employed in another industry, excluding construction, 90% were UK nationals between 2014 and 2016, 6% from another EU country and the remainder were non-EU nationals.
The APS uses a nationality definition to identify a resident’s citizenship. This is considered to be the most useful in identifying those who may be most likely to be affected by UK’s decision to leave the EU as nationality reflects someone’s right to work and access services in the UK.
Of the 165,000 EU27 nationals working in construction, it is estimated 49% (80,000) are EU8 nationals, 29% (48,000) EU2 nationals, 11% (19,000) EU15, 10% (16,000) Irish nationals and the remainder EU other. Compared to EU27 nationals working in all other industries, excluding construction, 47% are EU8 nationals, 9% EU2 nationals, 35% EU15 nationals, 8% Irish nationals and the remainder EU other.
9% of all employed EU8 nationals living in the UK, between 2014 to 2016, worked in construction, and 22% of all EU2 nationals.
The ONS Longitudinal Study (LS) shows an increasing share of non-UK born workers in the construction industry across time in England and Wales. In the 1991 and 2001 Census non-UK born workers comprised 6% of the workforce. This increased to 11% by 2011. The expansion of the EU in 2004 and 2007 and the availability of skilled trades may have contributed to this increase.
Age of the workforce
The Annual Population Survey estimates that 44% of residents working in construction were aged 45 years and over between 2014 to 2016. This is similar to the whole population of the UK who are in employment with an estimated 43% of the resident workforce aged 45 and over.
The age distributions of UK versus non-UK workers (Figure 2) shows that there is a greater proportion of UK nationals working in construction who were aged 45 and older (47%) when compared to the age distribution of non-UK workers (18%) in the same sector.
Figure 2: Age distribution of those working in the construction industry by nationality grouping, 2014 to 2016
Source: Annual Population Survey (three-year pooled dataset 2014 to 2016)
Download this chart Figure 2: Age distribution of those working in the construction industry by nationality grouping, 2014 to 2016
Image .csv .xlsThe UK-born workforce is older than it has been in the past
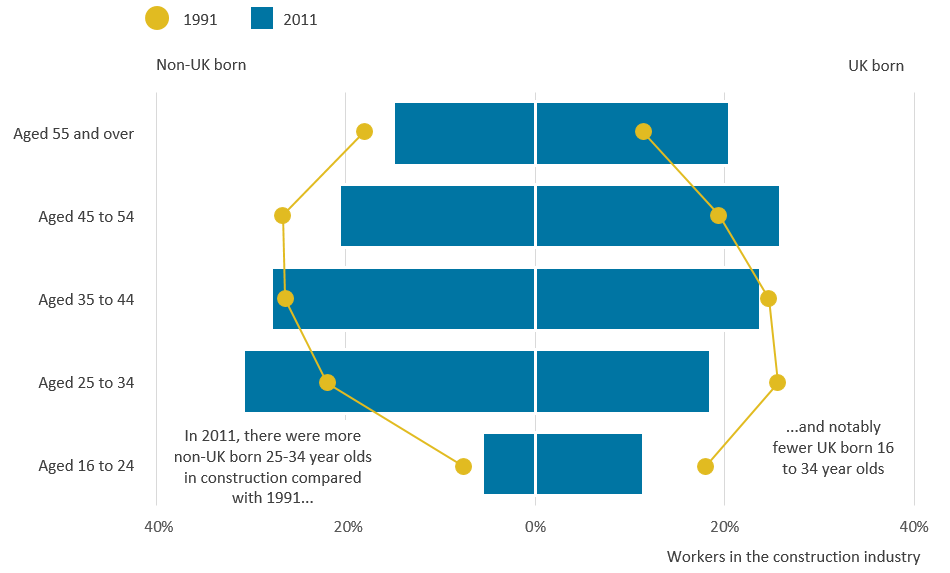
The ONS Longitudinal Study (LS) shows how the construction workforce, in England and Wales, has aged between 1991 and 2011.
Construction workers from the 1991 Census have the youngest age profile; 43% of the workforce were aged between 16 and 34, this declined to 33% in the 2001 Census and then 31% in the 2011 Census. The 2011 Census shows more workers aged over 45 than previous censuses (45%), which is higher than in 1991 (32%).
Of the construction workers from the 1991 Census who were present in the LS at the 2011 Census, approximately 26% had retired (compared to 32% who retired in this time frame in all other industries).
Figure 3 shows the distribution of the ages of UK-born and non-UK born construction workers at each Census. There is a clear trend of an ageing workforce for UK-born construction workers. In comparison, there are proportionally more construction workers in younger age groups for non-UK-born workers.
Figure 3: The age distribution of the construction workforce, by country of birth, at the 1991, and 2011 Census
Source: ONS Longitudinal Study
Notes:
The title for figure 3 was updated on 19 June 2018 to read 'by country of birth' rather than 'by nationality'.
Download this image Figure 3: The age distribution of the construction workforce, by country of birth, at the 1991, and 2011 Census
.PNG (32.5 kB) .xls (36.4 kB)
In 2011, it is estimated that one in every five UK-born construction workers are aged 55 and over meaning by 2021 these people will have nearly reached retirement age.
Currently, there is no known data source that can robustly estimate entrants and leavers to the workforce by industry. Having this data would allow a better understanding of the ageing population, particularly to understand if new entrants are joining the construction industry.
Region
The construction workforce is not equally distributed across the country.
The Annual Population Survey estimates that London and the South East have the highest proportion of resident construction workers in the UK, accounting for 16% and 15% of the workforce respectively. London and the South East also have the highest proportion of resident workers in the UK across all other industries, excluding construction, 16% and 14% of the workforce respectively.
While 7% of the construction industry are estimated to be EU nationals (excluding UK nationals), the APS estimates that 28% of construction workers in London are EU nationals and a further 7% are non-EU nationals (based on region of workplace). In comparison, the APS estimates that 13% of workers in London, across all other industries (excluding construction), are EU nationals and a further 10% are non-EU nationals.
It is estimated that 2% of the construction industry in the UK are accounted for by non-EU nationals (figure 4).
The South East also has a greater proportion of non-UK workers (7%) compared to the rest of the UK (4%).
Figure 4: Region of workplace of those working in the construction industry by nationality, 2014 to 2016
Source: Annual Population Survey (three-year pooled dataset 2014 to 2016)
Notes:
- Elsewhere includes the rest of the UK and workplaces outside the UK.
Download this chart Figure 4: Region of workplace of those working in the construction industry by nationality, 2014 to 2016
Image .csv .xlsSelf-employment
An estimated 41% of residents working in construction were self-employed1 between 2014 and 2016. This is high in comparison to other industries in which an estimated 15% were self-employed. Those who are self-employed in construction represent 20% of total self-employment in the UK.
The level of self-employment varies by nationality. Figure 5 shows EU8 nationals and EU2 nationals were more likely to be self-employed than the other nationalities.
For EU2 nationals, it was possible to work in the UK as a self-employed worker from accession in 2007. They could only be employees from 2014 when restrictions on access to the labour market were lifted.
EU8 nationals were not subject to any restrictions when the EU8 countries joined the EU in 2004.
Figure 5: Employment of construction workers in the UK by employed or self-employed and nationality grouping, 2014 to 2016
Source: Annual Population Survey (three-year pooled dataset, 2014-2016)
Notes:
- Employed includes those on a government employment and training program and also those who were unpaid family workers.
Download this chart Figure 5: Employment of construction workers in the UK by employed or self-employed and nationality grouping, 2014 to 2016
Image .csv .xlsHours worked
Annual data from the Annual Population Survey estimates that between 2004 and 2016 a UK national working in the construction industry worked on average 38 hours per week excluding any over-time.
In contrast, EEA nationals in the construction industry worked on average 41 hours per week excluding any over-time, whilst nationals from the rest of the world worked on average 37 hours per week excluding any over-time. This will be affected by many factors, for example, EEA workers are on average younger and so may not have caring responsibilities, and they may have come to the UK specifically to work.
Occupations of UK and non-UK nationals within the construction industry
Figure 6 shows 33% of resident non-UK nationals who work in the construction occupations work in general labour2.
Figure 6: Detailed occupational groupings within the construction industry by nationality, 2014 to 2016
Source: Annual Population Survey, three-year pooled dataset 2014 to 2016
Download this chart Figure 6: Detailed occupational groupings within the construction industry by nationality, 2014 to 2016
Image .csv .xlsThe Annual Population Survey estimates that the most common occupation for EU8 nationals employed in the construction industry was the general non-specific construction and building trades, 22,000, accounting for 11% of all workers in this occupation. In addition, there are 12,000 EU8 workers who are carpenters and joiners accounting for 6% of all workers in this trade.
Industry movements – where do workers enter and leave?
The ONS Longitudinal Study provides a useful insight to long-term trends of movement of those in the industry in England and Wales. These long-term trends can be identified for LS members who are present and resident in England and Wales at more than once Census point between 1991 and 2011.
Of those employed in the construction industry in 1991 who were still resident in England and Wales in 2011, 66% were still in employment, 26% had retired and the remainder were either students, looking after home or family or long-term sick. Approximately 55% of resident construction workers in 1991, who were still in employment by the 2011 Census, remained in the construction industry. A common industry for 1991 construction workers to move to in the 2011 census was the manufacturing industry (9%).
There were 21,000 LS members working in the construction Industry in 2011 of these 19% (4,000) were not present at the 1991 Census, it is likely that these people have since entered the workforce through migration. Of the LS members employed in the construction industry in 2011, who were also present in 1991, 59% (10,000) were previously employed in the 1991 Census. Of the remaining 41% (7,000), 30% (5,000) were not of working age at the 1991 Census and the remaining 11% (2,000) were students, looking after home or family or long-term sick. Of the 10,000 construction workers present in 2011 who were in employment in 1991, 48% (5,000) were working in the construction industry in 1991 (11% (1,000) were working in Distribution, Hotels and catering, 8% (800) in manufacturing industries).
Notes for: Characteristics of those in the construction industry
Employment status is self-reported so whilst people may consider themselves as self-employed they may get paid as employees for jobs they do so might not be self-employed in terms of tax definitions.
Occupational groupings have been created from using ONS Standard Occupational Classification (SOC) hierarchy. The numbers assigned to each occupational group can be found in Annex 1.
5. What changes could be made to improve data about the construction industry?
The construction sector is very flexible and fragmented, which means that a greater level of detail than that currently provided by official data sources would be useful for users who often have responsibility for sub-sectors or occupations. The flexible and fragmented nature of the industry also makes gathering data intrinsically difficult. There are a variety of data sources collected from trade bodies which provide information on sub-sectors within the construction industry. Co-ordinating such data might support the development of a comprehensive and up to date picture of the construction workforce.
Detailed information on the existing workforce, and their skills, along with the number of people entering the workforce and their qualifications and skills, is necessary to understand what is needed to meet the housing and infrastructure construction demand. Collaboration of organisations to create a comprehensive and up-to-date picture of the construction workforce could also support an understanding of the supply and demand of skills in the construction industry.
To gain a comprehensive view of geographic variation of UK’s construction workforce, there is a need for co-ordination across devolved administrations.
For the construction industry, and for many other industries, it would be useful to understand more about how all people, including different types of migrants, move around the labour market. In theory, some occupations provide an access point to the labour market, in which a worker acquires skills, knowledge and qualifications which enable them to move onto a better-paid occupation. Again, in theory, such entry level occupations would require a constant feed of new workers. To understand how this works would require a longitudinal dataset that can identify changes in occupation. This isn’t currently possible in survey data, but is an aim for future administrative data sources.
One government administrative data sources currently being investigated, which may offer some insights into construction workers, is HMRC Pay As You Earn Real Time Information and HMRC self-assessment data. The plan for the development of administrative data is continuously under review to stay responsive to changing priorities for evidence on different aspects of international migration. Further information can be found in our Migration statistics transformation update.
Nôl i'r tabl cynnwys6. Annex 1: Occupation definitions
ONS Standard Occupation Classification (SOC) Hierarchy has been used. The numbers assigned to each occupation enable the hierarchical grouping of professions. For further information on this hierarchy, please see the ONS occupation coding tool.
Annex 1: Occupational groupings based from the homebuilders report
| Occupation group | Occupation codes |
|---|---|
| General labour | 5319 'Construction and building trades ' |
| 9120 'Elementary construction occupations' | |
| 4159 'Other administrative occupations ' | |
| 8149 'Construction operatives ' | |
| Carpentry | 5315 'Carpenters and joiners' |
| Finishing trades | 5321 ‘Plasterers’ |
| 5323 ‘Painters and decorators’ | |
| 5422 ‘Floorers and wall tilers’ | |
| Demolition, groundworks, frames | 8229 ‘Mobile machine drivers and operatives’ |
| 8141 ‘Scaffolders, stagers and riggers’ | |
| 8142 'Road construction operatives' | |
| 8143 'Rail construction and maintenance operatives' | |
| 5311 'Steel erectors' | |
| 8221 'Crane drivers' | |
| 5213 'Sheet metal workers' | |
| 5215 'Welding trades' | |
| Roofing | 5313 'Roofers, roof tilers and slaters' |
| Management and professional | 1122 'Production managers and directors in construction' |
| 2436 'Construction project managers and related professionals' | |
| 2121 'Civil engineers' | |
| 2433 'Quantity surveyors' | |
| 3545 'Sales accounts and business development managers' | |
| 1131 'Financial managers and directors' | |
| 2434 'Chartered surveyors' | |
| 3122 'Draughtspersons' | |
| 3541 'Buyers and procurement officers' | |
| 2431 'Architects' | |
| 3113 'Engineering technicians' | |
| 2122 'Mechanical engineers' | |
| 2126 'Design and development engineers' | |
| 3121 'Architectural and town planning technicians' | |
| 2461 'Quality control and planning engineers' | |
| 2435 'Chartered architectural technologists' | |
| 3114 'Building and civil engineering technicians' | |
| 2129 'Engineering professionals ' | |
| 3531 'Estimators, valuers and assessors' | |
| 2462 'Quality assurance and regulatory professionals' | |
| 5330 'Construction and building trades supervisors' | |
| Electrical | 5316 'Glaziers, window fabricators and fitters' |
| 5249 'Electrical and electronic trades ' | |
| 5250 'Skilled metal, electrical and electronic.’ trades supervisors' | |
| 5442 'Furniture makers and other craft woodworkers' | |
| 5225 'Air-conditioning and refrigeration engineers' | |
| 2123 'Electrical engineers' | |
| 3112 'Electrical and electronics technicians' | |
| 5241 'Electricians and electrical fitters' | |
| Plumbing | 5314 'Plumbers and heating and ventilating engineers' |
| 5216 'Pipe fitters' | |
| Brickwork | 5312 'Bricklayers and masons' |
| Source: Office for National Statistics Standard Occupation Classification (SOC) | |