Cynnwys
- Main points
- Summary of migrant labour in the UK’s construction industry: August 2018
- Introduction
- Things you need to know about this release
- Considering regional and the UK’s constituent country variation of migrant labour in the construction industry
- Contribution of migrants across sub-sectors of the construction industry
- Next steps
- What other information is available?
- Annex: UK Standard Industrial Classification 2007 summary structure for construction sub-sectors
1. Main points
There were 2.2 million UK residents working in the construction industry between 2014 and 2016; 47% (1,053,000) worked in the specialised construction activities sub-sector, 37% (832,000) worked in the construction of buildings sub-sector and the remaining 15% (339,000) worked in the civil engineering sub-sector.
Non-UK nationals accounted for 8% (80,000) of all workers in the UK’s specialised construction activities sub-sector and 7% (25,000) of all workers in the UK’s civil engineering sub-sector.
Non-UK nationals accounted for 13% (109,000) of workers in the UK’s construction of buildings sub-sector: 8% were EU8 and EU2 nationals, 3% non-EU nationals and 2% EU15 and EU Other nationals (excluding the UK).
A greater proportion of all UK residents working in the construction of buildings sub-sector worked in London (21%) compared with the rest of the construction industry (13%).
Non-UK nationals accounted for 40% (70,000) of the construction of buildings workforce in London; 28% were EU8 and EU2 nationals, 8% were non-EU nationals and the remaining 5% were from the rest of the EU.
From the 2011 Census
- Non-UK-born construction workers accounted for 10% (224,000) of the construction workforce in the UK; this varied across constituent countries whereby non-UK-born construction workers accounted for 11% (208,000) of the construction workforce in England, 3% (3,000) for Wales, 4% (9,000) for Scotland and 5% (3,000) for Northern Ireland.
2. Summary of migrant labour in the UK’s construction industry: August 2018
Table 1 shows the latest official estimates of the UK’s construction workforce by UK constituent country. For further information on this, please refer to Section 5 of the report.
Table 1: UK’s construction workforce by UK constituent country and country of birth, 2011
| Thousands | ||||||
| England (%) | Wales (%) | Scotland (%) | Northern Ireland (%) | |||
|---|---|---|---|---|---|---|
| All residents | 1,873 (100) | 108 (100) | 195 (100) | 63 (100) | ||
| UK-born | 1,665 (89) | 105 (97) | 187 (96) | 60 (95) | ||
| Non- UK-born | 208 (11) | 3 (3) | 9 (4) | 3 (5) | ||
| EU15-born (excluding UK) | 36 (2) | 1 (1) | 2 (1) | 1 (2) | ||
| EU8-born | 54 (3) | 1 (1) | 3 (2) | 1 (2) | ||
| EU2-born | 19 (1) | a | a | a | ||
| Rest of the world (inc. 'EU-Other') | 99 (5) | 2 (2) | 3 (2) | 1 (1) | ||
| Source: ONS, NRS and NISRA 2011 Census | ||||||
| Notes: | ||||||
| 1. Numbers and percentages may not sum due to rounding. | ||||||
| 2. a: rounded to the nearest thousand would equal zero, however, the absolute number is non-zero. | ||||||
| 3. See Section 4 for further information on migrant definitions and country groupings used. | ||||||
Download this table Table 1: UK’s construction workforce by UK constituent country and country of birth, 2011
.xls (37.9 kB)Table 2 shows the latest official estimates of the UK’s construction workforce by sub-sector and nationality between 2014 and 2016. See Section 6 for further detail on sub-sector by nationality. For further information on coverage of each sub-sector please refer to Section 8 of this report.
Table 2: UK's construction workforce by sub-sector and nationality, 2014 to 2016
| Thousands | ||||||||
| Construction of buildings (%) | Civil engineering (%) | Specialized construction activities (%) | ||||||
|---|---|---|---|---|---|---|---|---|
| All nationalities | 832 (100) | 339 (100) | 1,053 (100) | |||||
| UK | 724 (87) | 313 (93) | 973 (92) | |||||
| Non-UK | 109 (13) | 25 (7) | 80 (8) | |||||
| EU (excluding UK) | 84 (10) | 18 (6) | 62 (6) | |||||
| EU15 (excluding UK) and EU Other | 14 (2) | 9 (3) | 14 (1) | |||||
| EU8 and EU2 | 70 (8) | 9 (3) | 49 (5) | |||||
| Non-EU | 24 (3) | 7 (2) | 18 (3) | |||||
| Source: ONS Annual Population Survey (APS) (three-year pooled dataset, 2014 to 2016) | ||||||||
| Notes: | ||||||||
| 1. See section 4 of the report for further information on migrant definitions and country groupings used. | ||||||||
Download this table Table 2: UK's construction workforce by sub-sector and nationality, 2014 to 2016
.xls (37.9 kB)3. Introduction
The article Migrant labour force within the construction industry published on 19 June 2018, used official data sources to look at the composition of the overall labour market for construction contracting in the UK. This included looking at how the workforce is ageing, the concentration of workers in London and the South East, high levels of self-employment and an occupational breakdown in the industry with a focus on how these characteristics differ between UK and non-UK nationals.
This second article is in response to the substantial user need to understand variation within the construction industry across regions and constituent countries of the UK and variation across sub-sectors within the industry. Due to the fragmented but flexible nature of the construction industry it is difficult to know the role of migrants across sub-sectors and how this varies geographically across the UK. This article therefore considers what official data can tell us about how contributions of migrants in the construction industry differ by region and sub-sector.
To provide detailed information of the characteristics of those in the UK construction industry, this article analyses data from the Annual Population Survey (APS) (PDF, 861KB) three-year pooled dataset for the UK.
To provide further detail at lower-level geographies and across sub-sectors of the construction industry, this article also analyses data from the 2011 Census. To provide a full UK perspective, data have been collated from Northern Ireland Statistics and Research Agency (NISRA), National Records of Scotland (NRS) and Office for National Statistics (ONS).
As noted previously, the construction sector is very flexible but fragmented, which makes gathering data about the industry intrinsically difficult. Therefore, this article also considers improvements needed to data and future developments.
Nôl i'r tabl cynnwys4. Things you need to know about this release
The Annual Population Survey (APS) three-year pooled dataset
The APS is a household survey in the UK, it does not measure flows into and out of the UK. The survey itself does not include most communal establishments (managed accommodation such as halls of residence, hotels, hostels and some accommodation provided by employers and care homes).
Office for National Statistics (ONS) has combined the data from 2014, 2015 and 2016 into a three-year average from January 2014 to December 2016. The APS is used to allow for more robust analysis at lower-level geographies, which is not always possible using the single-year APS dataset. The data show respondents who were counted in the construction industry at the time they were surveyed, but does not measure how long they were in the industry within the year the survey relates to. The methodology of the APS is fully explained in Volume 6: APS user guide (PDF, 839KB).
2011 Census
The data show respondents who were in the construction industry at the time of census. Therefore, it is important to note that the data are limited because of the time reference. This encompasses the total population including all persons in households and communal establishments.
Construction industry
The construction industry in this report refers to the construction, repair and maintenance of buildings and structures of all kinds, sometimes referred to as “construction contracting” to distinguish it from “construction products” and “construction services”. This encompasses sectors 41, 42 and 43 within the Standard Industrial Classification (SIC) codes (2007), covering three main sub-sectors in the construction industry:
41 – construction of buildings includes the development of buildings, residential and non-residential buildings, commercial buildings and domestic buildings; residential and domestic buildings are commonly referred to as home-building
42 – civil engineering includes construction of roads, railways, motorways, bridges, tunnels, utility projects and water projects; this is also referred to as the infrastructure sub-sector
43 – specialised construction activities includes demolition and site preparation, completion and finishing activities, electrical, plumbing and other installation activities
This excludes sectors in other services such as 71.1 architectural and engineering activities and related technical consulting, and 74.90/2 quantity surveying activities.
A full summary of the structure for these construction sub-sectors can be found in Section 8 of this report.
It is important to note that industry sector does not always cover job content – for example, people working in construction of buildings sub-sector could occupy a variety of jobs, such as bricklayers and masons, property, housing and estate managers, town planning officers, and window cleaners.
Migrant
The data sources in this report use two definitions of a migrant:
"Nationality" is used to identify migrants using the Annual Population Survey (APS)
"Country of birth" is used to identify migrants using the 2011 Census as respondents’ nationality was not collected
When considering statistics about migrants in the labour market, nationality is the preferred definition as it reflects someone’s right to work and access to services in the UK. It is important to note that people who were born abroad may have obtained British nationality since their arrival in the UK so will not be considered as a migrant in the APS analysis. However, those who were born outside of the UK will be identified as a migrant in the census analysis. This is a significant factor for workers born outside the EU but much less for those from another EU country.
Differences in the use of these two definitions are fully explained in the January 2017 report, What information is there on British migrants living in Europe?
EU country groupings used in this report
Figure 1 shows the EU country groupings used in this report.
EU2
Refers to Bulgaria and Romania; two countries that joined the EU on 1 January 2007. Between 2007 and 2013, EU2 nationals had certain restrictions placed on them; generally, they could work as self-employed workers but not as employees. These restrictions were lifted on 1 January 2014.
EU8
Refers to Czech Republic, Estonia, Hungary, Latvia, Lithuania, Poland, Slovakia and Slovenia joined the European Union at the same time (2004).
EU15
Refers to Austria, Belgium, Denmark, Finland, France, Germany, Greece, Ireland, Italy, Luxembourg, the Netherlands, Portugal, Spain and Sweden. For the purposes of our statistics, we don’t include the UK in EU15.
EU27
Refers to Austria, Belgium, Bulgaria, Croatia, Cyprus, Czech Republic, Denmark, Estonia, Finland, France, Germany, Greece, Hungary, Ireland, Italy, Latvia, Lithuania, Luxembourg, Malta, the Netherlands, Poland, Portugal, Romania, Slovakia, Slovenia, Spain and Sweden. For the purposes of our statistics, we don’t include the UK in EU27.
EEA
The European Economic Area (EEA) includes all EU countries, in addition to Iceland, Liechtenstein and Norway allowing them to be part of the EU’s single market.
Figure 1: EU groupings used within UK migration statistics, 2018

Source: Office for National Statistics
Notes:
- There are 28 countries in the European Union (EU28) as at 1 January 2017. For the purposes of our statistics we do not include the UK within the EU15. EU15 joined before 2004, EU8 in 2004, EU2 in 2007 and for EU Other, Malta in 2004, Cyprus in 2004 and Croatia in 2013.
Download this image Figure 1: EU groupings used within UK migration statistics, 2018
.png (189.3 kB)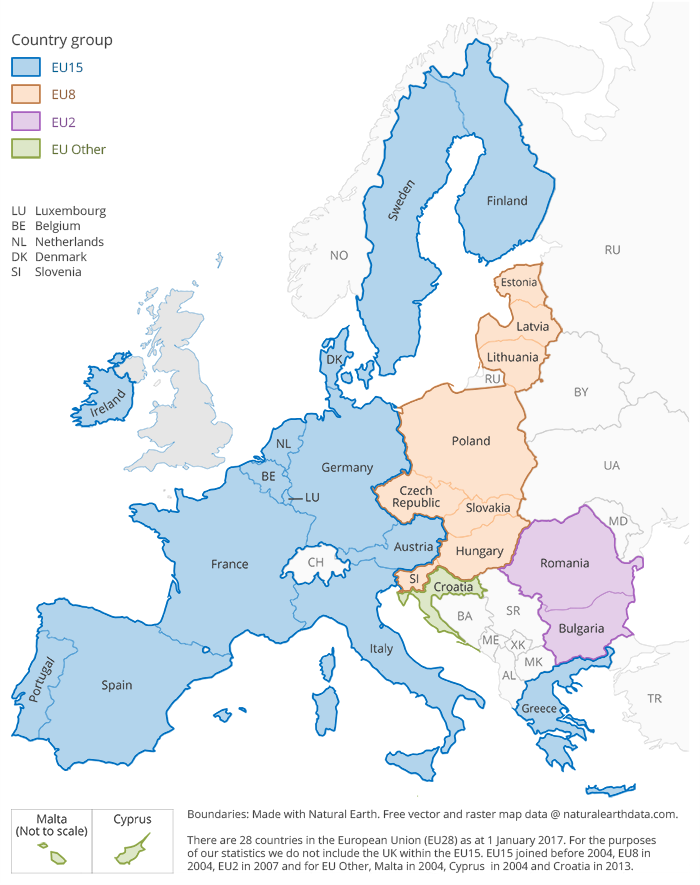
Due to the large numbers of Irish nationals working in the UK construction industry there is a strong user need for Irish nationals to be included in EU totals in this report. It is noted that Irish nationals are subject not only to EU legislation but as nationals of the Common Travel Area they have rights to live and work in the UK. It is not possible, due to sample sizes, to provide a breakdown of the characteristics of Irish nationals in the construction industry separately from EU nationals.
Nôl i'r tabl cynnwys5. Considering regional and the UK’s constituent country variation of migrant labour in the construction industry
Place of work by constituent countries and regions of England
The construction workforce is not equally distributed across the UK.
To provide detailed information on the contribution of migrants to the construction industry at a constituent country and regional level, the 2011 Census is used.
The 2011 Census estimated that 2,240,000 people, aged 16 to 64 years and in employment, were working in the UK’s construction industry. The majority (84%) were working in England, 9% were in Scotland, 5% in Wales and the remaining 3% were based in Northern Ireland (note: percentages may not sum due to rounding).
Non-UK-born construction workers accounted for 10% (224,000) of the construction workforce in the UK. This varied across constituent countries whereby non-UK-born construction workers accounted for 11% (208,000) of the construction workforce in England, 3% (3,000) for Wales, 4% (9,000) for Scotland and 5% (3,000) for Northern Ireland.
Figure 2 displays how the breakdown of non-UK-born workers varied across constituent countries. Of the 208,000 non-UK-born construction workers in England, 26% were EU8-born, 17% were EU15-born (excluding the UK), 9% were EU2-born and the remaining 48% were from the rest of the world (note: this also includes EU Other countries).
Of the 9,000 non-UK-born construction workers in Scotland, 39% were EU8-born, 24% were EU15-born (excluding the UK) and 35% were from the rest of the world.
Of the 3,000 non-UK-born construction workers in Wales, 30% were EU15-born (excluding the UK), 21% were EU8-born and 47% were from the rest of the world.
Of the 3,000 non-UK-born construction workers in Northern Ireland, 42% were EU8-born, 37% were EU15-born and 19% were from the rest of the world.
Figure 2: Constituent profile of non-UK-born construction workers in the UK by country of birth, 2011
Source: Office for National Statistics, National Records of Scotland and Northern Ireland Statistics and Research Agency 2011 Census
Notes:
- Underlying counts for number of non-UK-born construction workers in each constituent country: England = 208,000, Wales = 3,000, Scotland = 9,000, Northern Ireland = 3,000
Download this chart Figure 2: Constituent profile of non-UK-born construction workers in the UK by country of birth, 2011
Image .csv .xlsFigure 3 sets out the percentage of England’s construction workforce within each region of England by country of birth. It highlights the high concentration of non-UK-born residents, working in the construction industry in London, in 2011. An estimated 54% (113,000) of all non-UK-born construction workers were in London.
Figure 3: Percentage split of England's construction workforce by country of birth, 2011
Source: ONS, 2011 Census
Download this chart Figure 3: Percentage split of England's construction workforce by country of birth, 2011
Image .csv .xlsNon-UK-born workers accounted for 44% of London’s construction workforce. Over half of the 113,000 non-UK-born individuals who worked in construction in London were EU-born: 30% EU8-born, 14% EU2-born and 12% EU15-born (excluding the UK). The remaining 44% of the non-UK-born construction workforce in London were born in another country (note: this includes EU Other countries Croatia, Cyprus and Malta).
A further breakdown of the UK-born/non-UK-born construction workers split by region of England is available.
Mobility of construction workforce in the UK
In 2011, the majority (99% or 2,137,000) of the construction workforce in the UK lived in the same constituent country in which they worked. This was consistent across all country of birth groupings
The high proportion of those who lived and worked in the same constituent country was also consistent in England (99%), Northern Ireland (99%), Scotland (97%) and Wales (95%).
Regional mobility within England
Due to the high concentration of construction workers in England, the Annual Population Survey (APS) is used to provide detailed information on the regional mobility within England.
Figure 4 displays the proportion of English residents in the construction industry who lived and worked in the same region, by nationality between 2014 and 2016.
UK nationals were more likely to travel to London, from another region, for work when compared with non-UK nationals in the construction industry. Of the UK nationals who worked in London 74% also lived in London; this is compared with 94% of EU8 and EU2 citizens, 91% of EU Other and 90% of non-EU workers. This pattern is consistent with all other industries in London.
Non-UK nationals in the construction industry were more likely to travel to work in the south of England, from another region, when compared with UK nationals (south of England includes the South West and South East). It is estimated that 95% of UK nationals lived and worked in the south compared with 81% of EU8 and EU2 nationals, 90% of EU Other and 83% of non-EU nationals.
This suggests mobility in the construction workforce and the possibility that if London in particular suffered a shortage of workers, people may travel from other regions to fill these vacancies. However, this may leave hard-to-fill vacancies in other regions.
Figure 4: Proportion of England's resident construction workers living and working in the same region by nationality, 2014 to 2016
Source: ONS Annual Population Survey (APS) (three-year pooled dataset, 2014 to 2016)
Download this chart Figure 4: Proportion of England's resident construction workers living and working in the same region by nationality, 2014 to 2016
Image .csv .xls6. Contribution of migrants across sub-sectors of the construction industry
Sub-sector by nationality
There were an estimated 2,224,000 UK residents working in the construction industry between 2014 and 2016. The Annual Population Survey (APS) estimates that 47% worked in the specialised construction activities sub-sector, 37% worked in the construction of buildings sub-sector and the remaining 15% worked in the civil engineering sub-sector. For further information on what these sub-sectors cover, please see Section 8 of this report.
Non-UK nationals accounted for 13% (109,000) of the construction of buildings sub-sector, 8% (80,000) of the specialised construction activities sub-sector and 7% (25,000) of the civil engineering sub-sector.
Figure 5 shows that the distribution of UK construction workers in each sub-sector varied by nationality. For example, there was a greater proportion of UK nationals, 48% (973,000), who worked in specialised construction activities compared with 37% (80,000) of all non-UK nationals.
A greater proportion of all non-UK nationals working in construction, 51% (109,000), were found to be working in the construction of buildings sub-sector in comparison with UK nationals, 36% (724,000).
Of the 128,000 EU8 and EU2 nationals working in the UK’s construction industry, 55% worked in the construction of buildings sub-sector, accounting for 8% of the total workforce in this sub-sector. Meanwhile, 38% worked in specialised construction activities, accounting for 5% of the total workforce in this sub-sector. The remaining 7% worked in the civil engineering sub-sector, accounting for 3% of the total workforce in this sub-sector.
Of the 49,000 non-EU nationals working in the UK’s construction industry, 50% worked in the construction of buildings, accounting for 3% of the total workforce in this sub-sector. Meanwhile, 36% worked in specialised construction activities, accounting for 2% of the overall workforce in this sub-sector. The remaining 15% worked in the civil engineering sub-sector, accounting for 2% of the overall workforce in this sub-sector.
A greater proportion of EU15 (excluding the UK) and EU Other nationals in the construction industry were working in the civil engineering sub-sector (24%) compared with UK nationals (16%). EU15 (excluding the UK) and EU Other nationals comprised 3% of all workers in the civil engineering sub-sector.
Figure 5: Sub-sector by nationality, UK, EU and non-EU, 2014 to 2016
Source: Office for National Statistics, Annual Population Survey (APS) (three-year pooled dataset, 2014 to 2016)
Download this chart Figure 5: Sub-sector by nationality, UK, EU and non-EU, 2014 to 2016
Image .csv .xlsSub-sector by constituent countries and region
The Annual Population Survey (APS) estimates that 16% of those who worked in the construction industry in the UK, who specified their place of work, worked in London between 2014 and 2016. A greater proportion of those working in the construction of buildings sub-sector (21%) worked in London compared with the rest of the construction industry (13%).
Figure 6: Place of work for those working in the construction industry, UK, 2014 to 2016
Source: ONS Annual Population Survey (APS) (three-year pooled dataset, 2014 to 2016)
Notes:
- The Annual Population Survey (APS) dataset comes from boost / enhancement surveys in Great Britain. There is no boost sample in Northern Ireland, though it is noted that the sampling fraction in the main Labour Force Survey (LFS) in Northern Ireland is greater than in Great Britain. For further information on the sample design of the APS please see Volume 1: Background and methodology.
Download this chart Figure 6: Place of work for those working in the construction industry, UK, 2014 to 2016
Image .csv .xlsNon-UK nationals make up the substantial minority of the resident workforce in the construction sector. As found in Migrant labour force within the construction industry, "The Annual Population Survey (APS) estimates that 90% (2,010,000) were UK nationals between 2014 and 2016, while 7% (165,000) were from another EU country and the remaining 3% were non-EU nationals (49,000).
The share of the construction workforce who are non-UK nationals was much greater in London, whereby 65% (227,000) were UK nationals and 35% (122,000) were non-UK nationals (28% were EU nationals and 7% were non-EU nationals).
Non-UK nationals accounted for 40% (70,000) of the construction of buildings workforce in London: 28% comprised EU8 and EU2 nationals, 8% were non-EU nationals and the remaining 5% were from the rest of the EU.
Self-employment by sub-sector
An estimated 41% of the 2,224,000 people working in the construction industry were self-employed between 2014 and 2016. Those who were self-employed in the construction industry represented 20% of the total self-employment in the UK.
A higher proportion of non-UK nationals in the construction industry (56% or 120,000) were self-employed when compared with UK nationals (39% or 791,000).
Levels of self-employment vary across the sub-sectors of the construction industry. Those working in the specialised construction activities sub-sector were more likely to be self-employed (50%) compared with those working in the construction of buildings (40%) and the civil engineering (15%) sub-sectors.
Figure 7 shows that higher levels of self-employment were seen across all sub-sectors for non-UK nationals compared with the overall construction industry.
Figure 7: Self-employment by sub-sector and nationality, UK and non-UK, 2014 to 2016
Source: ONS Annual Population Survey (APS) (three-year pooled dataset, 2014 to 2016)
Download this chart Figure 7: Self-employment by sub-sector and nationality, UK and non-UK, 2014 to 2016
Image .csv .xls7. Next steps
The construction sector is very flexible and fragmented, which means that a greater level of detail than that currently provided by official data sources would be useful for users who often have responsibility for sub-sectors or occupations. The flexible and fragmented nature of the industry also makes gathering data intrinsically difficult. Section 8 of this report highlights a variety of data sources collected from trade bodies, which provide information on sub-sectors within the construction industry. Co-ordinating such data might support the development of a comprehensive and up-to-date picture of the construction workforce.
Detailed information on the existing workforce and their skills, along with the number of people entering the workforce and their qualifications and skills, is necessary to understand what is needed to meet the housing and infrastructure construction demand. Office for National Statistics (ONS) will work with Department for Business, Energy and Industrial Strategy (BEIS), construction trade bodies and other members of the Consultative Committee on Construction Industry Statistics (CCCIS) to develop a strategy for improving data collection and knowledge in this area of the migrant labour force. CCCIS is a long-standing group that meets twice a year to discuss statistics and research relating to the UK construction sector. It has a wide membership representing government, the construction industry and associated sectors, academia and independent analysts.
For the construction industry and for many other industries, it would be useful to understand more about how all people, including different types of migrants, move around the labour market. In theory, some occupations provide an access point to the labour market, in which a worker acquires skills, knowledge and qualifications that enable them to move onto a better-paid occupation. Again, in theory, such entry-level occupations would require a constant feed of new workers. To understand how this works would require a longitudinal dataset that can identify changes in occupation. This isn’t currently possible in survey data, but is an aim for future administrative data sources.
Government administrative data sources currently being investigated, which may offer some insights into construction workers, are HM Revenue and Customs (HMRC) Pay As You Earn Real Time Information and HMRC self-assessment data. The plan for the development of statistics using administrative data is continuously under review to stay responsive to changing priorities for evidence on different aspects of international migration. Further information can be found in our Migration statistics transformation update.
Nôl i'r tabl cynnwys8. What other information is available?
This report has focused on what official data sources can tell us about the migrant contribution to the UK’s construction labour force and how this varies across regions and constituent countries of the UK and across sub-sectors of the industry. These official data sources can be limited in terms of level of detail and coverage of recent arrivals to the UK and short-term migrant workers, where additional detail has been gained from the census; this is limited to the time of the census.
Table 3 highlights a variety of data sources known to Office for National Statistics (ONS), which provide additional information on the migrant labour force in the construction industry. The table highlights the coverage and limitations of these sources. Further collaboration and co-ordination of such data sources is needed to support the development of a comprehensive and up-to-date picture of migrant labour in the construction workforce.
Table 3: Coverage and limitations of known data sources quantifying the contribution of migrants in subsectors of the industry
| Organisation | Data source | Coverage | Limitations | Migrant defined by |
| Construction Industry Training Board (CITB) The CITB is the main organization which funds training for the construction sector, obtained from a levy on firms within the sector. It also works with the sector to develop new qualifications and encourage the training, of a safer, better qualified workforce. | Migration and Construction: The view from employers, recruiters and
non-UK workers in 2018 (PDF, 1MB) and |
Three strands to their coverage; Extensive desk research on existing data, qualitative interviews (with 20 employers, 12 non-UK workers, 5 recruitment agencies and 7 industry stakeholders) and a quantitative survey (699 interviews with construction and professional service employers in Great Britain, recruitment agencies or non-UK construction workers on large sites). | Recent arrivals to the UK and short-term migrants are likely to be undercounted. Some regions may be overrepresented in their sampling. May not capture short-term or very mobile migrants. Samples of non-UK are unlikely to be representative. Sampling may over-represent some regions. Sample sizes are relatively low. | Non-UK workers defined as those not born in the UK and without a UK passport or UK citizenship. |
| Federation of Master Builders (FMB) Established in 1941 to protect the he interests of small and medium-sized (SME) construction firms, the FMB is independent and non- profit making, lobbying for members' interests at both the national and local level. | House Builders’ Survey 2017 (PDF, 1.9MB) | 124 small and medium-sized house builders who were FMB members in England who list house building as one of their trades. Active in building new homes over the last 10 years. | Only includes house building trades so not representative of the wider construction industry. Only surveys SME so no information on self-employed or larger firms. Unlikely to capture short-term or highly mobile migrants. | The following question was asked: “Do you currently employ, either as a direct employee or a sub-contractor, any EU workers?” |
| Home Builders Federation (HBF) The representative body of the home building industry in England and Wales. The HBF’s member firms account for some 80% of all new homes built in England and Wales in any one year, and include companies of all sizes. | Home Building Workforce Census 2017 | A census supported by almost 40 home building companies with 37,167 respondents. Provides a breakdown of workers by country of origin and nationality, age, region and trade. | Only includes home building trades so not representative of the wider construction industry. Likely misses many SME and self-employed workers. Only a snapshot of the industry so would not be able to inform long-terms trends. Unlikely to capture short-term migrants. Some regional sample sizes are more substantial than others. | Nationality |
| AECOM A multinational engineering firm that offers professional and technical services. They employ approximately 87,000 staff in 150 countries. | AECOM: response to the MAC (PDF 203KB) | A report outlining the composition of their employed workers including a breakdown of the proportion of EEA migrants they employ. Outlines areas of skills shortages, recruitment methods and future plans. | No age breakdown of their employed workforce. Their employees tend to be highly-skilled workers.No indication of the extent of subcontracting.Unlikely to capture short-term migrant workers or self-employed workers. | Nationality |
| Arup An independent firm of designers, planners, engineers and consultants, working across every sector of the built environment from almost 100 offices worldwide. | Arup: response to the MAC (PDF, 260KB) | Employ 13,500 staff worldwide and 5,000 in the UK. Provides information on workers nationality, mobility and region. | No demographic breakdown of their employees. No distinction beyond non-UK workers. Their employees tend to be highly-skilled workers. A highly mobile and global company may not be representative of the industry as a whole. No indication of the extent of subcontracting. Unlikely to capture short-term migrant workers or self-employed workers. | Non-UK workers |
| Construction Industry Council (CIC) The representative forum for professional bodies, research organisations and specialist business associations across the construction industry. Represent 500,000 individual professionals and more than 30,000 firms of construction consultants. | Construction Industry Council: response to the MAC (PDF, 669KB) | Uses multiple data sources including official data sources and their member organisations (LFS, engineering UK, APPG, BWB, Balfour Beatty, Barratt, RICS and CITB reports). Covers topics including the ageing workforce, worker deficits and skills shortages. Some breakdown by nationality and within trades and organisation. | Unlikely to capture short-term migrant workers or self-employed workers. Uses multiple data sources with different definitions of non-UK workers. No overall numbers of wider construction industry workforce. | LFS – Country of birth Own data – non-UK workers |
| The Chartered Institute of Building (CIOB) A professional body for construction management and leadership that represent construction and property professions within the built environment. | The Chartered Institute of Building: response to MAC (PDF, 437KB) | Uses multiple data sources including official data sources and other organisations (LFS, CIOB, ONS Labour Market Statistics and NIESR reports). Analysis of the migrant composition of the workforce by different factors including region and trade. Discusses issues of recruitment, the immediate and short-term needs of the industry, volatile labour market and ageing workers. Provides information of skills shortages and training numbers. Acknowledge the difficulty in finding clear and consistent definitions across the industry. | Unlikely to capture short-term migrant workers or self-employed workers. Uses multiple data sources with different definitions. No overall numbers of wider construction industry workforce. Their employees tend to be highly-skilled workers. | LFS – Country of birth |
9. Annex: UK Standard Industrial Classification 2007 summary structure for construction sub-sectors
Annex: UK Standard Industrial Classification 2007 summary structure for construction sub-sectors
| Division | Group | Class and subclass | Description |
|---|---|---|---|
| 41 | Construction of buildings | ||
| 41.1 | Development of building projects | ||
| 41.10 | Development of building projects | ||
| 41.2 | Construction of residential and non-residential buildings | ||
| 41.20 | Construction of residential and non-residential buildings | ||
| 41.20/1 | Construction of commercial buildings | ||
| 41.20/2 | Construction of domestic buildings | ||
| 42 | Civil engineering | ||
| 42.1 | Construction of roads and railways | ||
| 42.11 | Construction of roads and motorways | ||
| 42.12 | Construction of railways and underground railways | ||
| 42.13 | Construction of bridges and tunnels | ||
| 42.2 | Construction of utility projects | ||
| 42.21 | Construction of utility projects for fluids | ||
| 42.22 | Construction of utility projects for electricity and telecommunications | ||
| 42.9 | Construction of other civil engineering projects | ||
| 42.91 | Construction of water projects | ||
| 42.99 | Construction of other civil engineering projects n.e.c. | ||
| 43 | Specialised construction activities | ||
| 43.1 | Demolition and site preparation | ||
| 43.11 | Demolition | ||
| 43.12 | Site preparation | ||
| 43.13 | Test drilling and boring | ||
| 43.2 | Electrical, plumbing and other construction installation activities | ||
| 43.21 | Electrical installation | ||
| 43.22 | Plumbing, heat and air-conditioning installation | ||
| 43.29 | Other construction installation | ||
| 43.3 | Building completion and finishing | ||
| 43.31 | Plastering | ||
| 43.32 | Joinery installation | ||
| 43.33 | Floor and wall covering | ||
| 43.34 | Painting and glazing | ||
| 43.34/1 | Painting | ||
| 43.34/2 | Glazing | ||
| 43.39 | Other building completion and finishing | ||
| 43.9 | Other specialized construction activities | ||
| Roofing activities | |||
| Other specialized construction activities n.e.c | |||
| Scaffold erection | |||
| Specialised construction activities (other than scaffold erection) n.e.c |