Cynnwys
- Main points
- Overview of the dynamic population model
- Data sources in the DPM
- Known population trends and rates
- DPM estimates for local authority case studies
- Insights from local authority engagement
- Upcoming improvements
- Dynamic population model for local authority case studies data
- Glossary
- How the dynamic population model relates to current estimation methods
- Provide feedback
- Collaboration
- Related links
- Cite this article
1. Main points
We are continuing to develop our research into the new dynamic population model (DPM), which aims to estimate population and population change in a timely way, to better respond to user needs.
The DPM uses a statistical modelling approach to draw strength from a range of data sources; this builds on our earlier research to develop DPM estimates for a synthetic local authority.
We have produced DPM estimates for mid-year 2011 to 2022, for 14 case-study local authorities.
Using these new methods, DPM estimates for 13 of these local authorities were no more than 2.2% lower or 3.6% higher than Census 2021 estimates.
We have focused our in-depth analysis in this article on two local authorities: Blackpool, for which DPM estimates were very close to Census 2021 estimates, and Cambridge, which had the highest percentage difference to Census 2021 estimates.
These are our first estimates from the DPM, and we welcome feedback to inform our future developments.
These are not official statistics and should not be used for policy- or decision-making. They are published as research into a method that is different to that currently used for producing population and migration statistics. We advise caution when using the data.
2. Overview of the dynamic population model
Transforming population statistics
The census has evolved over time, providing a snapshot every 10 years into who we are and how we live. The census and our census-based mid-year estimates provide the best picture of society at a moment in time. However, the Coronavirus (COVID-19) pandemic has underlined the need for more timely population estimates, and we are committed to maximising the use of administrative data. We are researching new ways to produce population and social statistics.
We are using a variety of data sources to provide more frequent, relevant, and timely statistics. Our population statistics sources guide helps users find the right population statistics for them.
In July 2022, we introduced the dynamic population model (DPM) as our future proposal for producing timely, coherent population statistics. We used data for a synthetic local authority to illustrate how the model responds to alternative assumptions about data input quality. In this article, we provide population estimates for 14 case-study local authorities. These include time-series data from 2011 and timely estimates up to 2022. We engaged with the 14 local authorities included to understand their local insights.
Benefits of the DPM
The DPM:
uses statistical modelling techniques to combine a range of data sources and demographic insights to estimate the population and population change
builds on our research to develop admin-based population estimates
is flexible and adaptive to changing data inputs, including data with known limitations (for example, containing missing data)
enables production of more timely estimates and coherent estimates of population and population change
can incorporate measures of uncertainty
This allows us to use existing data sources, such as cross-border moves between Scotland, Northern Ireland, England, and Wales, used in the mid-year estimates (MYE). The DPM also uses new data sources, including admin-based population estimates (ABPEs), now known as Statistical Population Datasets (SPDs).
Embed code
3. Data sources in the DPM
The dynamic population model (DPM) uses a range of sources to measure population counts and the components of population change. DPM estimates and the data sources used as inputs in the framework refer to the population at mid-year on 30 June for the reference year.
An important benefit of the DPM is that it is a flexible framework. This means that the data sources used can be changed in line with data availability, for instance for more timely or granular data (such as different geographies). This iteration of the DPM uses the following categories of data.
Births
The DPM uses birth registrations for 2011 to 2022, by mothers’ age counted at time of birth, which are assumed to be highly accurate. For 2022, we use provisional figures as some births may be missed for the most recent months because of lags in registrations, which can legally take place up to 42 days after the event.
Deaths
The DPM uses death registrations for 2011 to 2022, counted at date of death, which are assumed to be highly accurate. For 2022, we use provisional figures as some deaths may be missed for the most recent months because of lags in registrations and coroner-related delays.
International migration
Between 2011 and 2020, the DPM uses the Long-Term International Migration (LTIM) estimates. They are predominantly based on the International Passenger Survey (IPS), which was suspended in March 2020 because of the coronavirus (COVID-19) pandemic.
Experimental estimates for 2021 are produced using Home Office Exit Checks data and the Department for Work and Pensions Registration and Population Interaction Database (RAPID). This new method makes greater use of administrative data. The estimates rely less on IPS data and statistical modelling. Data from 2021 onward are not comparable with previous estimates and may be subject to revisions.
International migration estimates for 2022 are based on forecasts. Year ending June 2022 migration estimates published on 24 November 2022 will be incorporated in future iterations.
Internal migration
Between 2011 and 2020, the DPM uses estimates of internal migration from the mid-year population estimates. These use address changes in GP registrations from the NHS Patient Register (PR) and Personal Demographic Service (PDS), and higher education registrations from Higher Education Statistics Agency (HESA) data, to measure moves within England and Wales. HESA data are used to move students to university addresses and to adjust for lags in students’ post-study moves, ahead of a recorded GP re-registration.
Data for the period 2021 to 2022 use scaling between mid-year estimates (MYE)-based and PDS-based internal migration estimates between 2018 and 2019. This is then used to impute MYE-based internal migration estimates for 2021 and 2022. These provisional imputed estimates are not comparable with previously published estimates, and there is no adjustment for students’ post-study moves.
We are researching ways to produce more timely estimates of internal migration.
Cross-border moves
Between 2011 and 2020, the DPM uses estimates of cross-border moves from the MYE. The total flows to and from constituent countries of the UK are agreed between the Office for National Statistics (ONS), National Records of Scotland (NRS), and the Northern Ireland Statistics and Research Agency (NISRA), based on records of in-migration to the relevant country.
Data for the period 2021 to 2022 use scaling between MYE-based and PDS-based cross-border migration estimates for 2018 to 2019. This is then used to impute MYE-based cross-border migration estimates for 2021 to 2022. These provisional imputed estimates are not comparable with previously published estimates and have not been agreed between the constituent countries of the UK.
We are researching ways to produce more timely estimates of cross-border moves.
Population estimates
Mid-year estimates
MYE data for 2011 represents the 2011 Census, rolled forward from Census Day (27 March) to mid-year (30 June). Because of the proximity to the census, we assume that this estimate is high quality. Later years of population estimates from the MYE are not used.
NHS General Practice Patient Register (PR)
The NHS GP Patient Register is used for 2012 to 2015. In these years, SPD data are not available. PR data give the number of individuals registered with a GP surgery in England and Wales. We adjust for coverage error through comparisons between 2011 PR and 2011 MYE.
Statistical Population Datasets, version 3 (SPDv3)
Statistical Population Datasets (SPD) version 3 are used for 2016 to 2020. Datasets are derived from administrative data by combining various sources of "activity" data and use rules to decide whether to include an individual in the usually resident population. We have compared SPDv3 with 2011 MYE to estimate the coverage error and applied a coverage adjustment to all years of the SPDv3 (see "Assumptions about data sources" in this section for further information). We are working on iteratively improving and updating this coverage adjustment for future releases of the experimental DPM.
Benchmark comparisons
Data from Census 2021 are not used directly within the model but are used to compare against model outputs. Census 2021 data references 21 March, three months before mid-year, so some differences can be expected between the DPM and census estimates.
Assumptions about data sources
To explore this new method, we use existing data sources available to us, making assumptions on their quality based on our current information and knowledge. We recognise that some of these will need to be refined over time.
The coverage adjustment ratios for the SPD and Patient Register were calculated by comparing with 2011 MYE, and we have assumed that this rate has remained constant since 2011.
We smooth coverage ratios and flow data using generalised additive models (GAMs) for each combination of local authority, sex (if applicable), and year; we do this to reduce error from fluctuations between years and aim to capture the true underlying relationship, which should not change significantly.
The 2011 MYE are unbiased, with uncertainty comparable with the 2011 Census.
The models for SPDv3 and PR incorporate the standard deviations obtained from the measures of statistical uncertainty for SPDv3 (read more in Admin-based population estimates and statistical uncertainty).
The model assumes that birth and death registrations are accurate, however we expect a slight undercount for the most recent months
Census 2021 is used as a comparator to assess how the model performs but is not included in the model.
We impute SPD denominators for flow rates for 2012 to 2015 and 2021 to 2022 when we have no "true" SPD values.
Provisional data used for 2021 and 2022 for births, deaths, internal migration, cross-border migration, and international migration are based on early research and are not comparable with previous estimates.
4. Known population trends and rates
Demographic expertise and assumptions feed into the model through statistical models for birth, death, and migration rates. The rates are defined as the ratio of the flows to the population that could experience that event.
We use a model for births, deaths, combined immigration, and combined emigration in the estimation process described in Section 10.
Birth and death counts are taken from registrations directly and assumed to be accurate, while all flow rates are assumed to be uncertain. Note that for combined immigration, the rate is defined by the count.
Assumptions about the trends and rates
To explore the dynamic population model, we are using data sources already available to us and making assumptions about their quality based on our current information and knowledge. We recognise that some of these assumptions will need to be refined over time.
The denominator for the calculation of flow rates is the Statistical Population Dataset version 3 (SPDv3), provisionally adjusted for coverage error using the 2011 Census. We have assumed that the adjusted SPDv3 estimates are more reliable than the mid-year estimates (MYE) because the latter can suffer from drift in the years between censuses.
The smoothing of flow rates across age was applied separately for each local authority, sex (if applicable), and year using an adaptive generalised additive model (GAM). This approach over-smooths the rates for some ages (university ages, in particular) in most of these 14 local authorities. We are developing methods to address this.
Uncertainty in the flow rates is incorporated in the system models using a probability distribution, with a mean equal to the smoothed rates and a specified dispersion parameter (measure of spread). The dispersion parameter is unique for each local authority and rate.
We account for uncertainty in migration rates based on the coefficients of variation (standard deviation divided by the mean) of the estimates of combined immigration and combined emigration. We are developing improved methods to measure error in migration statistics.
We include uncertainty for birth and death rates because SPDv3 population estimates (used as denominators) have uncertainty.
Nôl i'r tabl cynnwys7. Upcoming improvements
All local authorities research article
In early 2023, we will extend this research output to produce provisional estimates for all 331 local authorities in England and Wales, up to June 2022.
We plan to incorporate the following improvements to address quality issues discussed in this article and in our local authority engagement:
improved methods for smoothing rates to retain real growth in specific groups (such as student age groups)
updating data inputs as they become available, for example, births and deaths data and updated migration estimates
Work on future developments outlined in our previous article will continue. We are using detailed comparisons between administrative data and Census 2021 to develop and refine coverage adjustment methods for the Statistical Population Datasets (SPDs). We will do this alongside work to develop a formal coverage adjustment methodology for the longer term.
Producing timely estimates requires "signal" data to provide early notice of emerging trends, such as a drift of people back to inner city areas after the coronavirus (COVID-19) pandemic. We have created a real-time data dashboard to provide timely information. We are exploring new and innovative "signal" data to include in the dashboard, including mobile phone usage, wastewater, and energy consumption such as electricity or gas.
Nôl i'r tabl cynnwys9. Glossary
Dynamic population model
A dynamic population model (DPM) is a statistical modelling approach that uses a range of data to measure the population and population changes in a fully coherent way.
Credible intervals
The range in which the true value of the quantity being estimated is likely to be contained. We use 95% credible intervals in this article by taking 2.5th and 97.5th percentiles from the distributions of counts produced by our estimation process (see Section 10) as the lower and upper bounds of our intervals, respectively. In this case, we can say that the probability that the true value lies in the credible interval is 95%.
Personal Demographic Service (PDS)
The Personal Demographic Service (PDS) from NHS Digital is a national electronic database of NHS patients, which contains only demographic information with no medical details. The PDS differs from the Patient Register (PR) since it is updated more frequently and by a wider range of NHS services. The PDS data available to the Office for National Statistics (ONS) consist of a subset of the records, including those which show a change of postcode recorded throughout the year or a new NHS registration.
Generalised Additive Model (GAM)
A Generalised Additive Model allows the modelling and smoothing of non-linear data. GAMs have been used within the DPM to model and smooth raw flow data. This was done to reduce the amount of random variation and attempt to represent the true underlying pattern. This approach is particularly useful when working with noisy data or rare events.
Nôl i'r tabl cynnwys10. How the dynamic population model relates to current estimation methods
Structure of the dynamic population model (DPM)
The DPM calculates year-to-June population estimates for 2011 to 2022 by single year of age, sex, and local authority.
Figure 11 shows the structure of the DPM. Components in the dashed rectangle constitute a demographic account for a single local authority - a set of tables of counts of demographic stocks and flows, disaggregated by age and sex. Stocks are population counts at a point in time, and flows are additions to, or subtractions from, the population. Inflows include births and movement into the local authority. Outflows include deaths and movement out of the local authority.
We refer to all movement into the local authority as combined immigration, which includes international immigration and internal in-migration from local authorities in England and Wales, and cross-border inflows from Northern Ireland and Scotland. All movement out of the local authority is referred to as combined emigration, which includes international emigration and internal out-migration to local authorities in England and Wales, and cross-border outflows to Northern Ireland and Scotland.
Stocks and flows in a demographic account conform to the accounting identity that states that the change in stock of the population over a period is equal to increases in the population because of births and combined immigration, minus outflows because of deaths and combined emigration. This is consistent with the cohort component method used for mid-year estimates (MYE). Where the MYE uses a population stock every 10 years (census estimates), the DPM also uses a population stock (Statistical Population Datasets, version 3 (SPDv3)), but more frequently, to try to overcome some of the challenges within the MYE process.
Figure 11: Components of the dynamic population model
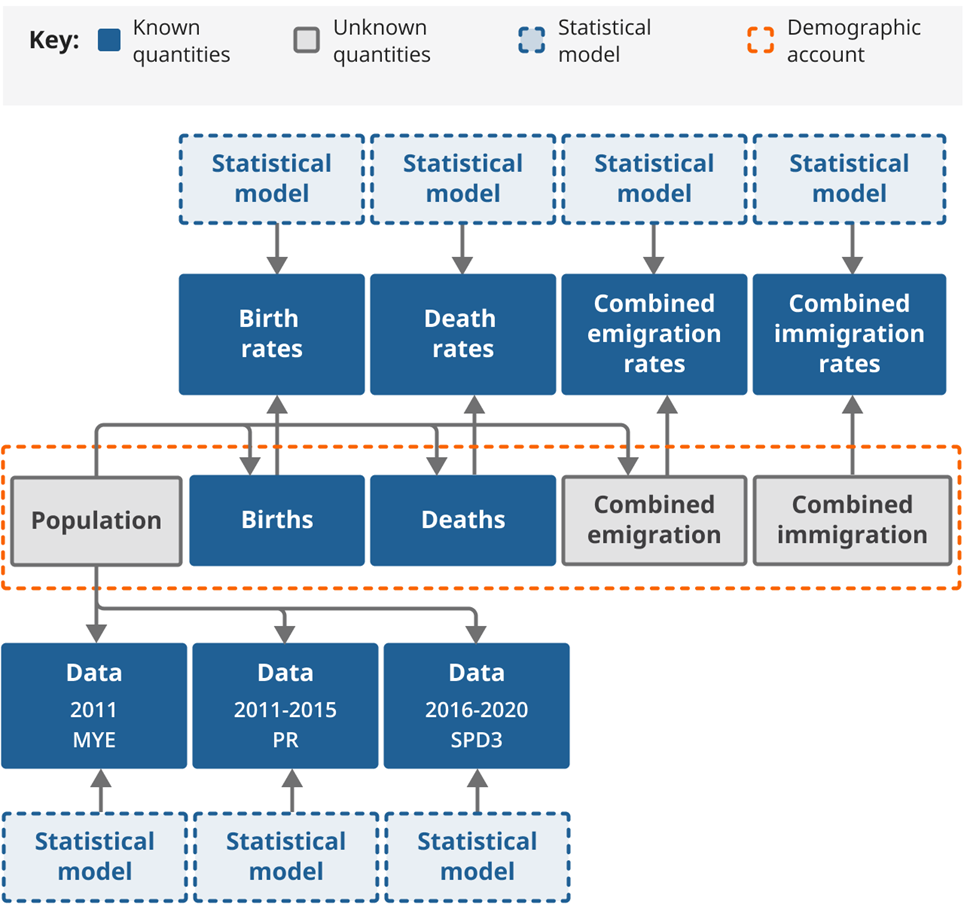
Notes:
- MYE refers to mid-year estimates, PR refers to the NHS Patient Register, and SPD3 is the Statistical Population Dataset version 3.
Download this image Figure 11: Components of the dynamic population model
.png (211.8 kB)
The DPM estimates each component of the demographic account. In Figure 11, the blue boxes represent quantities that are treated as known, and the grey boxes represent quantities that are treated as unknown. The four squares at the top marked "rates" represent the underlying rates for births, deaths, combined emigration, and combined immigration. They are estimated using a mix of modelling and real data, and then treated as input data in the model.
The blue dotted rectangles represent statistical models for the population data counts and statistical models for the rates. The direction of the arrows shows that the data we observe are related to the unknown truth through a statistical model. Components above the demographic account describe how the true, unknown counts for each set of flows are generated from a statistical model with "rates" as parameters.
The components below the demographic account are referred to as data models. They describe the relationship between the reported values in the data and the true, unknown counts. The statistical models account for inaccuracies in the reported counts because of uncertainty in coverage and other sources of error. For this iteration of the model, we have used the normal distribution for our data models (MYE, SPDv3 and NHS Patient Register (PR)) with means adjusted for coverage and standard deviations reflecting the calculated uncertainty intervals of these estimates. Section 3 of this article describes assumptions about the data sources.
The estimation process
The estimation process has two distinct stages. In the first stage, we obtain estimates for counts of population, combined immigration, and combined emigration (births and deaths are treated as known). We use a technique called particle filtering to approximate the distribution of the demographic account by generating, sequentially, a large number of values for each component (we use 10,000). This is conditional on the available data and models. We calculate weights with our statistical models for data and rates to make the sample more representative of the target distribution. This filtering approach is applied independently to each year-of-age cohort.
The second stage is to separate the combined migration values from the model into international migration and within-UK migration flows (internal migration and cross-border flows). We constrain each type of migration flow to equal the combined migration values from the model. We do this by multiplying each migration flow by the ratio of the modelled to total input data values. This is repeated for each of the 10,000 combined migration values, generating 10,000 values for each type of migration flow by local authority, age, sex, and year.
Finally, the 10,000 counts for population, births, deaths, immigration, and emigration, for each local authority by age and sex and year, are summarised by calculating the mean (average). The 2.5th and 97.5th percentiles are calculated to provide a corresponding uncertainty interval (95% credible interval).
While the mean estimates of population and flow counts can be added together to give estimates across age and sex for each local authority and year, this is not true for the percentiles. Therefore, we do not present credible intervals for total population or migration, only for estimates by single year of age and sex.
Note that we have aggregated flows by age and time rather than by cohort, as is done in the mid-year estimate publications. The implication of this is that the change in population between two successive ages is not equal to the sum of net flows.
Nôl i'r tabl cynnwys11. Provide feedback
We welcome your feedback on the dynamic population model (DPM), our transformation journey, and our latest progress and plans. If you would like to contact us, please email us at pop.info@ons.gov.uk.
We have launched our local population statistics insight feedback framework, which enables users of population statistics to provide feedback at local authority level and suggest data sources for us to better understand the quality of our estimates.
You can also sign up to email alerts from the Office for National Statistics Population team for updates on our progress, and to hear about upcoming events and opportunities to share your views.
Nôl i'r tabl cynnwys12. Collaboration
The Office for National Statistics (ONS) has been supported in this research by the University of Southampton. Specifically, we would like to thank John Bryant, Peter Smith, Paul Smith, Jakub Bijak, Jason Hilton, and Andrew Hind for their guidance and support.
We are also indebted to the insights, expertise and feedback provided by local authorities: Blackpool, Boston, Cambridge, Ceredigion, Coventry, Guildford, Gwynedd, Islington, Manchester, Newham, North Norfolk, Swansea, Warwick, and Westminster.
Nôl i'r tabl cynnwys14. Cite this article
Office for National Statistics (ONS), released 23 November 2022, ONS website, article, Dynamic population model for local authority case studies in England and Wales: 2011 to 2022