1. Main points
The Office for National Statistics (ONS) will be improving the measurement of household income and inequality statistics by changing the principal data source from the Living Costs and Food Survey to the Household Finances Survey (HFS).
This will increase the achieved sample from which estimates are derived from around 5,000 to 17,000 households.
The change in data source results in less volatility across the measured income distribution as well as more precise estimates of household income, both overall and by subgroups.
Estimates of household income and inequality largely remain comparable across the two sources, meaning that our overall understanding of changes over the two years to financial year ending (FYE) 2019 remain broadly unchanged.
The ONS plans to introduce the HFS as the principal data source for the period covering FYE 2020 onwards, as well as revising headline estimates covering FYE 2018 and FYE 2019 using this new, higher quality data source.
2. Transforming ONS household income statistics
Background
Over the past few years, the Office for National Statistics (ONS) has undertaken a programme of work to transform the production of its household financial statistics. A major strand of this work has been to integrate two of ONS’s existing household income surveys – the Living Costs and Food Survey (LCF), and the Survey on Living Conditions (SLC). Through the harmonisation of main questions on income, pensions, employment and living conditions, this source – the Household Finances Survey (HFS) – provides an achieved sample of around 17,000 households in the UK.
This work means that ONS’s household income statistics, that were previously estimated from the LCF alone (approximately 5,000 households), will benefit from a larger sample. This in turn will enable greater precision in our headline estimates, increased stability over time, and more granular statistics at regional levels and for different population subgroups.
This methodological article presents headline measures of household income and inequality produced using this new HFS data source, comparing them with previously published estimates derived from the LCF.
Nôl i'r tabl cynnwys3. Impact of change in data source
Distribution of household income
Figure 1: The distribution of household income is less volatile using the Household Finances Survey as a data source
Number of individuals by income bands, Household Finances Survey and Living Costs and Food Survey, financial year ending 2019, UK
Embed code
Notes:
Estimates of income have been adjusted for the undercoverage of top earners.
For median income, individuals are ranked by their equivalised household disposable incomes, using the modified OECD scale.
Figure 1 highlights the number of people within £1,000 income bands, estimated on each of the surveys. It clearly shows that the distribution of household income is less volatile when measured using the Household Finances Survey (HFS), with the LCF having more frequent, relatively larger changes in the number of people in consecutive bands. In absolute terms, the average difference in the number of people between consecutive £1,000 income bands is 94,000 on the HFS, compared with 135,000 on the LCF.
Figure 1 also highlights that estimates of median and mean household income that are produced separately using the LCF and HFS were comparable in financial year ending (FYE) 2019 (April 2018 to March 2019). The following sections look at this in more detail, comparing measures of median income and associated confidence intervals across the whole population, by subgroups of income quintiles, and UK regions.
Median household disposable income
Estimates of median income estimated using the HFS have narrower confidence intervals, meaning that they have greater precision than those derived using the LCF. In FYE 2019, the range between the upper and lower bounds of the 95% confidence interval was £990 measured using the HFS, compared with £1,630 estimated using the LCF. Similarly, the ranges for the HFS and LCF were £790 and £1,360 respectively in FYE 2018.
Figure 2: Median income remains largely unchanged
Median disposable income in the UK, Living Costs and Food Survey (financial year ending (FYE) 2012 to FYE 2019) and Household Finances Survey (FYE 2018 and FYE 2019)

Source: Office for National Statistics – Living Costs and Food Survey and Household Finances Survey
Notes:
- Incomes are adjusted for inflation using the consumer prices index including owner-occupiers’ housing costs (CPIH).
- Estimates of income have been adjusted for the undercoverage of top earners.
- FYE 2019, which represents the financial year ending 2019, (April to March), and similarly for all other years expressed in this format.
- For median income, individuals are ranked by their equivalised household disposable incomes, using the modified OECD scale.
Download this image Figure 2: Median income remains largely unchanged
.png (35.9 kB) .xlsx (18.2 kB)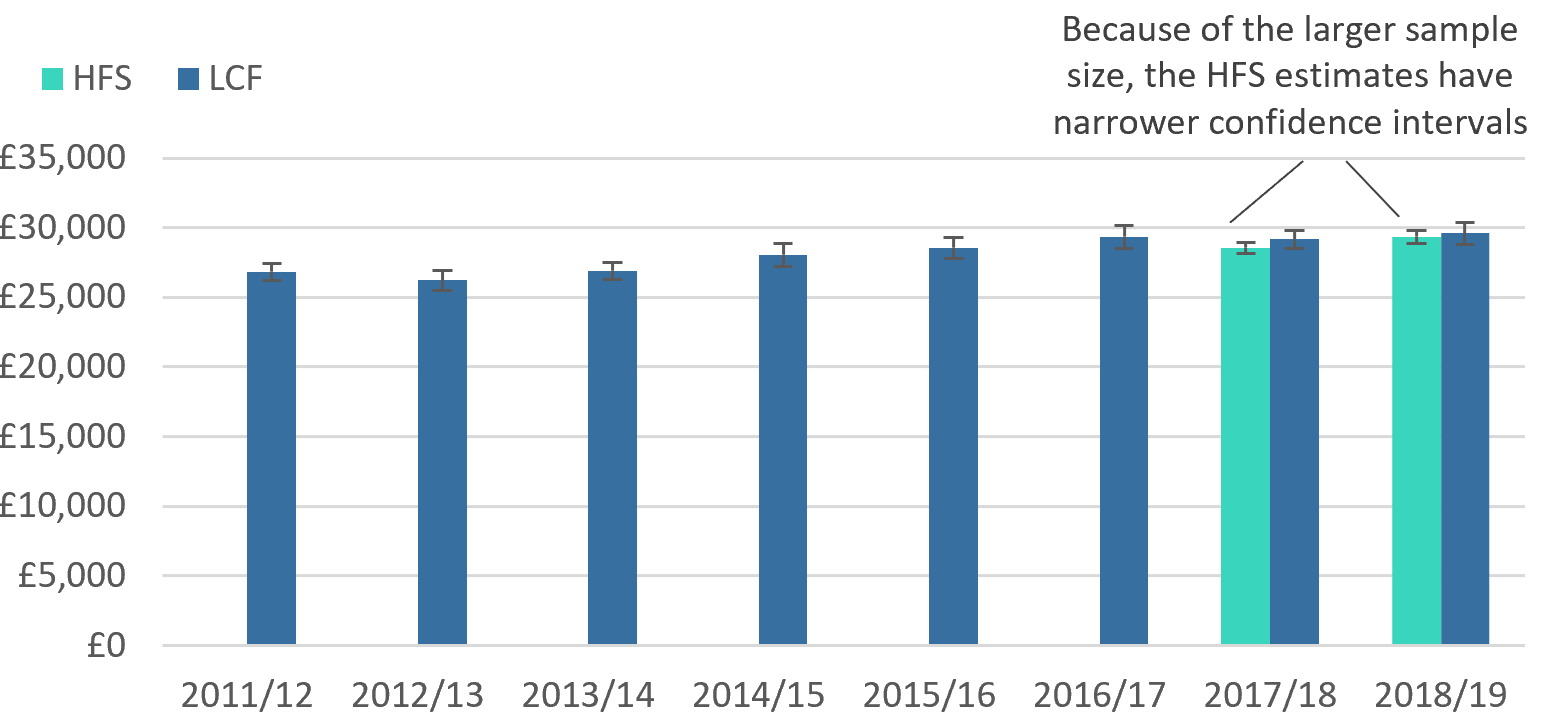
Estimates of median household income derived from the HFS and LCF are broadly comparable. Median household income in FYE 2018 measured on the HFS was £28,600; £600 lower than the LCF estimate (£29,200). Similarly, median income in FYE 2019 measured using the HFS was £300 lower than the LCF in FYE 2019 (£29,300 and £29,600 respectively). Confidence intervals of median income measured on the LCF and HFS overlap in both years, meaning that the differences in results from both data sources are not statistically significant.
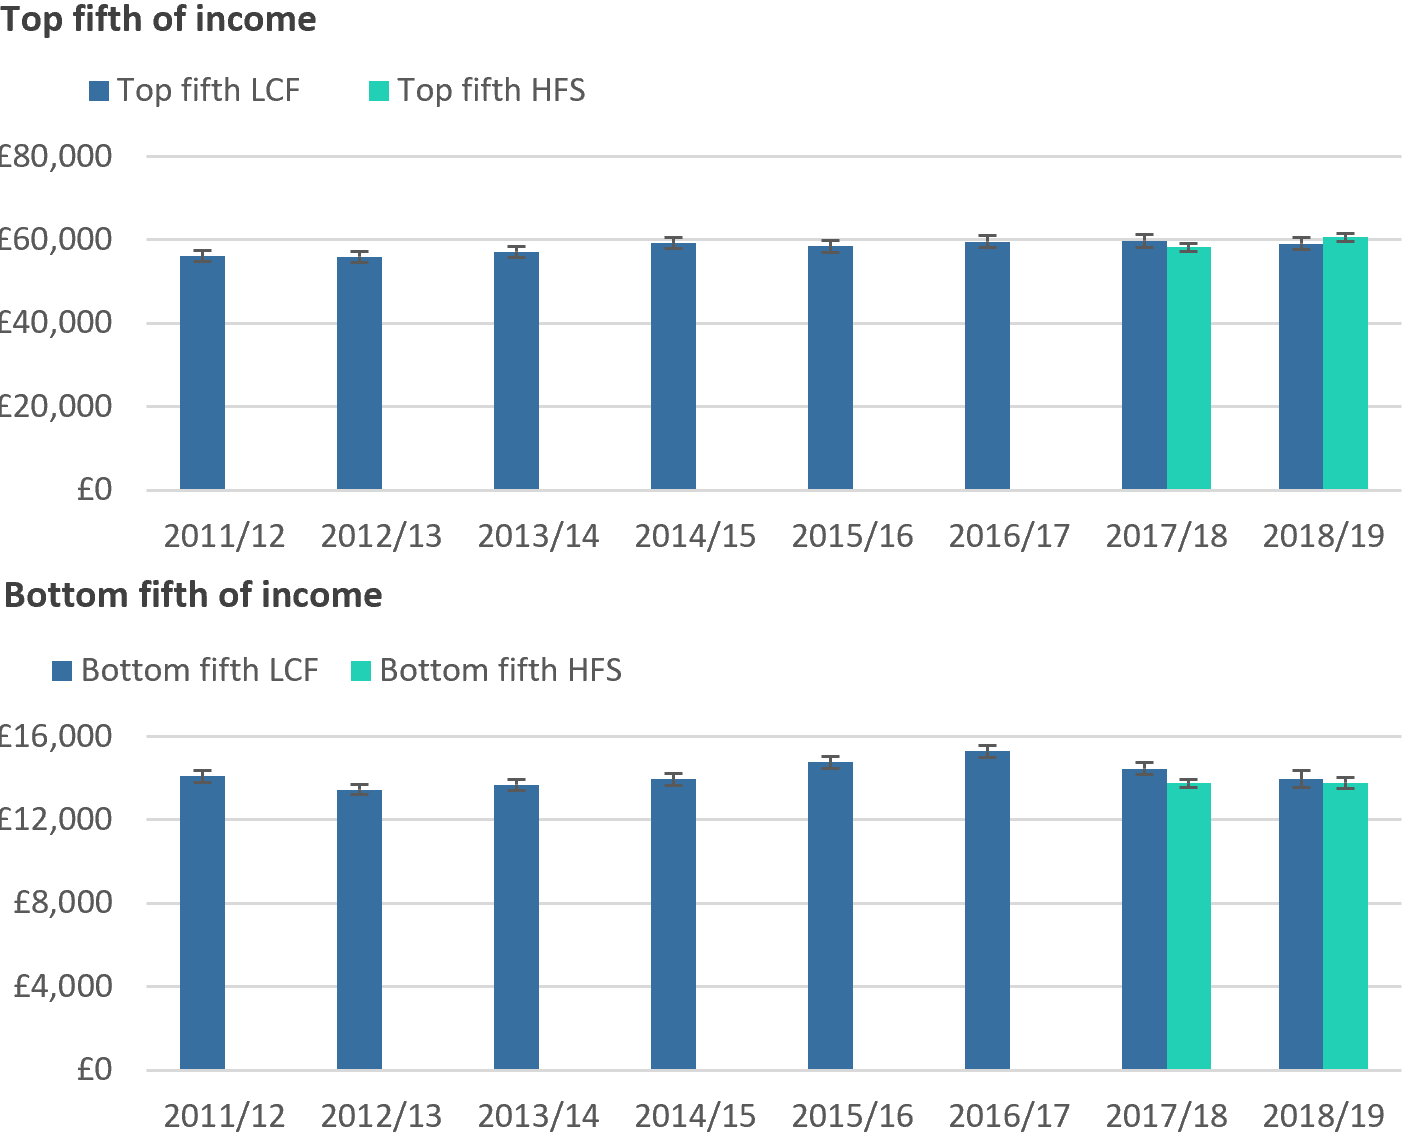
Figure 3: Estimates of median income for the richest and poorest fifth of people are more precise using Household Finances Survey data
Median income estimates and 95% confidence intervals of the poorest and richest fifths
Source: Office for National Statistics – Living Costs and Food Survey and Household Finances Survey
Notes:
- Incomes are adjusted for inflation using the consumer prices index including owner-occupiers’ housing costs (CPIH).
- Estimates of income have been adjusted for the undercoverage of top earners.
- FYE 2019, which represents the financial year ending 2019, (April to March), and similarly for all other years expressed in this format.
- For median income, individuals are ranked by their equivalised household disposable incomes, using the modified OECD scale.
Download this image Figure 3: Estimates of median income for the richest and poorest fifth of people are more precise using Household Finances Survey data
.png (67.1 kB) .xlsx (17.6 kB)
Overall, estimates of median income for the poorest and richest fifths of people have greater precision when measured using the HFS data compared with the LCF. Furthermore, estimates are broadly comparable irrespective of which data source is used. For instance, in Average household income, UK: financial year ending 2019 we reported that median income for the poorest fifth of people fell by 4.3% per year over the two years up to FYE 2019. These findings are similar when LCF data are replaced with the HFS data after FYE 2017, with the median income for the poorest fifth instead falling by 4.9% per year over the two years to FYE 2019.
The change in narrative is slightly more pronounced for the richest fifth of people, with average annual growth between FYE 2017 and FYE 2019 changing from negative 0.4% per year as measured on the LCF, to 0.9% growth per year using HFS data. As explored in the income inequality section of this article, this in part explains the slightly larger increase in the Gini coefficient reported using the HFS over the past two years.
Figure 4: Estimates of household income by UK region are generally more precise when measured using the Household Finances Survey
Median household income and 95% confidence intervals, Household Finances Survey and Living Costs and Food Survey, UK, financial year ending 2019
Embed code
Notes:
Estimates of income have been adjusted for the undercoverage of top earners.
For median income, individuals are ranked by their equivalised household disposable incomes, using the modified OECD scale.
Overall, the larger sample provided by the HFS leads to greater precision when analysing household income by UK regions, with 11 of the 12 regions demonstrating a narrowing of confidence intervals.
The increase in precision is more pronounced in some regions than others. For instance, the range between the upper and lower bounds of the 95% confidence interval fell by 67%, 62% and 60% in East Midlands, London and Wales respectively when switching estimates from the LCF to HFS in FYE 2019. These improvements are largely because of the Survey on Living Conditions (SLC) providing a greater proportionate number of responding households in these regions than the LCF.
On the other hand, the HFS delivers little demonstrable improvement in precision for estimates of Scotland and Northern Ireland. The range between the upper and lower bounds of the 95% confidence intervals fell by 5% for Northern Ireland and was broadly similar in Scotland. This is reflective of the sample boost that the LCF receives in these regions, with the number of responding households greater than any other region on a population size-adjusted basis. As a result, estimates of average income by region measured on the LCF have some of the smallest ranges between the upper and lower bounds of the 95% confidence interval, and the impact of the addition of SLC cases is less noticeable.
Nôl i'r tabl cynnwys4. Income inequality
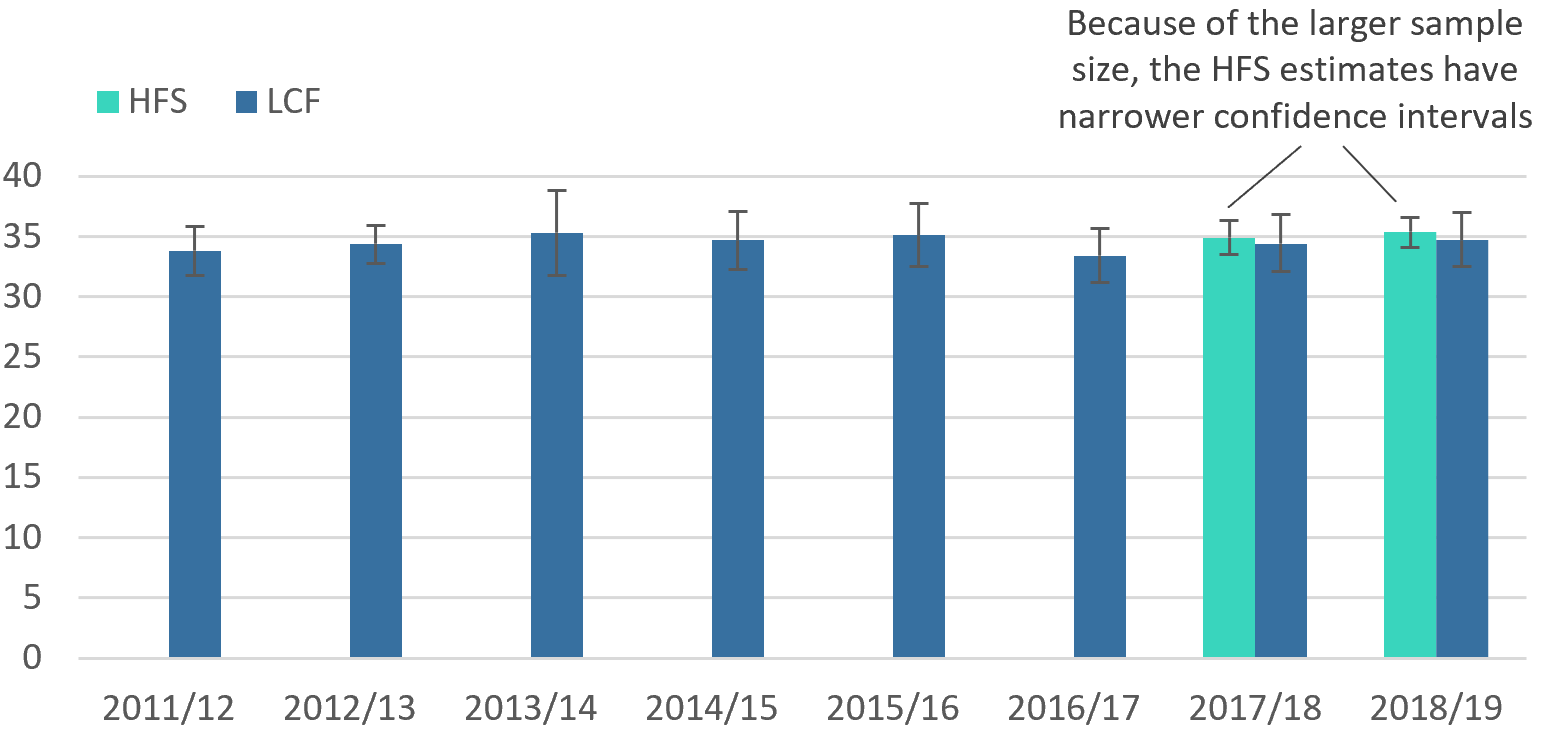
Figure 5: Estimates of income inequality are more precise when measured using the Household Finances Survey
Gini coefficients of disposable income and 95% confidence intervals, Living Costs and Food Survey (financial year ending (FYE) 2012 to FYE 2019) and Household Finances Survey (FYE 2018 and FYE 2019)
Source: Office for National Statistics – Living Costs and Food Survey and Household Finances Survey
Notes:
- FYE 2019, represents the financial year ending 2019, (April to March), and similarly for all other years expressed in this format.
- Estimates of income have been adjusted for the undercoverage of top earners.
- Disposable income has been equivalised using the modified OECD scale.
Download this image Figure 5: Estimates of income inequality are more precise when measured using the Household Finances Survey
.png (32.4 kB) .xlsx (18.2 kB)
Similar to estimates of median income, estimates of income inequality are also more precise when estimated from the Household Finances Survey (HFS) compared with the Living Costs and Food Survey (LCF). In financial year ending (FYE) 2019 (April 2018 to March 2019), the range between the upper and lower bounds of the 95% confidence interval of the Gini coefficient was 2.5 percentage points using the HFS data. This compares with 4.5 percentage points using LCF data.
As highlighted in earlier sections, the replacement of LCF data with HFS leads to stronger growth in average income for the richest fifth of households, compared with the poorest, over the two years to FYE 2019. This in part explains the slightly higher Gini coefficients as measured on the two data sources. While measures reported on the two sources are broadly comparable in each of the two years of data available, differences in changes over time are noticeable. The Gini coefficient increases by 2.0 percentage points in the two years up to FYE 2019 as measured using the HFS, compared with 1.3 percentage points using the LCF.
Nôl i'r tabl cynnwys5. Plans for incorporating Household Finances Survey data into headline estimates
This methodological article demonstrates that headline measures estimated using the Household Finances Survey (HFS) have greater precision. Furthermore, estimates and narratives regarding household income and inequality that were initially formed using the Living Costs and Food Survey (LCF) are not substantially revised when formed with the HFS instead. Based on this, the Office for National Statistics (ONS) plans to:
publish headline estimates of household income and inequality using the HFS for the financial year ending (FYE) 2020 reference period onwards; these are expected to be published in January or February 2021
revise FYE 2018 and FYE 2019 headline estimates of household income and inequality using HFS data as the principal source
We welcome any views and feedback on these plans, which can be provided to us via hie@ons.gov.uk.
Nôl i'r tabl cynnwys