1. Main points
In the financial year ending 2014, over three-quarters of small areas in England and Wales had less than 20% of households in poverty before housing costs (BHC), with an overall range from 4.9% to 53.6%.
In the financial year ending 2014, of all small areas in England and Wales 55% had less than 20% of households in poverty after housing costs (AHC), with an overall range from 6.7% to 63.7%.
The West Midlands region contained the highest proportion (86%) of small areas with a percentage of households in poverty (BHC) greater than the national median, closely followed by Wales (85%).
London contained the highest proportion (74%) of small areas with a percentage of households in poverty (AHC) greater than the national median.
Variation in the percentage of households in poverty (BHC) was greatest in the Yorkshire and The Humber region (based on the interquartile range).
Variation in the percentage of households in poverty (AHC) was greatest in London (based on the interquartile range).
2. Things you need to know about this release
The small area model-based households in poverty estimates provide statistics on the estimates of the percentage of households in poverty at the middle layer super output area (MSOA) level in England and Wales for the financial year ending 2014 (April 2013 to March 2014). They are designated Experimental Statistics, which are calculated using a model-based method to produce two estimates of the percentage of households in poverty – before housing costs and after housing costs. There are 7,201 MSOAs in England and Wales, each containing around 3,000 households.
A household is deemed to be in poverty if the household’s income lies below 60% of the UK median income, where income is defined as net weekly equivalised income. Net weekly household income (equivalised) is composed of the same elements as net weekly household income but is subject to an equivalisation scale. Applying an equivalisation scale adjusts the household income values to take account of the number and composition of people in the household. Therefore, it represents the income level of every individual in the household.
The threshold values for the financial year ending 2014 are as published by the Department for Work and Pensions (DWP):
£272 per week that corresponds to 60% of UK median before housing costs equivalised net income (£453 per week)
£232 per week that corresponds to 60% of UK median after housing costs equivalised net income (£386 per week)
The households in poverty estimates are produced using Households Below Average Income (HBAI) datasets that come from the Family Resources Survey in combination with previously published data from the 2011 Census and a number of administrative data sources. The two different measures of poverty are:
percentage of households in poverty before housing costs (BHC)
percentage of households in poverty after housing costs (AHC)
These estimates can be used to provide an indication of differences in the proportion of households in poverty between small areas when taking into account the confidence intervals presented with them. If the confidence intervals of two areas do not overlap, then the areas can be regarded as significantly different. However, it is not possible to identify the size of the difference between two areas due to the confidence intervals around the individual estimates.
Nôl i'r tabl cynnwys3. What percentage of households were in poverty before housing costs?
For the financial year ending 2014, the median equivalised net income before housing costs (BHC) for the UK was £453 per week with the low income threshold at £272 per week. Therefore a household with a weekly income of less than £272 (BHC) is classed as a household in poverty.
In the financial year ending 2014, the estimated percentage of households in poverty BHC for middle layer super output areas (MSOAs) ranged from 4.9% (within the Westminster local authority district) to 53.6% (within the Bradford local authority district). The median percentage of households in poverty BHC in England and Wales overall was 15.6%, with over three-quarters of small areas in England and Wales having less than 20% of households in poverty BHC.
Figure 1 shows that the 9.8% to 14.6% poverty band contained the largest number of MSOAs, followed quite closely by the 14.7% to 19.4% band. It also shows that there are some areas with particularly high levels of household poverty, but a larger number of areas fall within the lower poverty bands.
Figure 1: Distribution of middle layer super output areas for percentage of households in poverty before housing costs
England and Wales, financial year ending 2014
Source: Office for National Statistics
Notes:
- Class breaks for income based on rounded 10% increments of the range.
Download this chart Figure 1: Distribution of middle layer super output areas for percentage of households in poverty before housing costs
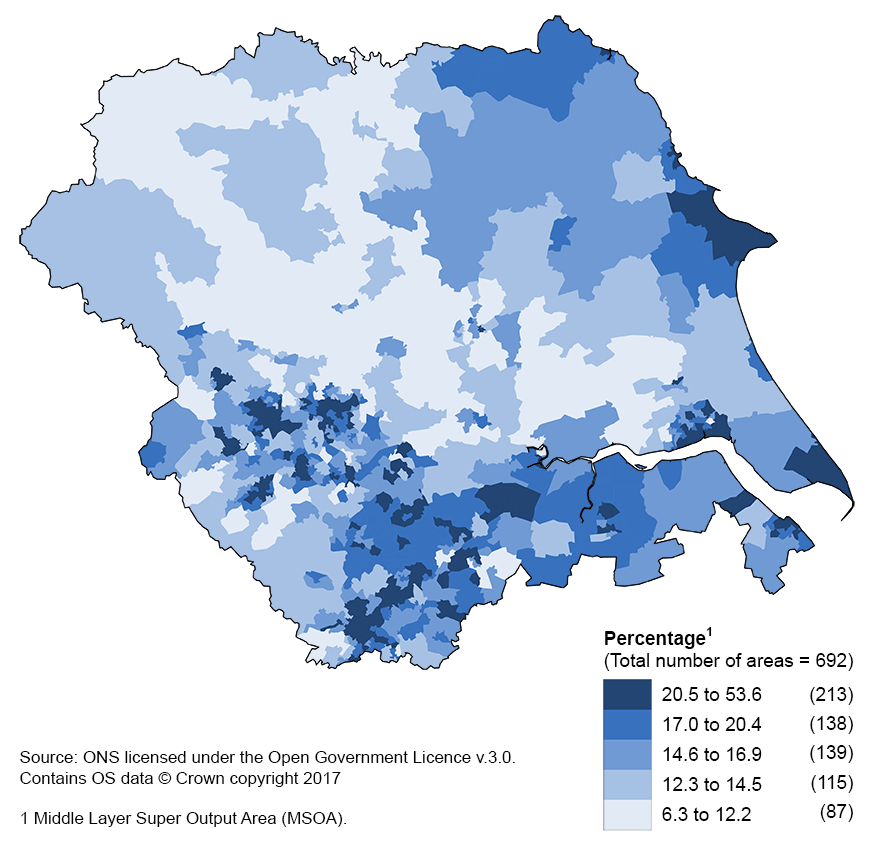
Image .csv .xlsThe region that contains MSOAs with the most variable percentage of households in poverty (based on the interquartile range) was Yorkshire and The Humber. Figure 2 shows the percentage of households in poverty BHC for MSOAs in this region. This region also contained the MSOA with the largest proportion of households in poverty in the whole of England and Wales, at 53.6%.
Figure 2: Model-based percentage of households in poverty before housing costs by middle layer super output area
Yorkshire and The Humber, financial year ending 2014

Source: Office for National Statistics licensed under the Open Government Licence v.3.0. Contains Ordnance Survey data © Crown copyright 2017
Download this image Figure 2: Model-based percentage of households in poverty before housing costs by middle layer super output area
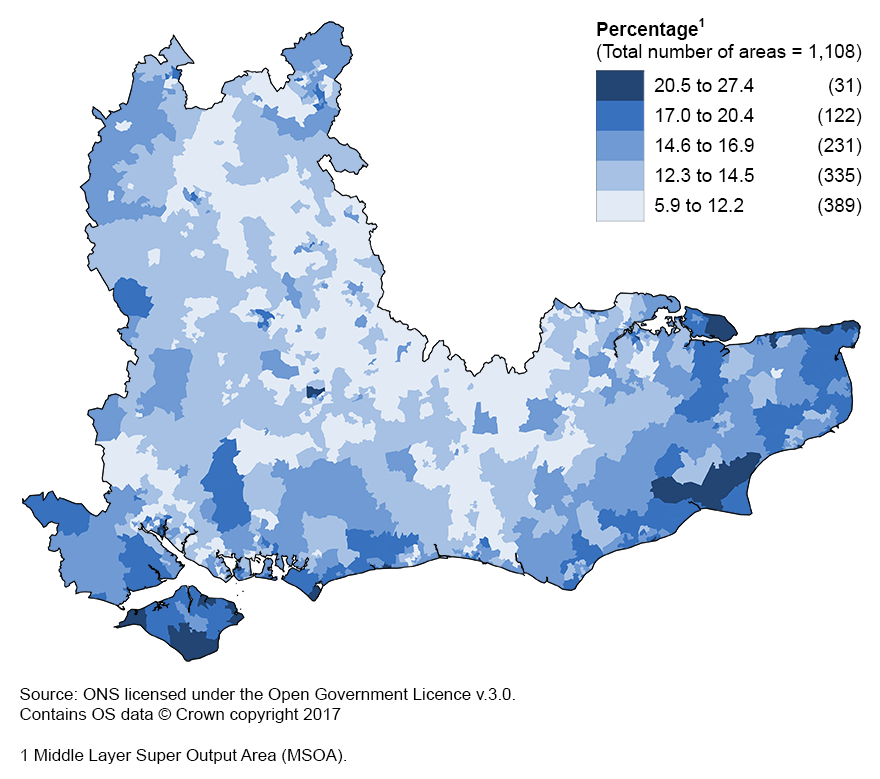
.png (295.7 kB)The South East region had the least variability in the percentage of households in poverty BHC (based on the interquartile range). The map for percentage of households in poverty by MSOA for the South East is shown in Figure 3. This has a similar pattern to the estimates for the financial year ending 2012. The South East also had the lowest median percentage of households in poverty at 13.2%, although London was very similar with 13.3%. Wales had the highest median at 19.9%.
Figure 3: Model-based percentage of households in poverty before housing costs by middle layer super output area
South East, financial year ending 2014

Source: Office for National Statistics licensed under the Open Government Licence v.3.0. Contains Ordnance Survey data © Crown copyright 2017
Download this image Figure 3: Model-based percentage of households in poverty before housing costs by middle layer super output area
.png (288.9 kB)MSOA level estimates allow the exploration of differences in poverty levels within local authority districts (LADs) to better understand inequality at the local level (City of London and Isles of Scilly LADs are excluded from the analysis of MSOA differences within LADs as they each comprise one MSOA).
The distribution of the percentage of households in poverty (BHC) varies across LADs within regions. This variation is highlighted by looking at the proportion of MSOAs within LADs that fall in:
the 20% with the overall highest poverty in England and Wales (highest quintile)
the 20% with the overall lowest poverty in England and Wales (lowest quintile)
In London, all of the MSOAs in Richmond upon Thames fall within the lowest quintile of poverty for England and Wales. Conversely, over 80% of the MSOAs in Newham fall in the 20% of MSOAs with the most poverty (highest quintile). The South East is the only other region where there are LADs with all MSOAs in the lowest poverty quintile for England and Wales (Epsom and Ewell, Spelthorne, Surrey Heath). Thanet was the only LAD with more than half of MSOAs within the highest quintile in the South East in the financial year ending 2014.
Blaenau Gwent in Wales was the only LAD with all MSOAs in the highest quintile for England and Wales, with all 9 MSOAs falling here. In the majority of LADs in Wales, there were no MSOAs that fell in the lowest poverty quintile. Bridgend had the highest proportion with 3 of its 19 MSOAs in the lowest quintile.
The estimates for MSOAs within a LAD can be described as significantly different if the confidence intervals for the estimates do not overlap. This provides an illustration of how these estimates can be used to identify areas of relative high household poverty within a LAD.
The MSOA with the highest poverty can be isolated to examine the proportion of the remaining MSOAs that are significantly different from it. The LAD with the highest such proportion was Calderdale in Yorkshire. Figure 4 shows the estimated percentage of households in poverty (with 95% confidence intervals) for the 27 MSOAs in the Calderdale LAD. In this case, all of the other 26 MSOAs had a significantly lower percentage of households in poverty than that of the highest.
Figure 4: Percentage of households in poverty (before housing costs) by middle layer super output area
Calderdale, financial year ending 2014
Source: Office for National Statistics
Notes:
- Ranked by highest percentage of household poverty.
Download this chart Figure 4: Percentage of households in poverty (before housing costs) by middle layer super output area
Image .csv .xlsOther LADs containing a similarly high proportion of MSOAs with lower poverty (BHC) compared with the highest ranked MSOA were North Lincolnshire (22 out of 23), Stockport (40 out of 42) and Wigan (38 out of 40). However, there are many LADs that do not show this pattern.
Nôl i'r tabl cynnwys4. What percentage of households were in poverty after housing costs?
For the financial year ending 2014, the median equivalised net income after housing costs (AHC) for the UK was £386 per week, with the low income threshold at £232 per week. Therefore a household with a weekly income of less than £232 (AHC) is classed as a household in poverty.
In the financial year ending 2014, the estimated percentage of households in poverty AHC for middle layer super output areas (MSOAs) ranged from 6.7% (within the Bromley local authority district) to 63.7% (within the Leicester local authority district). The median percentage of households in poverty AHC in England and Wales overall was 18.9%, with 55% of small areas in England and Wales having less than 20% of households in poverty AHC.
Figure 5 shows that the 12.4% to 18.0% poverty band contained the largest number of MSOAs. It also shows that there are some areas with particularly high levels of household poverty, but a larger number of areas fall within the lower poverty bands.
Figure 5: Distribution of middle layer super output areas for percentage of households in poverty after housing costs
England and Wales, financial year ending 2014
Source: Office for National Statistics
Notes:
- Class breaks based on rounded 10% increments of the range.
Download this chart Figure 5: Distribution of middle layer super output areas for percentage of households in poverty after housing costs
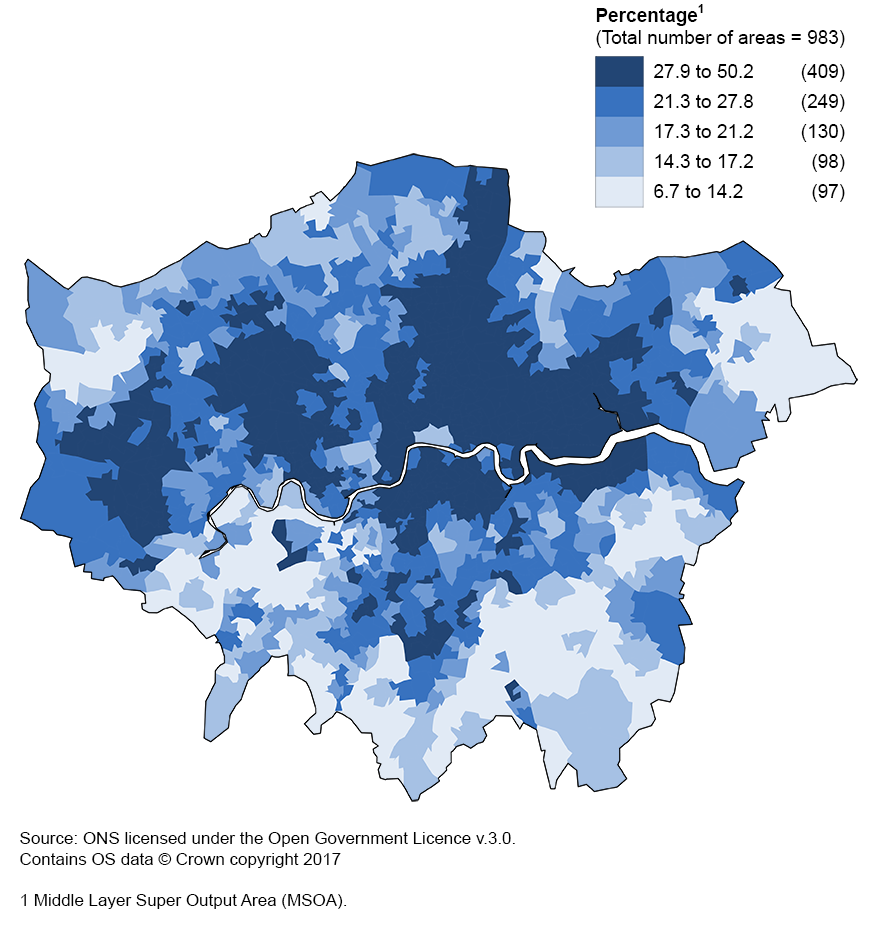
Image .csv .xlsThe region that contains MSOAs with the most variable percentage of households in poverty (based on the interquartile range) was London. Figure 6 shows the percentage of households in poverty AHC for MSOAs in this region.
Figure 6: Model-based percentage of households in poverty after housing costs by middle layer super output area
London, financial year ending 2014

Source: Office for National Statistics licensed under the Open Government Licence v.3.0. Contains Ordnance Survey data © Crown copyright 2017
Download this image Figure 6: Model-based percentage of households in poverty after housing costs by middle layer super output area
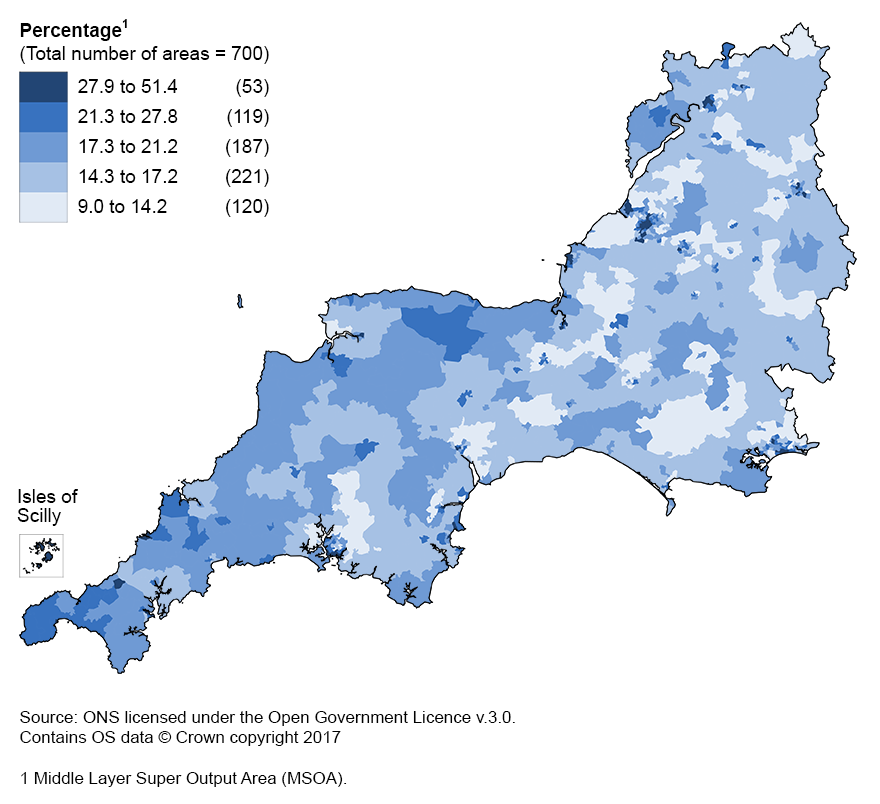
.png (355.6 kB)The South West region had the least variability in the percentage of households in poverty AHC (based on the interquartile range). The map for percentage of households in poverty by MSOA for the South West is shown in Figure 7. The South West also had a low median percentage of households in poverty at 17.4%. This was marginally above the South East, which had the lowest median of 17.3%. London had the highest median at 25.7%.
Figure 7: Model-based percentage of households in poverty after housing costs by middle layer super output area
South West, financial year ending 2014

Source: Office for National Statistics licensed under the Open Government Licence v.3.0. Contains Ordnance Survey data © Crown copyright 2017
Download this image Figure 7: Model-based percentage of households in poverty after housing costs by middle layer super output area
.png (240.2 kB)MSOA level estimates allow the exploration of differences in poverty levels within local authority districts (LADs) to better understand inequality at the local level (City of London and Isles of Scilly LADs are excluded from the analysis of MSOA differences within LADs as they are each comprised of one MSOA).
The distribution of the percentage of households in poverty (AHC) varies across LADs within regions. This variation is highlighted by looking at the proportion of MSOAs within LADs that fall in:
the 20% with the overall highest poverty in England and Wales (highest quintile)
the 20% with the overall lowest poverty in England and Wales (lowest quintile)
In London, all of the MSOAs in both Hackney and Newham fell within the highest quintile of poverty for England and Wales. These were the only two LADs in England and Wales with all MSOAs in the 20% of the overall highest poverty after housing costs. Conversely, Bromley was the only LAD in London with more than half of MSOAs in the 20% of MSOAs with the least poverty (lowest quintile). Outside of London, Blaenau Gwent in Wales had 8 of its 9 MSOAs in the highest poverty quintile for England and Wales.
Ribble Valley in the North West region was the LAD with the largest proportion of MSOAs in the lowest quintile for England and Wales, with 7 of its 8 MSOAs falling here. In Wales, Monmouthshire was the only LAD with no MSOAs in the highest poverty quintile. In the North East, all LADs had areas in both the highest and lowest quintiles for England and Wales.
The estimates for MSOAs within a LAD can be described as significantly different if the confidence intervals for the estimates do not overlap. This provides an illustration of how these estimates can be used to identify areas of relative high household poverty within a LAD.
The MSOA with the highest poverty can be isolated to examine the proportion of the remaining MSOAs that are significantly different from it. The LAD with the highest such proportion was Calderdale in Yorkshire. Figure 8 shows the estimated percentage of households in poverty (with 95% confidence intervals) for the 27 MSOAs in the Calderdale LAD. In this case, all but one of the other 26 MSOAs had a significantly lower percentage of households in poverty than that of the highest.
Figure 8: Percentage of households in poverty (after housing costs) by middle layer super output area
Calderdale, financial year ending 2014
Source: Office for National Statistics
Notes:
- Ranked by highest percentage of households in poverty.
Download this chart Figure 8: Percentage of households in poverty (after housing costs) by middle layer super output area
Image .csv .xlsOther LADs containing a similarly high proportion of MSOAs with lower poverty (AHC) compared with the highest ranked MSOA were Woking (11 out of 12), Stockport (38 out of 42) and Derby (28 out of 31). However, there are many LADs that do not show this pattern.
Nôl i'r tabl cynnwys6. What’s changed in this release?
This release provides new estimates of percentage of households in poverty for the financial year ending 2014 for middle layer super output areas (MSOAs) in England and Wales. These are model-based estimates of the proportion of households in each MSOA with an income lower than 60% of the national median.
Nôl i'r tabl cynnwys7. Quality and methodology
There is more detailed information about the method and data sources used to produce these estimates, available in the technical report released alongside the data and this statistical bulletin.
Details of the policy governing the release of new data are available in the UK Statistics Authority’s Code of Practice for Official Statistics.
Nôl i'r tabl cynnwys