Cynnwys
- Main points
- Why consider expenditure-based poverty?
- Things you need to know about this release
- Household income and expenditure across the distribution
- Characteristics of people in income and expenditure poverty
- The relationship between income and expenditure poverty
- Trends in income and expenditure poverty
- Related statistics and analysis
- References
- Annex A: Definitions
- Annex B: Equivalisation of household income and expenditure
- Annex C: Comparison with DWP figures
- Annex D: National accounts data on consumption expenditure
1. Main points
In the financial year ending (FYE) 2017, of the UK population 22.8% was considered to be in income poverty and 21.8% was deemed to be in expenditure poverty.
11.5% of the population was in both income and expenditure poverty in FYE 2017.
Households in expenditure poverty spent the highest proportion of their total expenditure on food-related items (28.8%).
17.7% of all children were deemed to be in both income and expenditure poverty in FYE 2017.
31.7% of all lone parents were considered to be in both income and expenditure poverty.
This analysis is experimental and the results presented are not official poverty statistics for the UK.
2. Why consider expenditure-based poverty?
Most research related to understanding monetary poverty and material living standards in the UK has focused on household income as a measure of monetary poverty. One of the strengths of household income as a measure is that it is a good proxy for the resources available to an individual to consume or save. Household income is also attractive as a measure as it can be directly influenced through government policy, particularly through the tax and benefits systems.
Despite this, there are a number of both theoretical and pragmatic arguments for considering household spending alongside income when measuring poverty and material living standards, more generally (see for example, Brewer and O’Dea 2017; Serafino and Tonkin, 2017; United Nations Economic Commission for Europe (UNECE), 2017).
Conceptually, consumption expenditure is thought to be a better measure of achieved living standards as it is through the consumption of goods and services that people satisfy their needs and wants over time. Supporting this argument, researchers have found a stronger relationship between consumption and subjective well-being than between income and subjective well-being (for example, Lewis, Snape and Tonkin, 2014; Meyer and Sullivan, 2011).
In addition, income tends to be more volatile than consumption and, as such, it may not adequately reflect an individual’s well-being. For example, short-term unemployment or sickness may cause a temporary reduction in income, which will not necessarily be matched by a corresponding drop in consumption or well-being. Similarly, more systematic lifetime fluctuations that lead to a reduction in income may not adversely affect consumption, as people might be spending their wealth, for example. According to Friedman’s “permanent income hypothesis” (Friedman, 1957), an individual’s consumption at any point in time is determined not just by their current income but also by their longer-term income expectations. While the permanent income hypothesis may not hold strictly, as consumption is likely to fluctuate less than income, it might be considered a better proxy of living standards (Cutler and Katz, 1991).
Beyond these theoretical arguments, there is also the practical consideration that consumption expenditure tends to be measured more accurately than income towards the lower end of the income distribution, with evidence from both the United States and UK of under-reporting of certain forms of income, such as benefits (Brewer and O’Dea, 2017, Meyer and Sullivan, 2013). This advantage of consumption expenditure may be ascribed to the fact that survey questions about household spending are usually seen as less sensitive than questions about income (with some exceptions). Furthermore, people towards the bottom of the income distribution often have multiple income sources, which makes measurement error harder to avoid.
It is important to recognise, however, that consumption expenditure data also have their limitations. From a conceptual viewpoint, the first thing to note is that consumption expenditure, which is measurable using Living Costs and Food Survey (LCFS) data, is not the same as consumption itself.
Attanasio and Pistaferri (2016) summarise why the two concepts may not always coincide. The first of these is that many durable goods can provide benefits for long periods after being purchased. This consumption may not be captured under an expenditure-based measure since expenditure surveys generally only consider payments made within a defined period. This means that levels of expenditure poverty may be exaggerated for households owning valuable assets outright. Since for most households, housing stock is the most valuable asset held, this is an important motivation behind the exclusion of housing costs in expenditure-based poverty measures.
In addition to these conceptual issues, non-response and measurement errors may also be present. For example, certain expenditure items, such as alcohol, tobacco and gambling, tend to be under-reported in surveys, due to the stigma attached to their consumption. Other potential limitations of using consumption expenditure to study poverty include questions around individual choice (particularly when higher poverty thresholds are used), as well as practical considerations such as the cost of collecting comprehensive data.
Overall, both income and consumption have their own strengths and limitations. Because of this, important insights may be obtained by considering income and consumption together when measuring poverty. This is consistent with the recommendations of the Report by the Commission on the Measurement of Economic Performance and Social Progress (Stiglitz, Sen, and Fitoussi, 2009) as well as the Organisation for Economic Co-operation and Development (OECD) Framework for Statistics on the Distri¬bution of Household Income, Consumption and Wealth (2013) and the UNECE Guide on Poverty Measurement (2017).
Nôl i'r tabl cynnwys3. Things you need to know about this release
Measuring income and expenditure poverty
There is no single agreed definition of poverty. For the purpose of this analysis, someone is described as being in income poverty if they live in a household with an income below 60% of the national median. Similarly, someone is described as being in expenditure poverty if their household has expenditure levels below 60% of median expenditure.
These are relative poverty measures that measure income or expenditure of a household compared with other households. The rationale for such an approach comes from a definition of poverty that considers individuals’ capacity to participate fully in society. As such, being at risk of poverty does not necessarily imply an absolute low standard of living.
These types of relative measure are consistent with those used in the primary source of poverty statistics in the UK, Department for Work and Pensions (DWP’s) Households below average income statistics. They are also the main form of measure used in most countries across the EU and Organisation for Economic Co-operation and Development (OECD).
Household expenditure
The expenditure measure we use includes spending on items that tend to be purchased frequently (for example, food, drink, household consumables, petrol), as well as expenses that are incurred less frequently (for example, household furnishing and appliances, other durable goods1). We exclude housing costs (rent, mortgage payments, water rates, Council Tax and so on)2 putting our expenditure measure on an “after housing costs” (AHC) basis.
Certain types of households, such as those who own their home outright, have relatively low levels of expenditure compared with those who rent or own their home with a mortgage. The latter have higher housing costs but their expenditure does not adequately reflect their consumption of housing services. The use of an AHC measure of expenditure therefore avoids incorrectly identifying owner occupiers as experiencing poverty due to their relatively low spending on housing.
Household income
Our main aim is to assess the differences between income and expenditure poverty and it is therefore important that our measures of the two are as consistent as possible. For this reason, the measure we use for income is household disposable income after housing costs (AHC). Disposable income is the amount of money that households have available for spending and saving after direct taxes (such as Income Tax, National Insurance and Council Tax) and pension contributions have been accounted for. It includes earnings from employment, private pensions and investments as well as cash benefits provided by the state.
Reflecting household size
The expenditure and income measures used in this analysis are all equivalised. Equivalisation is the process of accounting for the fact that households with many members are likely to need a higher income to achieve the same standard of living as households with fewer members. Both income and expenditure are adjusted using OECD-modified “companion” scaled developed for AHC measures in DWP’s Households below average income series.3
Data sources
Throughout this analysis, the primary data source used to derive measures of both income and expenditure poverty is the Living Costs and Food Survey (LCFS). The LCFS is used as it is the only data source to collect detailed data on both income and expenditure, thereby allowing analysis of the overlap between the two measures.
As highlighted previously, the main source of official statistics on the percentage of people living in low-income households in the UK is DWP’s annual publication Households below average income (HBAI), based on the Family Resources Survey (FRS). A comparison of median AHC disposable income and poverty rates from both the LCFS and HBAI is available in Annex C.
The FRS has a larger sample size than the LCFS, which means the HBAI measure of income poverty is often considered a stronger measure than the estimates produced from the LCFS. The FRS, however, does not have comprehensive information on household expenditure and therefore cannot be used for the type of analysis contained in this article.
Data period
Data used in this analysis are for financial years: April to March.
Notes for: Things you need to know about this release
We do not impute consumption flows from ownership of durables, like housing or cars.
For more details on how the AHC measures of income and expenditure are derived, please see Annex A.
Information on the OECD-modified “companion“ scaled is provided in Annex B.
4. Household income and expenditure across the distribution
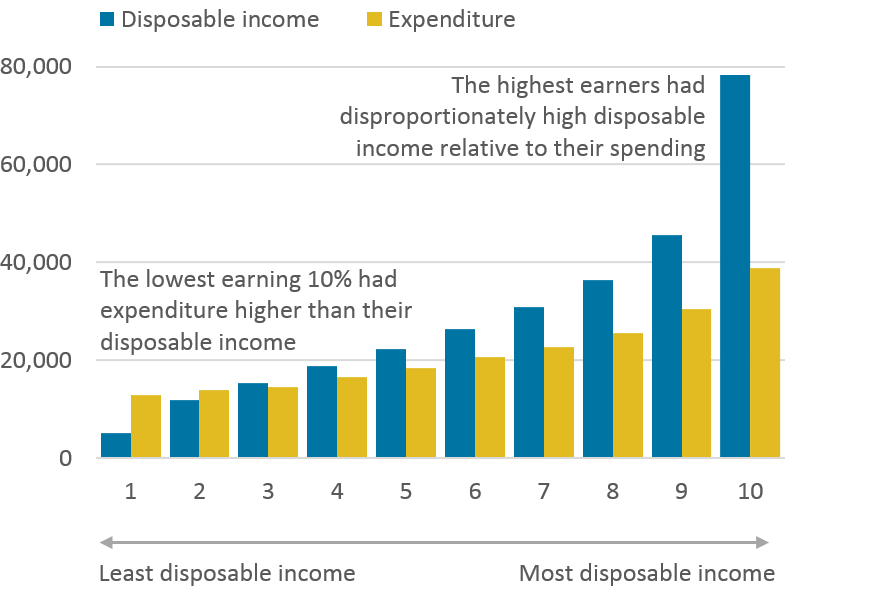
To start with, we obtain an income and expenditure distribution by ranking all households in terms of their income. Comparing disposable income with expenditure of households in the same income decile group highlights an interesting pattern. Figure 1 shows the results of this comparison.
Households in the bottom income decile spent, on average, around £12,800 in the financial year ending 2017 while their average income, as measured with Living Costs and Food Survey (LCFS) data, was only about £5,000. This is consistent with the findings from other studies, showing relatively high levels of expenditure at the bottom of the income distribution (for example, Brewer and O’Dea, 2017; Carrera, 2010). Nevertheless, part of this difference reflects likely under-reporting of income in the survey, as previously suggested.
Figure 1: Lower earners were most likely to spend beyond their means in financial year ending 2017
UK
Source: Office for National Statistics
Notes:
- All figures have been deflated to financial year ending 2017 prices using a CPIX deflator which excludes rents, maintenance repairs and water charges for the period January 1996 to June 2016.
- Both income and expenditure have been equivalised using a 'companion' scale of modified-OECD scale (see annex B).
- All figures are after housing costs (see annex A).
Download this image Figure 1: Lower earners were most likely to spend beyond their means in financial year ending 2017
.png (36.6 kB) .xlsx (10.7 kB)
Previous studies have suggested that having higher levels of expenditure relative to income may be explained by a combination of factors.
Temporary periods of low income
Some of these households may be at the bottom of the income distribution only temporarily, experiencing a short-term period of low (or even negative) earnings. Where households are experiencing temporary low-income spells, some may be able to maintain their consumption level and thereby their living standards fairly constantly, through the use of savings or borrowing. Evidence to support such explanations comes from Carrera (2010) who shows that households with high levels of expenditure relative to their income are more likely to contain someone in higher education or have a chief economic supporter who is self-employed.
Under-reporting of income toward the bottom of the distribution
As previously indicated, researchers such as Brewer and O’Dea (2017) have provided evidence to suggest that surveys are more likely to underestimate income at the lower end of the distribution than expenditure. Further evidence for this explanation comes from Department for Work and Pensions (2018), which shows that certain types of benefits tend to be under-reported in survey data. These include Working and Child Tax Credits, Pension Credit and other non-contributory benefits related to disability or care necessity.
Nôl i'r tabl cynnwys5. Characteristics of people in income and expenditure poverty
Figure 2 presents poverty rates for children, working-age adults and pensioners in the financial year ending 2017, along with overall poverty rates, based on the two poverty measures used in this analysis.
Figure 2: Breakdown of income and expenditure poverty, financial year ending 2017
UK
Source: Office for National Statistics
Download this chart Figure 2: Breakdown of income and expenditure poverty, financial year ending 2017
Image .csv .xlsPensioners appear to be the only population group who had a higher expenditure poverty rate (22.2%) compared with their income poverty rate (17.5%). This finding has been confirmed in other studies, among which Brewer and O’Dea (2017), who argue that pensioners are an interesting group to look at because those on low incomes tend to be even lower spenders.
Banks and others (1998) show that the discrepancy may be explained partly by the lack of labour market participation among retired households, since the spending needs of households out of the labour market appear to be less than those of workers. Other explanations offered in literature include heightened fears among retired households of unexpected injury or illness, or a desire to maintain wealth levels to provide an improved inheritance to relatives.
The tendency for retired households not to run down their wealth significantly is referred to as the “retirement-savings puzzle” (see Andreu and others, 2015). The distinction between consumption and expenditure is particularly important when considering retired individuals since they are likely to own a lot of durable goods, which they get a large consumption flow from, without any spending.
The poverty rate for working-age adults in terms of income, is about 1 percentage point higher than the expenditure-based poverty rate for the same population group. The difference between the two measures is quite significant for children, with an income poverty rate of 31.9% and expenditure poverty rate of 27.4%.
To better understand these differences, we look at a more detailed demographic breakdown of income and expenditure poverty rates. Figure 3 further breaks down poverty rates by employment status, number of children in a family and household composition.
Figure 3: Poverty breakdown by demographic group, financial year ending 2017
UK
Source: Office for National Statistics
Download this chart Figure 3: Poverty breakdown by demographic group, financial year ending 2017
Image .csv .xlsWhen labour market status is considered, the largest discrepancy between income and expenditure poverty rates in the financial year ending 2017 was observed for the unoccupied/other group. These are most likely stay-at-home parents, students and so on, who may have volatile income flows but are able to smooth out consumption. Those seeking employment also had a significantly higher income poverty rate (50.1%) compared with their expenditure poverty rate (36.9%). As mentioned earlier, it is reasonable to assume that this discrepancy arises because these people are relatively likely to be experiencing short episodes of low income, but are able to smooth consumption by drawing on savings or borrowing additional resources.
In terms of household composition, lone parents had the highest income poverty rate among all groups, 53.7%. The corresponding expenditure poverty figure was 37.7%. Couples without children and pensioner couples had relatively lower income poverty rates of 13% and 11.2%, respectively.
Apart from looking at the composition of income and expenditure poverty, it is interesting to see how expenditure habits of these two groups differs and how that compares with households who are not in poverty. Figure 4 presents the proportion of total after housing costs (AHC) expenditure that each of these three population groups spent on different categories.
Those who were deemed to be in income poverty had a relatively similar expenditure composition compared with those not in poverty, with the largest proportion of spending on recreation, transport, and other goods and services. For the people in income poverty, spending on food and drink represented a higher proportion of total expenditure (20%) than the corresponding figure for those not in poverty (14.6%). Individuals deemed to be in expenditure poverty, spent an even higher proportion of their expenditure on food (28.8%). This population group also spent a higher proportion on electricity, gas and other fuels, than individuals in income poverty and those who were not in any kind of poverty.
Figure 4: Share of total expenditure by category, financial year ending 2017
UK
Source: Office for National Statistics
Notes:
- Total expenditure value is based on our after housing costs measure defined earlier.
- The “Other” category includes expenditure on health, education, communication miscellaneous goods and services.
Download this chart Figure 4: Share of total expenditure by category, financial year ending 2017
Image .csv .xls6. The relationship between income and expenditure poverty
In this section, we look in more detail at the relationship between income and expenditure poverty. Table 1 splits the population into four groups: those in income poverty only, expenditure poverty only, both income and expenditure poverty, and not in poverty.
People who are deemed to be both in income and expenditure poverty have a lower median income (£9,800) than those who are in income poverty only (£11,200). Those who are in both in income and expenditure poverty also have lower median expenditure (£7,377) than those who are in expenditure poverty only (£8,590). This suggests that those who are in poverty on both measures are worse off than those experiencing poverty on a single dimension.
Table 1: Median equivalised income and expenditure for different population groups, financial year ending 2017
| £ per year | ||||
| Income poverty | Expenditure poverty | Income and expenditure poverty | Not in poverty | |
|---|---|---|---|---|
| Median income | 11,257 | 20,593 | 9,820 | 30,289 |
| Median expenditure | 15,829 | 8,590 | 7,377 | 21,508 |
| Source: Office for National Statistics | ||||
| Notes | ||||
| 1. Both income and expenditure have been equivalised using a 'companion' scale of the modified-OECD scale. | ||||
| 2. All figures are after housing costs. | ||||
Download this table Table 1: Median equivalised income and expenditure for different population groups, financial year ending 2017
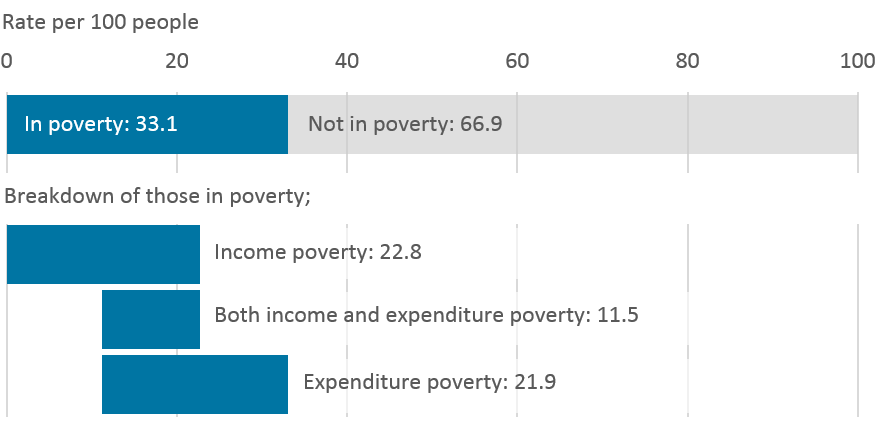
.xls (8.2 kB)Figure 5 shows the income and expenditure poverty rates for the financial year ending (FYE) 2017 and shows the two do not necessarily comprise the same individuals. In FYE 2017, there was 11.5% of the UK population identifying as both income and expenditure poor. In other words, of the approximately 14.9 million people who were in income poverty, 50% or around 7.6 million were also deemed to be in poverty, based on their spending. Similarly, of the approximately 14.3 million people in expenditure poverty in FYE 2017, there were 47% also considered to be in income poverty.
Figure 5: Overlap between income and expenditure poverty in financial year ending 2017
UK
Source: Office for National Statistics
Download this image Figure 5: Overlap between income and expenditure poverty in financial year ending 2017
.png (20.9 kB) .xlsx (9.8 kB)
Serafino and Tonkin (2017) suggest that the degree of overlap between these groups may provide valuable information in supporting the effective development and targeting of policies. For example, where a household is in income poverty but is maintaining expenditure levels (that is, those in income poverty only), this may indicate that the household is able to draw on savings or access loans either informally or formally to maintain living standards. In some cases, such behaviour may be driven by knowledge or expectation that household income will increase in the near future, for example, those starting a new job soon or students. However, many households of this type will remain vulnerable to poverty as the resources they are relying on are finite and the situation cannot continue indefinitely.
Expenditure poverty in the absence of income poverty may, in part, reflect aspects of choice on the part of the individuals. It may also suggest precautionary saving and a lack of accumulated wealth or assets, which could be used to maintain living standards if income does drop. This may occur in employment that has no guaranteed future income, for example, those in short-term employment and the self-employed.
To explore this further, Figure 6 shows household composition for those in income poverty only, expenditure poverty only, both income and expenditure poverty, and those not in poverty. Lone parents had the lowest level of expenditure poverty (6%), but the highest income and expenditure poverty rate (31.7%) compared with other groups. People with low levels of poverty on all poverty measures were couples without children as well as pensioner couples.
Figure 6: Income and expenditure poverty breakdown by household composition, financial year ending 2017
UK
Source: Office for National Statistics
Notes:
- 12:30, 5 June: Figure 6 was updated to correct a label. No data has been changed.
Download this chart Figure 6: Income and expenditure poverty breakdown by household composition, financial year ending 2017
Image .csv .xlsWhen employment status is considered (Figure 7), people deemed to be both income and expenditure poor are more likely to be sick or injured (29.7%), unoccupied/other (26.9%) or seeking employment (26.8%).
In terms of the demographic composition of poverty, poverty rates are most prevalent among children, with 17.7% of the total child population deemed to be in both income and expenditure poverty. Overall, 35.9% of the total UK population are in some form of poverty.
Figure 7: Income and expenditure poverty breakdown by employment and demographic group, financial year ending 2017
UK
Source: Office for National Statistics
Download this chart Figure 7: Income and expenditure poverty breakdown by employment and demographic group, financial year ending 2017
Image .csv .xls7. Trends in income and expenditure poverty
Before exploring how income and expenditure poverty rates have changed over time, we look at trends in median household income and expenditure (Figure 8).
While disposable income has grown by about 17% since the financial year ending (FYE) 2002, household expenditure has been rather stagnant. We see a decline, in real terms, in median household expenditure from FYE 2008 onwards, not really starting to recover until about FYE 2013. In addition, expenditure dropped in FYE 2009, while income was still rising. This may indicate households were saving more in response to the economic downturn of FYE 2008, before incomes started to fall. These two observations are broadly consistent with what national accounts data on household final consumption expenditure per head suggest happened over the same period1.
Figure 8: Median household disposable income and expenditure, financial year ending 2002 to financial year ending 2017
UK
Source: Office for National Statistics
Notes:
All figures have been deflated to financial year ending 2017 prices using a CPIX deflator which excludes rents, maintenance repairs and water charges for the period January 1996 to June 2016.
Both income and expenditure have been equivalised using a 'companion' scale of modified-OECD scale (see annex B).
All figures are after housing costs (see annex A).
Download this chart Figure 8: Median household disposable income and expenditure, financial year ending 2002 to financial year ending 2017
Image .csv .xlsFigure 9 presents the trend for both income and expenditure poverty rates. Overall, the two series are quite similar, though income-based poverty rates seem to slightly exceed expenditure-based poverty rates, in most years over the period considered. However, for both measures the levels of year-on-year change have been very modest over this period, with levels of both after housing costs (AHC) income and expenditure poverty broadly unchanged over the last 15 years.
Figure 9: Time series of income and expenditure poverty, financial year ending 2002 to financial year ending 2017
UK
Source: Office for National Statistics
Download this chart Figure 9: Time series of income and expenditure poverty, financial year ending 2002 to financial year ending 2017
Image .csv .xlsNotes for: Trends in income and expenditure poverty
- See Annex D for national accounts data.
9. References
Andreu E., Alessie R. and Abgelini V. (2015): “The retirement-savings puzzle revisited: The role of housing as a bequethable Asset”, Netspar Discussion Paper Number 10/2015-082
Banks J., Blundell R., Tanner S. (1998): “Is there a retirement-savings puzzle?”, The American Economic Review, Volume 88, Number 4
Brewer M. and O’Dea C. (2017): "Why are Households That Report The Lowest Incomes so Well-Off?", Economic Journal (October 2017)
Carrera S. (2010): “An expenditure-based analysis of the redistribution of household income”, ONS publication
Cutler D. and Katz L. (1991): “Macroeconomic performance and the disadvantaged”, Brookings Papers on Economic Activity
Department for Work and Pensions (2018): Households below average income statistics
Friedman M. (1957): “The permanent income hypothesis”, National Bureau of Economic Research
Lewis J., Snape D. and Tonkin R. (2014): “Income, Expenditure and Personal Well-being, 2011 to 2012”, ONS publication
Meyer B. and Sullivan J. (2011): “Consumption and income poverty over the business cycle”, National Bureau of Economic Research Working Paper Series, 16751
Meyer B. and Sullivan J. (2013): ”Consumption and income inequality and the great recession”, American Economic Review, Volume 103, Number 3
Meyer B., Mok W. and Sullivan J. (2015): “Household surveys in crisis”, National Bureau of Economic Research Working Paper Number 21399
Organisation for Economic Co-operation and Development (2013): OECD Framework for Statistics on the Distribution of Household Income, Consumption and Wealth
Orazio P., and Pistaferri L. (2016) "Consumption Inequality." Journal of Economic Perspectives, Volume 30, Number 2: pages 3 to 28
Stiglitz J., Sen A. and Fitoussi J. (2009): Report by the commission on the measurement of economic performance and social progress (PDF, 3.2MB)
Tonkin R. and Serafino P. (2017): “Comparing poverty estimates using income, expenditure and material deprivation”, Chapter 13 in “Monitoring social inclusion in Europe”, 2017 edition
United Nations (2017): Guide on Poverty Measurement (PDF, 8.8MB)
Nôl i'r tabl cynnwys10. Annex A: Definitions
The measure of income used in this analysis is household disposable income, which we publish annually in our publication Effects of taxes and benefits on household income, with a few adjustments that reflect the after housing costs (AHC) dimension we are focusing on.
Income AHC
Start from the standard household disposable income measure, which we publish annually in our publication Effects of taxes and benefits on household income. This measure of income takes account of benefits and direct taxes. The following housing-related costs are excluded:
gross rent and rent on second dwelling
maintenance and repair of dwelling
water rates, community water charges and council water charges, and ground rent and service charges
mortgage interest payments
structural insurance
Our measure is broadly consistent with the Households below average income (HBAI’s) definition of AHC disposable income, with the following exceptions:
rent on second dwellings is not included as a housing cost, but instead the profit on such properties is treated as investment income
maintenance and repair of dwelling is not included in housing costs
Expenditure AHC
Start from total consumption expenditure from the Living Costs and Food Survey (LCFS), which excludes mortgage interest payments, Council Tax and Northern Ireland rates. The following adjustments are then made:
take out gross rent and rent on second dwelling
take out maintenance and repair of dwelling
take out water rates, community water charges and council water charges, and ground rent and service charges
take out insurance premiums related to housing
include expenditure on licences, fines and transfers
include holiday spending
include gambling receipts as negative expenditure
Child
A dependent child is defined as an individual aged under 16 years. A person will also be defined as a child if they are 16 to 19 years old and they are:
not married nor in a civil partnership nor living with a partner
living with parents or a responsible adult
in full-time non-advanced education or in unwaged government training
Pensioner
Anyone who is of the State Pension Age at the time they were interviewed is considered to be a pensioner.
Nôl i'r tabl cynnwys11. Annex B: Equivalisation of household income and expenditure
To reflect household composition, we use an equivalisation scale (Table 2) that accounts for the after housing costs (AHC) aspect of the measures we have focused on. It is a “companion” scale that Department for Work and Pensions (DWP) use in their Households below average income (HBAI) publication when looking at AHC figures. It takes into account the fact that housing is more shareable then food, for example.
Table 2: Companion equivalisation scale for after housing costs measures
| Household member | Factor | Description |
|---|---|---|
| 1st adult | 0.58 | Much 'flatter' scale than modified OECD, to reflect lower economies of scale in non-housing consumption |
| Other 2nd adult | 0.42 | |
| 3rd adult | 0.42 | Equal to 2nd adult, as in modified OECD |
| Subsequent adults | 0.42 | Equal to 2nd adult, as in modified OECD |
| Child under 14 | 0.2 | Preserves the BHC (modified OECD) ratio of child to couple |
| Child 14 and over | 0.42 | Equal to 2nd adult, as in modified OECD |
| Source: Department for work and pensions | ||
| Notes: | ||
| 1. Both income and expenditure have been equivalised using a 'companion' scale of the modified-OECD scale. | ||
| 2. All figures are after housing costs. | ||
Download this table Table 2: Companion equivalisation scale for after housing costs measures
.xls (8.2 kB)12. Annex C: Comparison with DWP figures
Figure 10: Median equivalised household disposable income in Living Costs and Food Survey and Households below average income
UK
Source: Office for National Statistics
Notes:
- All figures have been deflated to financial year ending 2017 prices using a CPIX deflator which excludes rents, maintenance repairs and water charges for the period January 1996 to June 2016.
- Both income and expenditure have been equivalised using a 'companion' scale of modified-OECD scale (see annex).
- All figures are after housing costs.
Download this chart Figure 10: Median equivalised household disposable income in Living Costs and Food Survey and Households below average income
Image .csv .xlsMedian household incomes in the Living Costs and Food Survey (LCFS) and Households below average income (HBAI) have moved relatively closely together, with LCFS estimates slightly higher than HBAI, up until the financial year ending (FYE) 2013. Growth in LCFS figures has been somewhat stronger since FYE 2013, however, the estimated are broadly comparable.
Figure 11 shows relative income poverty measures from LCFS and HBAI since FYE 2002. The two series follow a similar pattern over time and although income poverty based on LCFS data is higher than HBAI estimates, overall, the difference seems reasonably consistent over time. The two sources appear to move quite close together in FYE 2016 and FYE 2017.
Figure 11: Income poverty in Living Costs and Food Survey and Households below average income, financial year ending 2001 to financial year ending 2017
UK
Source: Office for National Statistics
Download this chart Figure 11: Income poverty in Living Costs and Food Survey and Households below average income, financial year ending 2001 to financial year ending 2017
Image .csv .xlsThe two series follow a similar pattern over time and although income poverty based on LCFS data is higher than HBAI estimates, overall, the difference seems reasonably consistent over time.
Nôl i'r tabl cynnwys13. Annex D: National accounts data on consumption expenditure
Figure 12 shows the growth in real household final consumption expenditure per head. This shows a long-term time series from Quarter 1 (Jan to Mar) 1977 to Quarter 4 (Oct to Dec) 2017. The economic downturn of 2008 to 2009 is clearly shown in these data with a slowdown in growth in real household final consumption expenditure per head and a recovery to around 2% from 2012 onwards. The information provided in this chart is broadly consistent with survey trends in household income and expenditure we have observed in the past 15 years.