Cynnwys
- Main points
- Things you need to know about this release
- Cash RHDI increased 0.5% in the latest quarter
- Cash basis RHDI fell for the second successive year in 2017, by 0.9%
- RHDI per head fell for the second successive year, both on a cash and national accounts basis, by 1.5% and 1.1% respectively
- The cash basis household saving ratio fell to the lowest level since 2007 in 2017, to negative 0.8%
- Quality and methodology
- Acknowledgements
1. Main points
Cash basis real household disposable income (RHDI) increased by 0.5% in the latest quarter; this was a faster rate than national accounts RHDI, due to the inclusion and decrease of financial intermediation services indirectly measured (FISIM).
In 2017, cash-based RHDI fell by 0.9%; this was the second successive year of decline.
RHDI per head also fell for the second consecutive year, both on a national accounts and cash basis; the 1.5% decline in 2017 makes it the first successive annual cash basis RHDI per head fall since 2011.
In 2017, the cash basis households saving ratio fell to its lowest level since 2007, negative 0.8%.
2. Things you need to know about this release
This bulletin provides Experimental Statistics on the impact of removing "imputed" transactions from real household disposable income (RHDI) and the saving ratio to better represent the economic experience of UK households. It is an update to data for the experimental publication Alternative measures of UK households’ income and saving: October to December 2017, which was published on 12 April 2018. These data estimate disposable income and the saving ratio less the transactions that are imputed and unobserved by households. The following section, as well as Section 7, explain the removal of such transactions in greater detail.
This bulletin compares experimental cash-based measures of RHDI and the saving ratio with the internationally comparable national accounts defined methodology, as published in the Quarterly sector accounts, UK: January to March 2018 on 29 June 2018.
Why do we estimate cash measures of RHDI and the saving ratio?
Estimates of RHDI and the saving ratio published in the Quarterly sector accounts include transactions that are not directly observed by households. For example, imputed rental represents the value of housing services that owner-occupiers derive from their homes. This is the amount that they would have to pay in rental to achieve the same consumption of housing services. While this concept is important when measuring economic activity and in like-for-like international comparisons, it is not expenditure (or income) directly observed by homeowners. As a result, the national accounts measure of RHDI can differ from the perceived experience of households.
We therefore consider “cash basis RHDI”. This measure removes imputed rental and other imputed transactions resulting in a measure of RHDI that is a closer representation of disposable income as measured by social surveys. This is mainly achieved by following guidance from the Organisation for Economic Co-operation and Development Framework for Statistics on the Distribution of Household Income, Consumption and Wealth and the United Nations Economic Commission for Europe (UNECE) Canberra Group Handbook on Household Income Statistics.
We also consider a “cash basis saving ratio”. This measure removes imputed transactions from the “use of disposable income” account. For example, the adjustment for the change in pension entitlements, imputed rental and financial intermediation services indirectly measured (FISIM) are both removed from the national accounts measure of final consumption expenditure. Their removals result in a measure of gross saving that reflects households’ saving (excluding pension contributions) in the respective quarter or year.
Estimates within this release
Data within this bulletin are estimated in current prices (also called nominal terms), except for cash basis RHDI, which is estimated by deflating gross disposable income using the cash-based household final consumption expenditure implied deflator. This cash-based deflator excludes the effect of price changes that are not directly experienced by households, that is, imputed rentals of housing and FISIM. Cash basis RHDI therefore better reflects the real purchasing power of households in terms of the quantity of goods and services they would be able to purchase if observed prices remained constant over time.
Current price series are expressed in terms of the prices during the time period being estimated. In other words, they describe the prices recorded at the time of production or consumption and include the effect of price inflation over time. RHDI, on the other hand, is a measure of the real purchasing power of households’ incomes and it enables users to make comparisons of households’ disposable income over time.
All data in this bulletin are adjusted for seasonality, unless otherwise stated. Seasonal adjustment removes seasonal or calendar effects from data to enable more meaningful comparisons over time.
The Population estimates for UK, England and Wales, Scotland and Northern Ireland used in this release are those published on 22 June 2017 and the population projections used are those published on 26 October 2017.
Revisions within this release
This bulletin includes new data for the latest available quarter, Quarter 1 (Jan to Mar) 2018. It also includes revisions from Quarter 1 (Jan to Mar) 1997 onwards, due to improvements introduced as part of the National Accounts, The Blue Book: 2018 to be published on 31 July 2018. The Blue Book is an annual publication that introduces methodological, source, system and many other types of improvements to ensure we continue to produce the best possible estimates for our users.
These revisions reflect better or more complete source data and methodological improvements that have been introduced in line with the National Accounts Revisions Policy: updated December 2017.
The indicative impact of these changes on the sector and financial accounts are outlined in the National Accounts articles: Detailed assessment of changes to sector and financial accounts, 1997 to 2016.
The major points from this that affect cash-basis measures are detailed in the following paragraphs.
The growth rate of cash-basis real household disposable income (cash RHDI) was revised down in 2016 and 2017, falling from 0.2% and negative 0.1% to negative 0.3% and negative 0.9% respectively. This makes it the first year of successive negative RHDI growth since 2011 when it was negative 1.7%.
The cash-basis household saving ratio in 2017 has been revised down from 0.9% to negative 0.8%; making it the first negative cash-basis saving ratio for 10 years. This was due to a £5.5 billion downward revision to total wages and salaries received by households, reflecting updated data sources.
Cash-basis RHDI per head growth was revised down in 2016 and 2017, from negative 0.7% and negative 0.3% to negative 1.1% and negative 1.5% respectively. This makes cash RHDI per head growth in 2017 the lowest since 2011 where it was negative 2.4%.
Nôl i'r tabl cynnwys3. Cash RHDI increased 0.5% in the latest quarter
Cash basis real household disposable income (RHDI) grew by 0.5% in Quarter 1 (Jan to Mar) 2018, quarter on previous quarter, and national accounts RHDI grew by 0.3%. Gross disposable household income (GDHI) contributed 1.4 percentage points to growth in both measures of RHDI, but was partially offset by a 0.9 percentage points impact of inflation on a cash basis, and a 1.1 percentage points impact on a national accounts basis (see Section 7 for the calculation of cash basis RHDI).
The large impact of inflation (which intensified in the latter half of 2017) on GDHI was consistent in both measures, as it largely offset the increase in GHDI. The removal of financial intermediation services indirectly measured (FISIM) from the national accounts households’ deflator reduces the impact of inflation on cash basis RHDI growth, as FISIM increased by £1 billion in Quarter 1 2018.
Nôl i'r tabl cynnwys4. Cash basis RHDI fell for the second successive year in 2017, by 0.9%
Both cash basis and national accounts real household disposable income (RHDI) declined for the second successive year in 2017. This was due largely to the impact of inflation on gross disposable household income (GDHI), as shown in Figure 1. However, on a quarter on same quarter a year ago basis, both measures of RHDI increased in Quarter 1 (Jan to Mar) 2018, due mainly to a large increase in employment over the year, which led to an increase in total wages and salaries throughout 2017.
Figure 1: Annual growth in Cash Real Household Disposable Income and the impact of inflation (%), 2007 to 2017
UK
Source: Office for National Statistics
Download this chart Figure 1: Annual growth in Cash Real Household Disposable Income and the impact of inflation (%), 2007 to 2017
Image .csv .xlsOn a quarter on same quarter a year ago basis, both measures of RHDI increased in Quarter 1 2018. Cash RHDI increased by 2.4% and national accounts RHDI grew by 2%; its fastest rate in two years (since Quarter 4 (Oct to Dec) 2015). The main reason for this increase was growth in total wages and salaries throughout 2017, as employment levels reached record highs: an estimated 396,476 more people over the age of 16 years were in employment in the latest quarter compared with the same quarter a year ago and almost two-thirds of these were in full-time work.
Cash basis RHDI declined by 0.9% from the previous year, in 2017, its largest fall since 2011. Wages and salaries growth was the largest upward pressure to annual cash basis RHDI growth, contributing 2.3 percentage points to growth. However, this was more than offset by the increased impact of inflation, of 2.4 percentage points, and the increased impact of taxes on income and wealth, of 1.0 percentage point. The total value of contributions can be seen in Figure 2.
Figure 2: Annual contributions to growth in Cash Real Household Disposable Income, 2007 to 2017
UK
Source: Office for National Statistics
Download this chart Figure 2: Annual contributions to growth in Cash Real Household Disposable Income, 2007 to 2017
Image .csv .xlsRevisions to cash basis RHDI
Cash RHDI growth in 2017 was revised down from negative 0.1% to negative 0.9% while 2016 was also revised down, from positive 0.2% to negative 0.3%. The downward revisions to cash basis RHDI growth in both years were as a result of wages and salaries being revised down by £5.2 billion in 2016 and £10.6 billion in 2017. National accounts RHDI also fell in 2017, by 0.5%, which mirrored the trend of cash basis RHDI; declining for the second year in a row.
Nôl i'r tabl cynnwys5. RHDI per head fell for the second successive year, both on a cash and national accounts basis, by 1.5% and 1.1% respectively
Real household disposable income (RHDI) per head is calculated by dividing RHDI by the population estimates and projections, which are outlined in Section 2 of this bulletin. Both cash basis and national accounts RHDI per head fell for the second consecutive year; this has only occurred once on a cash basis prior to 2017, in 2011, and means households have experienced a continuous decline in their real purchasing power since 2016.
However, quarterly data show an increase in RHDI per head on both a cash and national accounts basis. In Quarter 1 (Jan to Mar) 2018, RHDI per head was higher than both the same quarter from the previous year (Quarter 1 2017; Figure 3), and the previous quarter (Quarter 4 (Oct to Dec) 2017). This is largely attributable to record levels of employment.
In the latest quarter, Quarter 1 (Jan to Mar) 2018, cash basis RHDI per head grew by 0.3%, faster than the national accounts measure, which grew by 0.2%, quarter on previous quarter.
Cash RHDI per head increased by 1.8% in Quarter 1 2018 compared with the corresponding quarter of the previous year (Quarter 1 2017) (Figure 3). This was largely attributable to the increase in growth in total wages and salaries throughout 2017 as employment levels reached record highs. National accounts RHDI per head also increased from the corresponding quarter a year ago, by 1.4%.
As can be seen in Figure 3, the cash measure had lagged behind the national accounts measure for six quarters (since Quarter 3 (July to Sept) 2016), and for the first time since then grew at a faster rate in Quarter 1 2018. This was due to a £0.7 billion decrease in the value of imputed transactions in the national accounts measure of gross disposable household income (GDHI – which are excluded from the cash basis RHDI). Table 1 and Figure 6 (in Section 7) explain the changes in these transactions further.
Figure 3: Comparison of cash and National Accounts real household disposable income per capita, quarter on corresponding quarter a year ago, 2007 to 2017
UK
Source: Office for National Statistics
Notes:
- Q1 refers to Jan to Mar, Q2 refers to Apr to June, Q3 refers to July to Sept, Q4 refers to Oct to Dec.
Download this chart Figure 3: Comparison of cash and National Accounts real household disposable income per capita, quarter on corresponding quarter a year ago, 2007 to 2017
Image .csv .xlsRevisions to cash RHDI per head
In 2017, cash basis RHDI per head growth was revised down, from negative 0.7% to negative 1.5%, after incorporating methodological and system improvements from The Blue Book 2018. This followed a decline of 1.1% in 2016, so RHDI per head declined for the second year in a row, which has only occurred once prior to 2017, in 2011, when it declined by 2.4%. The national accounts RHDI per head is consistent with the cash basis measure, declining for the second successive year in 2017, by 1.0% in 2016 and 1.1% in 2017.
Nôl i'r tabl cynnwys6. The cash basis household saving ratio fell to the lowest level since 2007 in 2017, to negative 0.8%
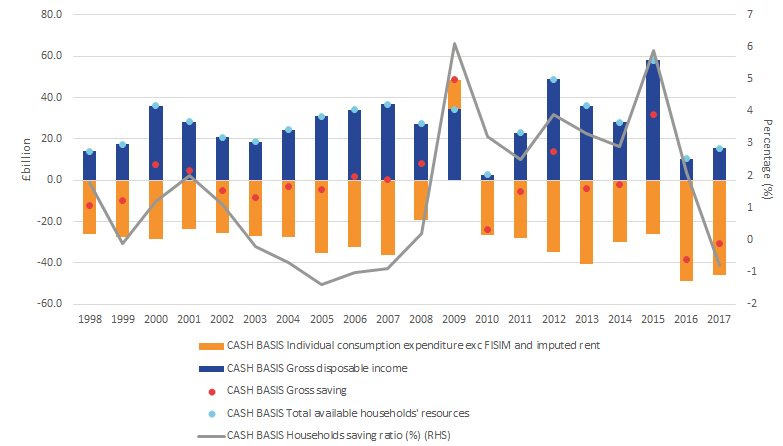
The cash basis saving ratio fell to its lowest level since 2007, and the national accounts basis saving ratio fell to the lowest on record. This was driven primarily by an increase in consumer spending and a sharp decline in gross savings (Figure 4).
As in 2016, an increase in consumer spending led to the decline in the saving ratio in 2017. Consumption expenditure increased by 4.6%, decreasing the money households had available to save, and thus the cash basis saving ratio (see Figure 4). Gross savings fell sharply, to negative £8.4 billion, which was the lowest level since 2005 and the first negative level since 2007, creating the two largest declines in gross savings by households on record, with a drop of £68.9 billion between 2015 and 2017. The increase in spending and consequent decline in the amount available to save has therefore driven the fall in the cash basis saving ratio.
Figure 4: Annual cash basis household saving ratio and its components, 1998 to 2017
UK
Source: Office for National Statistics
Notes:
- Please note: 4 July 2018, 15:50 - the data for the chart were added.
Download this image Figure 4: Annual cash basis household saving ratio and its components, 1998 to 2017
.png (32.5 kB) .xls (49.2 kB)
Additionally, the cash basis saving ratio fell quarter on previous quarter, to negative 0.7% in Quarter 1 (Jan to Mar) 2018, which marks the fifth consecutive quarter of negative saving ratio. The main reason for this was the negative 3.1 percentage point contribution of cash basis household expenditure.
The national accounts saving ratio also fell in the latest quarter, Quarter 1 2018, by 0.4 percentage points, to 4.1%, which is the third lowest since records began in 1963.
The difference between the two measures of saving ratio can be attributed to the value of transactions removed, or included in the case of financial intermediation services indirectly measured (FISIM), from the national accounts measure of household income and saving. As seen in Figure 5, the main positive contributor to the difference between the two measures is the decrease in FISIM on loans. FISIM on loans is essentially the service charge that clearing houses, often banks, pass onto households when they take out loans to cover any risk of default.
Figure 5: Contributions of transactions removed from the cash basis saving ratio but included in the National Accounts saving ratio, 2010 to 2017
UK
Source: Office for National Statistics
Notes:
- Whereas other transactions are removed from the National Accounts to calculate cash-based measures, this transaction is included.
Download this chart Figure 5: Contributions of transactions removed from the cash basis saving ratio but included in the National Accounts saving ratio, 2010 to 2017
Image .csv .xlsRevisions to cash saving ratio
In 2017, the cash basis saving ratio was revised down from the previous estimate of 0.9%. This revision was due to a £5.5 billion downward revision to total wages and salaries received by households, reflecting updated data sources. The decrease in the cash basis saving ratio is consistent with the national accounts saving ratio in 2017, the national accounts basis falling to a record low of 4.1%. However, unlike the cash basis saving ratio, the national accounts saving ratio has remained positive, with a negative saving ratio implying that households spent more than they received for a given period.
Due to changes made in The Blue Book 2018, there were downward revisions to the saving ratio throughout 2017, resulting in five consecutive quarters of negative growth. The most notable revision to the cash basis saving ratio was in Quarter 4 (Oct to Dec) 2017, when it was revised down from 1.4% to negative 0.9%. The fall was due to a combination of a £1.8 billion downward revision to wages and salaries, and household spending increasing by £3.4 billion.
Nôl i'r tabl cynnwys7. Quality and methodology
This is an experimental product and we are continually reviewing the methodology used to produce the cash measures of real household disposable income (RHDI) and the saving ratio as well as how we present the product. Following user feedback, we have added the time series (1997 onwards) of transactions removed from the cash-based measures of RHDI and the saving ratio in the Alternative measures of RHDI and saving ratio. We hope this will make it easier for users to follow through the methodology using a single dataset.
How do we estimate cash measures of RHDI?
Real household disposable income (RHDI) is a measure of the real purchasing power of household income, in terms of the physical quantity of goods and services they would be able to purchase if prices remained constant over time. It is calculated using the national accounts gross disposable household income (GDHI; calculated in current prices) and adjusting it to remove the effects of inflation.
GDHI on a national accounts basis is calculated as total income received from wages (and the self-employed), pension contributions, social benefits and net property income, less taxes on income and wealth. The income earned on financial assets, such as interest and dividends, plus the income received from allowing other institutional units to use non-produced assets (rent on land) is known as property income. It is essentially income made on investments, as opposed to income from property (for example, dwellings) as the name may suggest.
This differs from the cash basis measure, where we remove transactions that are not directly observed by households, to better reflect the conditions they are experiencing.
There are 11 items, that are or include imputed transactions, included in the national accounts calculation of GDHI but excluded from the cash measure of GDHI. These are:
- B.2g (resource): Gross operating surplus
- D.12 (resource): Employers’ social contributions
- P.119 (resource): (Plus) Financial intermediation services indirectly measured (FISIM)
- D.442 (resource): Property income payable on pension entitlements
- D.4432 (resource): Investment income attributable to collective investment fund shareholders – retained earnings
- P.119 (use): (Less) Financial intermediation services indirectly measured (FISIM)
- D.612 (resource): Employers’ imputed social contributions
- D.72 (resource): Non-life insurance claims
- D.611 (use): Employers’ actual social contributions
- D.612 (use): Employers’ imputed social contributions
- D.614 (use): Households’ social contribution supplements
Within the national accounts, there are accounting identities, which mean that the values of some of the previous transactions net to zero:
- Employers’ social contributions (D.12r) is equal and opposite to the sum of Employers’ actual social contributions (D.611u) and Employers’ imputed social contributions (D.612u)
- Income payable on pension entitlements (D.442r) is equal and opposite to Households’ social contributions supplements (D.614u)
Therefore, only the removal of the following six transactions explains the differences between GDHI on a cash basis and a national accounts basis:
- B.2g (resource): Gross operating surplus
- P.119 (resource): (Plus) Financial intermediation services indirectly measured (FISIM)
- D.4432 (resource): Investment income attributable to collective investment fund shareholders – retained earnings
- P.119 (use): (Less) Financial intermediation service indirectly measured (FISIM)
- D.612 (resource): Employers’ imputed social contributions
- D.72 (resource): Non-life insurance claims
Once we have calculated GDHI on a cash basis, we use a deflator to remove the effect of price inflation and price changes observed by households to calculate real household disposable income (RHDI) on a cash basis. Previously, GDHI on a cash basis was deflated by using the national accounts household final consumption expenditure implied deflator. The deflator used now is the national accounts household expenditure deflator less imputed rental and financial intermediation services indirectly measured (FISIM). This cash-based deflator represents more closely price changes experienced by households.
How do we estimate cash measures of the saving ratio?
The saving ratio estimates the amount of money households have available to save (gross saving) as a percentage of their gross disposable income.
To estimate cash measures of the saving ratio, gross saving is calculated as households’ total available resources (that is, GDHI) less household consumption (expenditure on goods and services for consumption). This differs from the national accounts calculations, in which pension accumulations are added to total available resources.
Household consumption (final consumption expenditure) on a cash basis is calculated by subtracting the following imputed transactions from the national accounts measure of final consumption expenditure:
- imputed rental
- financial intermediation services indirectly measured (FISIM)
The saving ratio on a cash basis is, therefore, gross saving on a cash basis expressed as a percentage of GDHI on a cash basis (which is equal to the cash measure of total available resources). The difference between the national accounts saving ratio and the cash basis saving ratio is caused by the value of the transactions excluded from the calculation of gross disposable household income (see Figure 5) and the transactions removed from national accounts gross saving.
Table 1 presents the changes in the values of transactions that are included in the calculation of the saving ratio on a national accounts basis, but are excluded from the saving ratio on a cash basis. The exclusion of these transactions (and the changes in the value of these transactions) explains the difference between the cash measure and national accounts measure of the saving ratio, in 2017.
Table 1: Change in the value of transactions removed from the National Accounts methodology to calculate the cash measure of gross disposable household income and the saving ratio, UK
| 2017 | ||
| Transaction removed | CDID | Change, annual (2016 to 2017) , £ billion |
|---|---|---|
| Gross operating surplus (B.2g) | CAEO | 754 |
| Employers’ social contributions* (D.12r) | DTWP | 16366 |
| (Plus) Financial Intermediation Services Indirectly Measured (FISIM) (P.119r) | CRNC | -2006 |
| Investment income payable on pension entitlements* (D.442r) | KZL5 | -9225 |
| Collective investment fund shareholders - Retained earnings (D.4432r) | MN7M | 260 |
| (Less) Financial Intermediation Services Indirectly Measured (FISIM) (P.119u)1 | CRNB | 3819 |
| Employers’ imputed social contributions (D.612r) | L8RQ | -37 |
| Non-life insurance claims (D.72r) | RNLU | 1928 |
| Employers’ actual social contributions* (D.611u) | L8NM | 11051 |
| Employers’ imputed social contributions* (D.612u) | MA4B | 5315 |
| Households’ social contribution supplements* (D.614u) | L8QA | -9225 |
| Adjustment for the change in pension entitlements (D.8r) | RNMB | -1169 |
| Imputed rental for housing (removed from final consumption expenditure on a cash basis) | GBFJ | 5700 |
| Financial Intermediation Services Indirectly Measured (FISIM) (removed from final consumption expenditure on a cash basis) | C68W | -1286 |
| Source: Office for National Statistics | ||
| Notes: | ||
| 1. Whereas other transactions are removed from the National Accounts to calculate cash-based measures, this transaction is included. | ||
Download this table Table 1: Change in the value of transactions removed from the National Accounts methodology to calculate the cash measure of gross disposable household income and the saving ratio, UK
.xls (38.4 kB)
Figure 6: Nominal contributions to gross disposable household income on a National Accounts basis by transactions excluded from the cash-based measure, year on previous year, £million, 2007 to 2017
UK
Source: Office for National Statistics
Notes:
- Whereas other transactions are removed from the Nation Accounts to calculate cash-based measures, this transaction is included.
Download this chart Figure 6: Nominal contributions to gross disposable household income on a National Accounts basis by transactions excluded from the cash-based measure, year on previous year, £million, 2007 to 2017
Image .csv .xls8. Acknowledgements
We continue to welcome feedback from users on the future content of this bulletin and publication tables and are particularly interested to know how you make use of these data to inform your work. Please email us at sector.accounts@ons.gov.uk.
We also maintain an email subscription list informing interested people when there are planned changes to the bulletin. If you wish to subscribe to this list, please email us at sector.accounts@ons.gov.uk with “subscribe” as the subject line.
The author, Michael Rizzo, would like to express his thanks to Shyam Dhokia at Office for National Statistics for his contributions to this work.
Nôl i'r tabl cynnwys