Cynnwys
- Main points
- Things you need to know about this release
- Why do we estimate cash measures of RHDI and the saving ratio?
- How do we estimate cash measures of RHDI and the saving ratio?
- How does RHDI on a cash basis now compare with RHDI on a national accounts basis?
- A fall in taxes on income and wealth boosted cash RHDI growth
- The households saving ratio on a cash basis bounced back from negative territory in Quarter 1 2017 to 1.1% in Quarter 2 2017
- Why did the households saving ratio on a cash basis rise by more than the national accounts households saving ratio?
1. Main points
- From this article onwards, the households and non-profit institutions serving households (NPISH) sector has been disaggregated following methodological changes in Blue Book 2017.
- Real households disposable income (RHDI) on a cash basis increased by 2.1% in Quarter 2 (Apr to June) 2017; the fastest quarter on quarter growth since Quarter 4 (Oct to Dec) 2014.
- The main contributors to the rise in “cash” RHDI were wages and salaries and net current taxes on income and wealth; the latter contributing positively to cash RHDI for the first time since Quarter 2 2016 as a result of a fall in taxes on income following a spike in Quarter 1 (Jan to Mar) 2017.
- In Quarter 2 2017, the households saving ratio on a cash basis increased to 1.1% from negative 0.7% in the previous quarter (which implies that households spent slightly less than they earned in income during the latest quarter).
- As a result of Blue Book 2017 methods changes, Quarter 1 2017 was the only quarter since Quarter 1 2008 with a negative households saving ratio; this is in contrast to three consecutive quarters of negative households and NPISH saving ratio previously published; this was mainly due to improvements in the way the dividend income by the self-employed is measured.
2. Things you need to know about this release
This article provides an update to data for the experimental Alternative measures of UK real households disposable income and the saving ratio: Jan to Mar 2017, which was published on 14 July 2017. These data estimate disposable income and the saving ratio less the transactions that are imputed and unobserved by households.
This article compares experimental cash-based measures of real households disposable income and the saving ratio with the internationally comparable national accounts defined methodology, as published in the Quarterly Sector Accounts on 29 September 2017.
From 29 September 2017, the UK Economic Accounts now presents separate estimates for the households sector and the non-profit institutions serving households (NPISH) sector. Previously, these two sectors were presented as though they were one sector, households and NPISH. Within this article, a separate estimate will be presented for households (that is, for real households disposable income and the households saving ratio). This work is part of the scope of methodological improvements being introduced as part of “UK National Accounts: The Blue Book: 2017 edition” due to be published on 31 October 2017.
We published an article on 21 August 2017 to inform users of the indicative impact to the main non-financial and financial accounts estimates being introduced before revised figures for the UK National Accounts were published on 29 September 2017. Within this article, we published an indicative households only “cash” saving ratio, which shows the impact of removing NPISH data from the transactions included in the current “cash basis” methodology.
This article will make comparisons against the previous households and NPISH “cash” measures to show the separation effects of the two sectors. However, from December 2017 this article will focus on the “cash” measures for the households sector only.
This is an experimental product and we are reviewing the methodology used to produce the cash measures of real households disposable income and the saving ratio. We welcome feedback from users about the future content of this article and publication tables and are particularly interested to know how you make use of these data to inform your work. Please email us with any feedback at sector.accounts@ons.gov.uk
Estimates within this release
This article includes new data for the latest available quarter, Quarter 2 (Apr to June) 2017. It also includes revisions from 1997, reflecting many methodological improvements following the National Accounts Revisions Policy.
Data within this article are estimated in current prices (also called nominal terms), with the exception of real households (and households and NPISH) disposable income (RHDI), which is estimated by deflating gross disposable income using the households (and households and NPISH) final consumption expenditure implied deflator. This deflator is used to remove the effect of price inflation to better reflect the real purchasing power of households in terms of the quantity of goods and services they would be able to purchase if prices remained constant over time.
Current price series are expressed in terms of the prices during the time period being estimated. In other words, they describe the prices recorded at the time of production or consumption and include the effect of price inflation over time. RHDI is a measure of the real purchasing power of households’ incomes, and it enables users to make comparisons of households’ disposable income over time.
All data in this article are adjusted for seasonality, unless otherwise stated. Seasonal adjustment removes seasonal or calendar effects from data to enable more meaningful comparisons over time.
Nôl i'r tabl cynnwys3. Why do we estimate cash measures of RHDI and the saving ratio?
Estimates of real households disposable income (RHDI) and the saving ratio published in the Quarterly Sector Accounts include transactions that are not directly observed by households.
For example, imputed rental represents the value of housing services that owner-occupiers derive from their homes. This is the amount that they would have to pay in rental to achieve the same consumption of housing services. Whilst this concept is important when measuring economic activity and in like-for-like international comparisons, it is not expenditure (or income) directly observed by homeowners. As a result, the national accounts measure of RHDI can differ from the perceived experience of households.
We therefore consider “cash RHDI”. This measure removes imputed rental and other imputed transactions resulting in a measure of RHDI that is a closer representation of disposable income as measured by social surveys. This is mainly achieved by following guidance within the Organisation for Economic Co-operation and Development Framework for Statistics on the Distribution of Households Income, Consumption and Wealth and the United Nations Economic Commission for Europe (UNECE) Canberra Group Handbook on Household Income Statistics.
We also consider a “cash” saving ratio. This measure removes imputed transactions from the use of disposable income account (the adjustment for the change in pension entitlements as well as imputed rental and financial intermediation services indirectly measured (FISIM) from the national accounts measure of final consumption expenditure), resulting in a measure of gross saving that reflects households’ saving (excluding pension contributions) in the respective quarter or year.
Nôl i'r tabl cynnwys4. How do we estimate cash measures of RHDI and the saving ratio?
To calculate gross disposable income (GDI), we have to work through the allocation of primary income account and secondary distribution of income account of the households sector, adding up all the resources and subtracting all the uses from the two accounts. To calculate GDI on a cash basis, we exclude the imputed resources and uses in the allocation of primary income account and secondary distribution of income account from this calculation.
There are 11 transactions that are included in the national accounts calculation of GDI, but are excluded from the cash measure of GDI. These are:
- B.2g (resource): Gross operating surplus
- D.12 (resource): Employers’ social contributions
- P.119 (resource): (Plus) Financial Intermediation Services Indirectly Measured (FISIM)
- D.442 (resource): Property income payable on pension entitlements
- D.4432 (resource): Investment income attributable to collective investment fund shareholders – retained earnings
- P.119 (use): (Less) Financial Intermediation Services Indirectly Measured (FISIM)
- D.612 (resource): Employers’ imputed social contributions
- D.72 (resource): Non-life insurance claims
- D.611 (use): Employers’ actual social contributions
- D.612 (use): Employers’ imputed social contributions
- D.614 (use): Households’ social contribution supplements
Within the national accounts there are accounting identities, which mean that the values of some of the previously mentioned transactions net to zero:
- Employers’ social contributions (D.12r) is equal and opposite to the sum of Employers’ actual social contributions (D.611u) and Employers’ imputed social contributions (D.612u)
- Income payable on pension entitlements (D.442r) is equal and opposite to Households social contributions supplements (D.614u)
Therefore, only the removal of the following six transactions explains the differences between gross disposable income on a cash basis and a national accounts basis:
- B.2g (resource): Gross operating surplus
- P.119 (resource): (Plus) Financial Intermediation Services Indirectly Measured (FISIM)
- D.4432 (resource): Investment income attributable to collective investment fund shareholders – retained earnings
- P.119 (use): (Less) Financial Intermediation Service Indirectly Measured (FISIM)
- D.612 (resource): Employers’ imputed social contributions
- D.72 (resource): Non-life insurance claims
Once we have calculated GDI, we use the households final consumption expenditure implied deflator to remove the effect of price changes to calculate real household disposable income (RHDI).
The saving ratio estimates the amount of money households have available to save (known as gross saving) as a percentage of their total disposable income (known as total available resources).
To calculate the saving ratio, we must first calculate gross saving. Within the national accounts, gross saving is calculated by subtracting final consumption expenditure from total available resources, where total available resources are the sum of GDI and the adjustment for the change in pension entitlements. The adjustment for the change in pension entitlements is excluded from the cash measure of the saving ratio as it takes into account pension entitlements that are not accessed at the present time. Therefore, on a cash basis, gross saving is calculated by subtracting final consumption expenditure on a cash basis from GDI on a cash basis.
Final consumption expenditure on a cash basis is calculated by subtracting the following from the national accounts measure of final consumption expenditure, to ensure that we are removing imputed transactions consistently from both resources and uses where appropriate:
- imputed rental
- financial intermediation services indirectly measured (FISIM)
The saving ratio on a cash basis is then gross saving on a cash basis expressed as a percentage of GDI on a cash basis (which is equal to the cash measure of total available resources).
Nôl i'r tabl cynnwys5. How does RHDI on a cash basis now compare with RHDI on a national accounts basis?
In Quarter 2 (Apr to June) 2017, real households disposable income (RHDI) on a cash basis increased by 2.1%; this was faster than RHDI on a national accounts basis, 1.6%, illustrated in Figure 1. This was RHDI on a cash basis’ fastest growth since Quarter 4 (Oct to Dec) 2014 (2.9%).
As a result of Blue Book 2017 changes, including the separation of the households and non-profit institutions serving households (NPISH) accounts and other method changes, RHDI on a cash basis follows RHDI on a national accounts basis much more closely.
Whereas the previously published real households and NPISH disposable income on a cash basis was said to have fallen for three consecutive quarters from Quarter 3 (July to Sept) 2016, RHDI on a cash basis only fell in two quarters from Quarter 4 (Sept to Dec) 2016 to Quarter 1 (Jan to Mar) 2017; as seen in Figure 1.
New data sources and methods have caused this large upward revision in households sector income and, in consequence, a downward revision to non-financial corporation sector income. More information on this can be found in a previous article, Detailed assessment of changes to sector and financial accounts, 1997 to 2015. In particular, it highlights how the accounts better capture the income of the self-employed who have incorporated and receive income as dividends.
Figure 1: RHDI growth rates on a cash basis, national accounts basis and previously published households and NPISH cash basis, seasonally adjusted, chained volume measures, percentage
Quarter 1 (Jan to Mar) 2010 to Quarter 2 (Apr to June) 2017
Source: Office for National Statistics
Download this chart Figure 1: RHDI growth rates on a cash basis, national accounts basis and previously published households and NPISH cash basis, seasonally adjusted, chained volume measures, percentage
Image .csv .xls6. A fall in taxes on income and wealth boosted cash RHDI growth
The rise in cash RHDI can be analysed in nominal terms by breaking down its main components. The rise in Quarter 2 2017 was due to a rise in nominal gross disposable income on a cash basis of £6.2 billion (2.4%).
This rise in nominal gross disposable income on a cash basis was primarily due to a fall in taxes on income and wealth of £2.6 billion, and a rise in wages and salaries of £2.0 billion.
The total value of the transactions excluded in the calculation of gross disposable income (GDI) on a cash basis was negative £0.2 billion; meaning that these excluded transactions had a negative effect on GDI on a national accounts basis. Non-life insurance claims was the main contributor, falling £0.3 billion in Quarter 2 2017.
Although RHDI on a cash basis grew at a faster rate than RHDI on a national accounts basis in the latest quarter, it must be noted that the latter is £59.1 billion greater than the former. In other words, RHDI on a cash basis shows households to be worse off, on aggregate, than the national accounts RHDI suggests.
Nôl i'r tabl cynnwys7. The households saving ratio on a cash basis bounced back from negative territory in Quarter 1 2017 to 1.1% in Quarter 2 2017
As seen in Figure 2, the households saving ratio on a cash basis rose to 1.1% in Quarter 2 (Apr to June) 2017 from negative 0.7% in Quarter 1 (Jan to Mar) 2017.
Figure 2: UK National Accounts households saving ratio and households saving ratio on a cash basis
Quarter 1 (Jan to Mar) 1997 to Quarter 2 (Apr to June) 2017
Source: Office for National Statistics
Notes:
- Q1 refers to Quarter 1 (Jan to Mar), Q2 refers to Quarter 2 (Apr to June), Q3 refers to Quarter 3 (July to Sept) and Q4 refers to Quarter 4 (Oct to Dec).
Download this chart Figure 2: UK National Accounts households saving ratio and households saving ratio on a cash basis
Image .csv .xlsA negative saving ratio on a cash basis, as seen in Quarter 1 2017, implies that households spent more than they earned in income during that quarter.
Quarter 1 2017 was the first quarter in which the households saving ratio fell below zero since Quarter 1 (Jan to Mar) 2008. This is in contrast with the previously published households and non-profit institutions serving households (NPISH) savings ratio on a cash basis, which saw 10 quarters below zero during the same period; most notably, three consecutive quarters of negative growth from Quarter 3 2016.
The rise in the saving ratio on a cash basis in Quarter 2 2017 reflects a large rise in total available resources on a cash basis (also as a result of a fall in current taxes on income and wealth) of £6.2 billion and off set by a small rise in final consumption expenditure on a cash basis of £1.4 billion. This resulted in a rise in gross saving on a cash basis of £4.8 billion. This is the largest rise in gross saving on a cash basis since Quarter 4 (Oct to Dec) 2014 (£7.8 billion).
An illustration of the relationship between total available resources on a cash basis and final consumption on a cash basis is given in Figure 3. Gross saving (shown by the bars) is the residual of total resources on a cash basis when final consumption expenditure on a cash basis has been subtracted. The saving ratio on a cash basis is gross saving on a cash basis expressed as a proportion of total available resources on a cash basis.
Figure 3: UK household saving ratio on a cash basis and breakdown of gross saving
Quarter 1 (Jan to Mar) 2010 to Quarter 2 (Apr to June) 2017

Source: Office for National Statistics
Download this image Figure 3: UK household saving ratio on a cash basis and breakdown of gross saving
.png (54.8 kB) .xls (30.7 kB)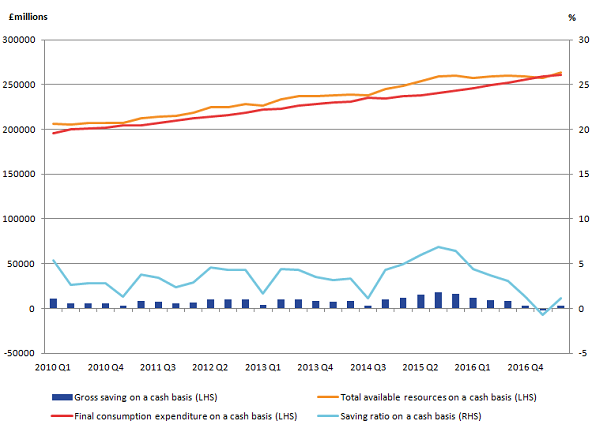
8. Why did the households saving ratio on a cash basis rise by more than the national accounts households saving ratio?
Compared with Quarter 1 (Jan to Mar) 2017, the households saving ratio on a cash basis rose by 1.8 percentage points in Quarter 2 2017. This was only 0.2 percentage points more than the households saving ratio on a national account basis, which rose by 1.6 percentage points.
This difference is caused by changes in the value of transactions excluded from the calculation of gross savings in order to calculate it in “cash basis” terms.
Table 1 presents the changes in the values of the transactions that are included in the calculation of the saving ratio on a national accounts basis, but are excluded from the saving ratio on a cash basis. The exclusion of these transactions (and the changes in the value of these transactions) explains the differences between the cash measure and national accounts measure of the saving ratio.
Within the national accounts, there are accounting identities, which mean that changes in the value of some of the transactions presented in Table 1 net to zero. These transactions are marked with an asterix (*).
For example, the value of Employers’ social contributions is equal and opposite to the sum of Employers’ actual social contributions and Employers’ imputed social contributions. Likewise, Property income payable on pension entitlements is equal and opposite to Households’ social contributions. Therefore, the value of these transactions (and any changes in the value of these transactions between quarters) net to zero.
Therefore, it is only the removal of the other transactions presented in Table 1 that explains the difference between the saving ratio on a cash basis and a national accounts basis. In Quarter 2 2017, the value of the transactions excluded from the calculation of gross disposable income on a cash basis increased by £1.1 billion. The largest contribution to this increase was a rise in the adjustment for the change in pension entitlements (which is removed from the calculation of total available resources on a cash basis) of £1.3 billion.
Furthermore, the value of the transactions excluded from the calculation of final consumption expenditure on a cash basis rose by £0.2 billion. This rise meant that final consumption expenditure on a cash basis did not increase by as much as it did on a national accounts basis. Therefore, consumption growth did not have such a large downward impact on gross saving on a cash basis as it did on a national accounts basis.
Table 1 also contains the four letter series identifiers (CDIDs) that are presented in the accompanying dataset to this article to enable users to further explore the data and methodology used.
Table 1: Change in the value of transactions removed from the national accounts methodology to calculate the cash measure of gross disposable income and the saving ratio UK, Quarter 1 (Jan to Mar) 2017
| £ million | ||||
| Transaction removed | CDID | Change, quarter on previous quarter | ||
| B.2g (resource) Gross operating surplus | CAEO | 46 | ||
| D.12 (resource) Employers' social contributions* | DTWP | 473 | ||
| P.119 (resource) (Plus) Financial Intermediation Services Indirectly Measured (FISIM) | CRNC | -112 | ||
| D.442 (resource) Property income payable on pension entitlements* | KZL5 | -39 | ||
| D.4432 (resource) Investment income attributable to collective investment fund shareholders - Retained earnings | MN7M | 12 | ||
| P.119 (use) (Less) Financial Intermediation Services Indirectly Measured (FISIM) | CRNB | 146 | ||
| D.612 (resource) Employers' imputed social contributions | L8RQ | 3 | ||
| D.72 (resource) Non-life insurance claims | RNLU | -257 | ||
| D.611 (use) Employers' actual social contributions* | L8NM | 212 | ||
| D.612 (use) Employers' imputed social contributions* | MA4B | 261 | ||
| D.614 (use) Households' social contribution supplements* | L8QA | -39 | ||
| D.8 (resource) Adjustment for the change in pension entitlements | RNMB | 1281 | ||
| Imputed rental for housing (removed from final consumption expenditure on a cash basis) | GBFJ | 258 | ||
| Financial Intermediation Services Indirectly Measured (FISIM) (removed from final consumption expenditure on a cash basis) | C68W | -90 | ||
| Source: Office for National Statistics | ||||
| Notes: | ||||
| 1. Key: * denotes the transactions whose values net to 0 | ||||