1. Main points
By updating the national deciles of area deprivation to Index of Multiple Deprivation 2015 (IMD15), there has been more of an impact on healthy life expectancy than life expectancy.
The majority of differences compared with Index of Multiple Deprivation 2010 (IMD10) were small and the pattern across deciles was irregular; however, decile 10 estimates mostly increased using IMD15.
Changing to IMD15 there has been a significant increase in life expectancy for females at birth and at age 65 in the least deprived areas (decile 10); for males, there was a significant increase in healthy life expectancy at birth in decile 5.
There has been no significant difference in the slope index of inequality for males and females living between the most deprived and least deprived areas since updating from IMD10 to IMD15.
At birth, the most deprived females had 19.6 fewer healthy life years than their least deprived counterparts; for males it was almost 19 years fewer.
At age 65, the least deprived women enjoyed 7.8 more healthy life years than the most deprived women and for men it was 7.5 years more.
2. Things you need to know about this release
The analyses based on the Index of Multiple Deprivation 2010 (IMD10) and the Index of Multiple Deprivation 2015 (IMD15) each make use of an abridged life table closed at 90 years and over rather than 85 years and over as used previously. In addition, we use a revised method to impute prevalence for certain age groups, which was first introduced for the bulletin Health state life expectancies, UK: 2013 to 2015. The impact of changing to this upper age group and the imputation method can be found in the methods change paper published in 2016 (See Method changes to life and health state expectancies).
For this bulletin the most recent national deciles of area deprivation are being used from IMD15 to report inequalities in health state life expectancies in England. We have moved to basing these estimates on IMD15 as it contains more recent data on which the measure of deprivation is constructed, thereby improving the alignment of areas to relative deprivation exposure. To assess the impact of changing to deciles based on IMD15, the 2013 to 2015 life expectancy and healthy life expectancy estimates are also compared with those using IMD10.
A back series of estimates using IMD15 is provided in the datasets for the periods 2011 to 2013 and 2012 to 2014.
Nôl i'r tabl cynnwys3. Classification effects were minor for both measures
In this section, we assess the impact of changing from Index of Multiple Deprivation 2010 (IMD10) to Index of Multiple Deprivation 2015 (IMD15); looking at the differences between life expectancy (LE), healthy life expectancy (HLE) and inequality measures. In section 4, we look at the results for IMD15 for the period 2013 to 2015 in more detail.
Decile-specific life expectancy and healthy life expectancy
Overall, both males and females experienced smaller changes in LE at birth, than in HLE when using IMD15. The small positive and negative changes that did arise in the decile-specific estimates followed an irregular pattern. The only significant increase in LE when changing to IMD15, occurred in decile 10 for females, extending the gap between decile 9 and decile 10, as well as overall. The sharper contraction from decile 2 to decile 1 in male LE and the rise from decile 9 to decile 10 were evident under each classification (see Figure 1).
Figure 1: Life expectancy (LE) at birth for males and females by deprivation decile in England for IMD10 and IMD15, 2013 to 2015
Source: Office for National Statistics
Notes:
Includes all usual residents.
For more information on the data sources for IMD10 and IMD15 please see the Department for Communities and Local Government
Download this chart Figure 1: Life expectancy (LE) at birth for males and females by deprivation decile in England for IMD10 and IMD15, 2013 to 2015
Image .csv .xlsThere has been more of an impact on HLE when basing estimates on IMD15 compared with IMD10; however, the change was only statistically significant for males in decile 5. This has doubled the previous gap between decile 4 and 5 when using IMD10 but halved the gap between deciles 5 and 6. The gap between deciles 1 and 2 and deciles 9 and 10 remain large and highly statistically significant when using IMD15.
The decile-specific estimates for males at birth showed that, starting from decile 1, the increase in HLE in the next adjacent decile was statistically significant until decile 8. The increases observed between decile 7 and decile 8 and decile 8 and decile 9 under each classification were not statistically significant. However, between decile 9 and decile 10 a statistically significant increase was observed under each classification. The largest gap remains between decile 1 and decile 2 of 4.2 years using IMD15; using IMD10 it was 4.7 years. The gap between decile 9 and decile 10 was the same using each classification of 2.3 years (see Figure 2).
Figure 2: Healthy life expectancy (HLE) at birth for males by deprivation decile in England for IMD10 and IMD15, 2013 to 2015
Source: Office for National Statistics
Notes:
The health state prevalence estimates used to estimate Healthy Life Expectancy are sourced from Annual Population Survey (APS) data. The APS excludes residents of communal establishments except NHS housing and students in halls of residence where inclusion takes place at their parents' address.
For more information on the data sources for IMD10 and IMD15 please see the Department for Communities and Local Government
Download this chart Figure 2: Healthy life expectancy (HLE) at birth for males by deprivation decile in England for IMD10 and IMD15, 2013 to 2015
Image .csv .xls
Figure 3: Healthy life expectancy (HLE) at birth for females by deprivation decile in England for IMD10 and IMD15, 2013 to 2015
Source: Office for National Statistics
Notes:
The health state prevalence estimates used to estimate Healthy Life Expectancy are sourced from Annual Population Survey (APS) data. The APS excludes residents of communal establishments except NHS housing and students in halls of residence where inclusion takes place at their parents' address.
For more information on the data sources for IMD10 and IMD15 please see the Department for Communities and Local Government
Download this chart Figure 3: Healthy life expectancy (HLE) at birth for females by deprivation decile in England for IMD10 and IMD15, 2013 to 2015
Image .csv .xlsFor females, the pattern was less regular. There was an increase in the gap between decile 9 and 10 using IMD15, with the order of magnitude now slightly larger to that observed between these deciles for males. The largest gap was also between decile 1 and 2 of 3.9 years, but was 0.4 years less than it was using IMD10. The statistically significant growth pattern in HLE in the next adjacent decile moving from most to least deprived was present for females up to decile 6, as the increase between decile 6 and decile 7 was not significant. There was though a significant increase from decile 7 to decile 8 not observed for males. The large significant increase from decile 9 to decile 10 was observed for females, as well as males (see Figure 3).
At age 65, we observed similar results. The only significant difference between IMD10 and IMD15 was in LE for females in decile 10.
Measures of inequality in life expectancy and healthy life expectancy
Inequality in this bulletin is measured in absolute terms using the range and the slope index of inequality (SII). The range is the absolute difference between the most and least deprived deciles. The SII can be interpreted in the same way as the range but takes into account inequality across the whole distribution as well as giving greater weight to larger populations and less weight to smaller populations.
There were no statistically significant differences when moving from IMD10 to IMD15 for SII; generally, there was less change in the SII than in the range. The biggest difference in the range between IMD10 and IMD15 was HLE at birth for females, increasing from 18.5 years to 19.1 years. The dominant influence on the range increasing was the improvement in HLE at birth for females in decile 10 of more than half a year when moving to IMD15. Most estimates showed a slightly larger inequality in SII than the range, for both IMD10 and IMD15. The inequality in the proportion of remaining life spent in “good” health reduced for males at birth in IMD15, but increased for females.
Similar to the comparisons at birth, at age 65 there were more differences observed in the range than SII when moving from IMD10 to IMD15. The biggest change in the range based on IMD15 was again in HLE for females, with an increase of 0.4 years. This reduced the difference between the SII and range; however, in all cases the SII estimated more inequality than the range between the most deprived (decile 1) and least deprived (decile 10) areas. There were no statistically significant differences in the SII based on IMD10 and IMD15.
The inequality in the proportion of remaining life spent in “good” health reduced for males using IMD15, but increased for females. This was the same as the effect observed at birth (see Table 1).
Table 1: Comparison of IMD10 and IMD15 for the Slope Index of Inequality (SII) and the range for life expectancy (LE) and healthy life expectancy (HLE) at birth and age 65, for males and females, 2013 to 2015
| IMD10 | IMD15 | ||||||
| SII | Range | SII | Range | SII difference | Range difference | ||
| At birth | |||||||
| HLE | Males | 18.9 | 18.7 | 18.9 | 18.7 | 0.0 | 0.1 |
| Females | 19.5 | 18.5 | 19.6 | 19.1 | 0.1 | 0.6 | |
| LE | Males | 9.1 | 8.9 | 9.2 | 9.1 | 0.1 | 0.2 |
| Females | 7.0 | 6.9 | 7.1 | 7.2 | 0.1 | 0.3 | |
| Proportion in "good" health | Males | 15.0 | 14.8 | -0.2 | |||
| Females | 16.3 | 16.7 | 0.4 | ||||
| At age 65 | |||||||
| HLE | Males | 7.6 | 7.4 | 7.5 | 7.1 | -0.2 | -0.3 |
| Females | 7.9 | 6.9 | 7.8 | 7.3 | -0.0 | 0.4 | |
| LE | Males | 5.1 | 4.9 | 5.1 | 5.0 | 0.0 | 0.1 |
| Females | 4.5 | 4.4 | 4.6 | 4.6 | 0.1 | 0.2 | |
| Proportion in "good" health | Males | 26.8 | 24.9 | -1.9 | |||
| Females | 23.6 | 24.6 | 1.0 | ||||
| Source: Office for National Statistics | |||||||
| Notes: | |||||||
| 1. Life expectancy includes all usual residents. | |||||||
| 2. For more information on the data sources for IMD10 and IMD15 please see the Department for Communities and Local Government on the following website: https://www.gov.uk/government/collections/english-indices-of-deprivation | |||||||
| 3. The differences presented in the table are based on the inequality at 5 decimal places. | |||||||
Download this table Table 1: Comparison of IMD10 and IMD15 for the Slope Index of Inequality (SII) and the range for life expectancy (LE) and healthy life expectancy (HLE) at birth and age 65, for males and females, 2013 to 2015
.xls (31.7 kB)4. Healthy life expectancy at birth and age 65 by English deciles of area deprivation (IMD15), 2013 to 2015
In this section, the following analysis allows us to assess the scale of inequality in healthy life expectancy (HLE) by deciles of small area deprivation produced by clustering lower super output areas (LSOAs) by the English Index of Multiple Deprivation 2015 (IMD15). This provides evidence on the scale of inequality operating within England and acts as complementary information for organisations tasked with reducing inequalities in health to make informed decisions regarding the allocation of funding for interventions and services designed to narrow health gaps. The range and slope index of inequality (SII) are the 2 measures of inequality that are provided for the period 2013 to 2015.
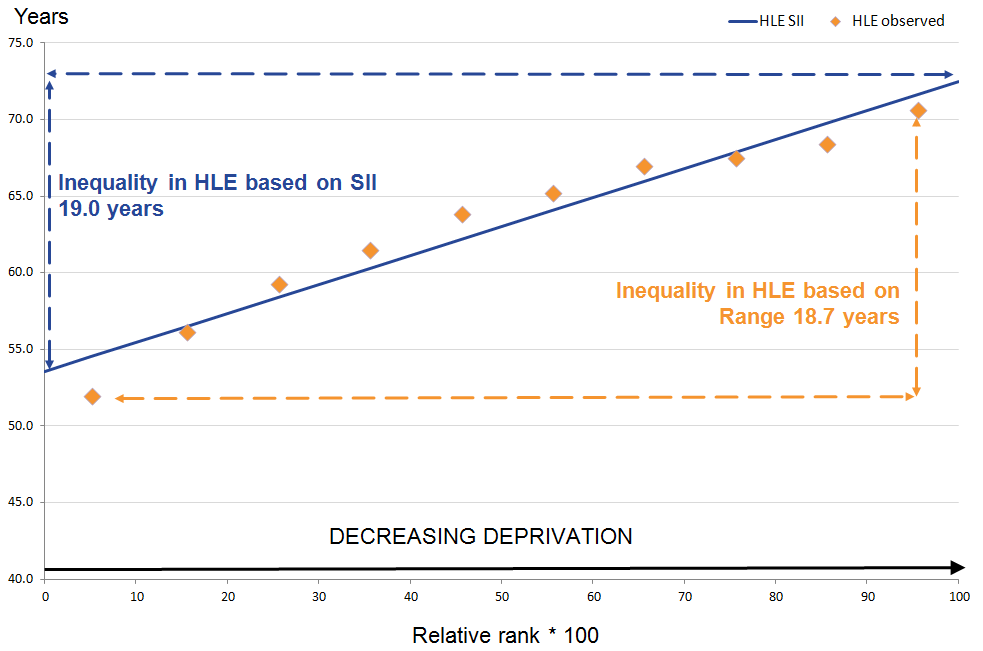
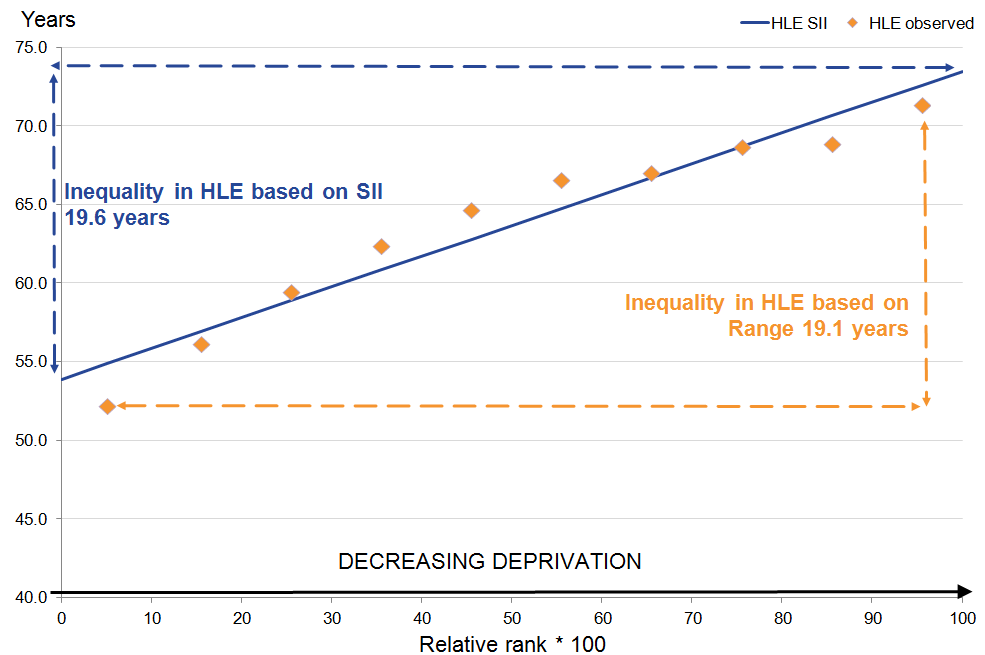
At birth, the most deprived females had 19.6 fewer healthy life years than their least deprived counterparts; for males it was almost 19 years fewer
In the most deprived 10% of LSOAs in England (decile 1), HLE was 18.7 years lower for males and 19.1 years lower for females compared with the least deprived 10% of LSOAs (decile 10) as measured by the range. This inequality was almost twice as wide as the difference seen in life expectancy (LE) at 9.1 years for males; for females, it was getting on for 3 times wider than the difference in LE at 7.2 years.
Using the SII, a slightly greater inequality than the range was observed between the most and least deprived males at 18.9 years; it was 19.6 years for females. When assessing LE with the same measure, this was less than half the size at 9.2 years for males and almost a third of the size for females at 7.1 years. This demonstrates that greater inequality exists in the prevalence of self-assessed “Good” general health when combined with mortality than in mortality alone (see Table 2 and Figures 4 and 5).
Table 2: Slope Index of Inequality (SII) and range for life expectancy (LE), healthy life expectancy (HLE) and proportion of life spent in "Good" health for males and females at birth by national deciles of area deprivation in England, 2013 to 2015
| England | ||||
| Range (years) | SII (years) | Simulated lower 95% confidence interval | Simulated upper 95% confidence interval | |
| Males | ||||
| LE | 9.1 | 9.2 | 9.1 | 9.3 |
| HLE | 18.7 | 18.9 | 18.4 | 19.5 |
| Proportion of life in "Good" health (%) | 14.8 | |||
| Females | ||||
| LE | 7.2 | 7.1 | 7.0 | 7.2 |
| HLE | 19.1 | 19.6 | 19.0 | 20.2 |
| Proportion of life in "Good" health (%) | 16.7 | |||
| Source: Office for National Statistics | ||||
| Notes: | ||||
| 1. Life expectancy includes all usual residents. | ||||
| 2. The health state prevalence estimates used to estimate Healthy Life Expectency are sourced from Annual Populations Survey (APS) data. The APS excludes residents of communal establishments except NHS housing and students in halls of residence where inclusion takes place at their parents' home address. | ||||
| 3. Range is calculated by taking the difference between decile 1 and decile 10. | ||||
| 4. SII is calculated by taking the difference between the extremes of a population weighted regression line of best fit. | ||||
| 5. For more information on how to interpret simulated confidence intervals see the methodology section. | ||||
Download this table Table 2: Slope Index of Inequality (SII) and range for life expectancy (LE), healthy life expectancy (HLE) and proportion of life spent in "Good" health for males and females at birth by national deciles of area deprivation in England, 2013 to 2015
.xls (28.7 kB)
Figure 4: Inequality in healthy life expectancy (HLE) for males at birth by deprivation decile in England, 2013 to 2015
Source: Office for National Statistics
Notes:
- The health state prevalence estimates used to estimate Healthy Life Expectancy are sourced from Annual Population Survey (APS) data. The APS excludes residents of communal establishments except NHS housing and students in halls of residence where inclusion takes place at their parents' address.
Download this image Figure 4: Inequality in healthy life expectancy (HLE) for males at birth by deprivation decile in England, 2013 to 2015
.png (24.1 kB) .xls (18.4 kB)
Figure 5: Inequality in healthy life expectancy (HLE) for females at birth by deprivation decile in England, 2013 to 2015
Source: Office for National Statistics
Notes:
- The health state prevalence estimates used to estimate Healthy Life Expectancy are sourced from Annual Population Survey (APS) data. The APS excludes residents of communal establishments except NHS housing and students in halls of residence where inclusion takes place at their parents' address.
Download this image Figure 5: Inequality in healthy life expectancy (HLE) for females at birth by deprivation decile in England, 2013 to 2015
.png (25.6 kB) .xls (18.4 kB)It has been consistently shown in previous releases at national level that females live longer than males, but expect to live less of their lives in “Good” health. Within each decile, the differences between sexes in HLE were narrower compared with LE, therefore most of the extra years of life expected by females were not spent in “Good” health.
The sex disadvantage of males in regards to LE is observed to be compensated for by socio-economic advantage. Those males living in the least deprived 6 deciles (5 through to 10) had statistically significant longer LE than females in decile 1. For HLE at birth, males in deciles 2 through to 10 had a significant longer HLE at birth than females in the most deprived decile (see Table 3).
Table 3: Healthy life expectancy (HLE) and life expectancy (LE) for males and females at birth by national deciles of area deprivation in England, 2013 to 2015
| Decile | LE (years) | Lower 95% confidence interval | Upper 95% confidence interval | HLE (years) | Lower 95% confidence interval | Upper 95% confidence interval | Proportion of life in "Good" health (%) |
| Males | |||||||
| 1 | 74.0 | 73.9 | 74.1 | 51.9 | 51.4 | 52.4 | 70.2 |
| 2 | 76.1 | 76.0 | 76.2 | 56.1 | 55.6 | 56.7 | 73.8 |
| 3 | 77.4 | 77.3 | 77.5 | 59.3 | 58.7 | 59.8 | 76.5 |
| 4 | 78.7 | 78.6 | 78.8 | 61.4 | 60.9 | 62.0 | 78.1 |
| 5 | 79.6 | 79.5 | 79.7 | 63.8 | 63.3 | 64.3 | 80.2 |
| 6 | 80.4 | 80.3 | 80.5 | 65.2 | 64.7 | 65.7 | 81.1 |
| 7 | 81.0 | 80.9 | 81.1 | 66.9 | 66.4 | 67.4 | 82.6 |
| 8 | 81.4 | 81.3 | 81.5 | 67.5 | 67.0 | 68.0 | 82.9 |
| 9 | 82.1 | 82.0 | 82.1 | 68.4 | 67.9 | 68.9 | 83.3 |
| 10 | 83.1 | 83.0 | 83.2 | 70.6 | 70.2 | 71.1 | 85.0 |
| Females | |||||||
| 1 | 78.9 | 78.8 | 79.0 | 52.2 | 51.7 | 52.8 | 66.2 |
| 2 | 80.4 | 80.3 | 80.5 | 56.1 | 55.6 | 56.7 | 69.8 |
| 3 | 81.7 | 81.6 | 81.7 | 59.5 | 58.9 | 60.0 | 72.8 |
| 4 | 82.5 | 82.4 | 82.5 | 62.3 | 61.8 | 62.9 | 75.6 |
| 5 | 83.1 | 83.0 | 83.2 | 64.7 | 64.1 | 65.2 | 77.8 |
| 6 | 83.6 | 83.5 | 83.7 | 66.5 | 66.0 | 67.1 | 79.6 |
| 7 | 84.2 | 84.2 | 84.3 | 67.0 | 66.5 | 67.6 | 79.6 |
| 8 | 84.5 | 84.5 | 84.6 | 68.7 | 68.2 | 69.2 | 81.2 |
| 9 | 85.1 | 85.0 | 85.1 | 68.8 | 68.3 | 69.4 | 80.9 |
| 10 | 86.1 | 86.0 | 86.1 | 71.3 | 70.8 | 71.9 | 82.9 |
| Source: Office for National Statistics | |||||||
| Notes: | |||||||
| 1. Life expectancy includes all usual residents. | |||||||
| 2. The health state prevalence estimates used to estimate Healthy Life Expectancy are sourced from Annual Population Survey (APS) data. The APS excludes residents of communal establishments except NHS housing and students in halls of residence where inclusion takes place at their parents' address. | |||||||
| 3. Deciles are presented by sex. | |||||||
Download this table Table 3: Healthy life expectancy (HLE) and life expectancy (LE) for males and females at birth by national deciles of area deprivation in England, 2013 to 2015
.xls (31.2 kB)The proportion of life spent in “Good” health allows us to see whether those who have a shorter LE could still expect to live the same proportion of their remaining life in “Good” general health. However, the figures showed that this isn’t the case. For males and females, even though those in the most deprived decile had the shortest LE, they expected to spend a smaller proportion of their remaining life in “Good” health when compared with those in the least deprived decile with the longest LE. This difference amounted to 14.8 percentage points for males; for females it was 16.7 percentage points. Females in the most deprived decile could expect to spend just less than two-thirds of their LE in good general health, which was the lowest proportion across sexes and deciles.
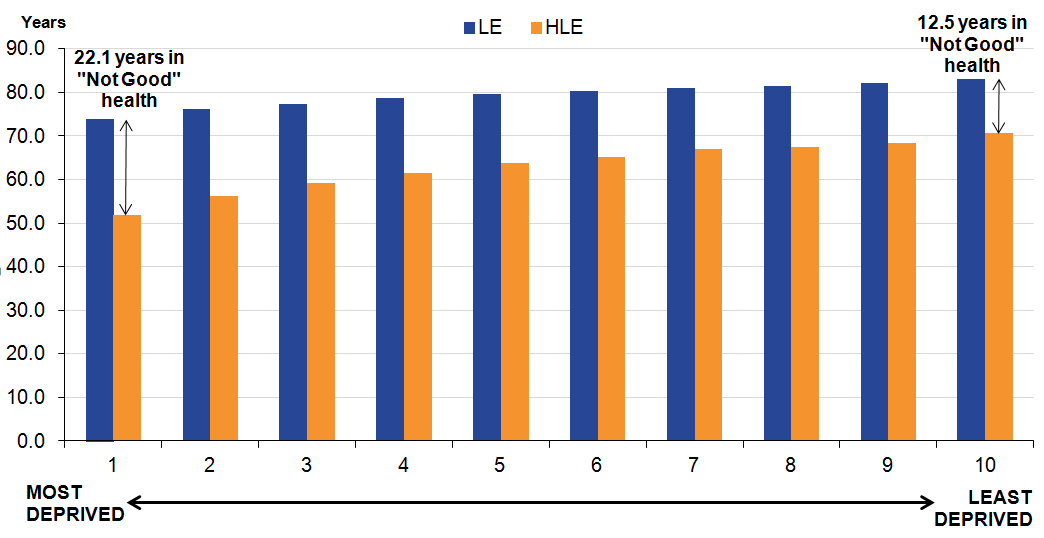
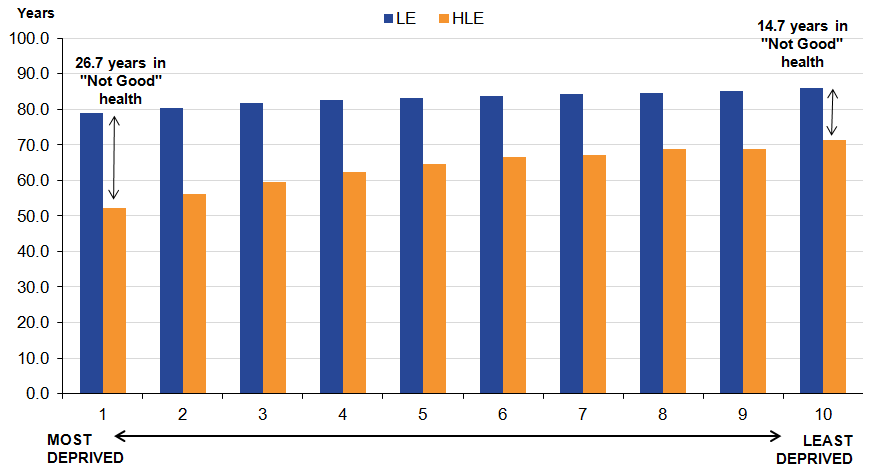
The pattern of inequality in HLE at birth, whereby the estimate decreases with increasing deprivation, can also be illustrated through looking at years spent in “Not Good” health. Males in the least deprived decile could expect to spend 12.5 years in “Not Good” health compared with 22.1 years in the most deprived decile. For females these figures were 14.7 years in “Not Good” health in the least deprived decile and 26.7 years in the most deprived decile (see Figures 6 and 7).
Fugire 6: Healthy life expectancy (HLE) and life expectancy (LE) for males at birth by national deciles of area deprivation, England 2013 to 2015
Source: Office for National Statistics
Notes:
Life expectancy includes all usual residents.
The health state prevalence estimates used to estimate Healthy Life Expectancy are sourced from Annual Population Survey (APS) data. The APS excludes residents of communal establishments except NHS housing and students in halls of residence where inclusion takes place at their parents' address.
Download this image Fugire 6: Healthy life expectancy (HLE) and life expectancy (LE) for males at birth by national deciles of area deprivation, England 2013 to 2015
.png (39.1 kB) .xls (17.9 kB)
Figure 7: Healthy life expectancy (HLE) and life expectancy (LE) for females at birth by national deciles of area deprivation, England 2013 to 2015
Source: Office for National Statistics
Notes:
Life expectancy includes all usual residents.
The health state prevalence estimates used to estimate Healthy Life Expectancy are sourced from Annual Population Survey (APS) data. The APS excludes residents of communal establishments except NHS housing and students in halls of residence where inclusion takes place at their parents' address.
Download this image Figure 7: Healthy life expectancy (HLE) and life expectancy (LE) for females at birth by national deciles of area deprivation, England 2013 to 2015
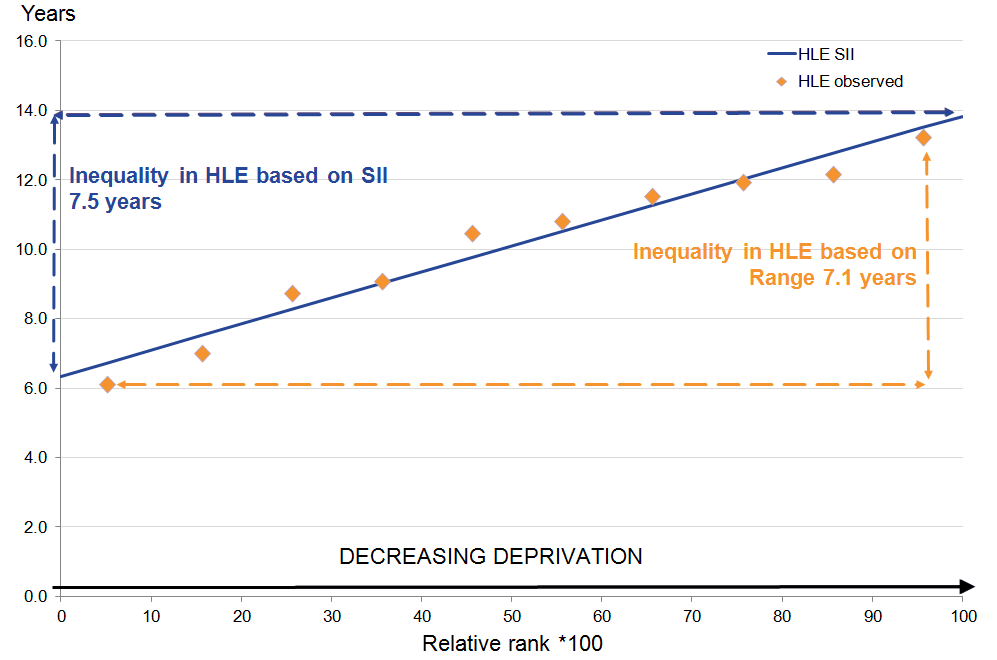
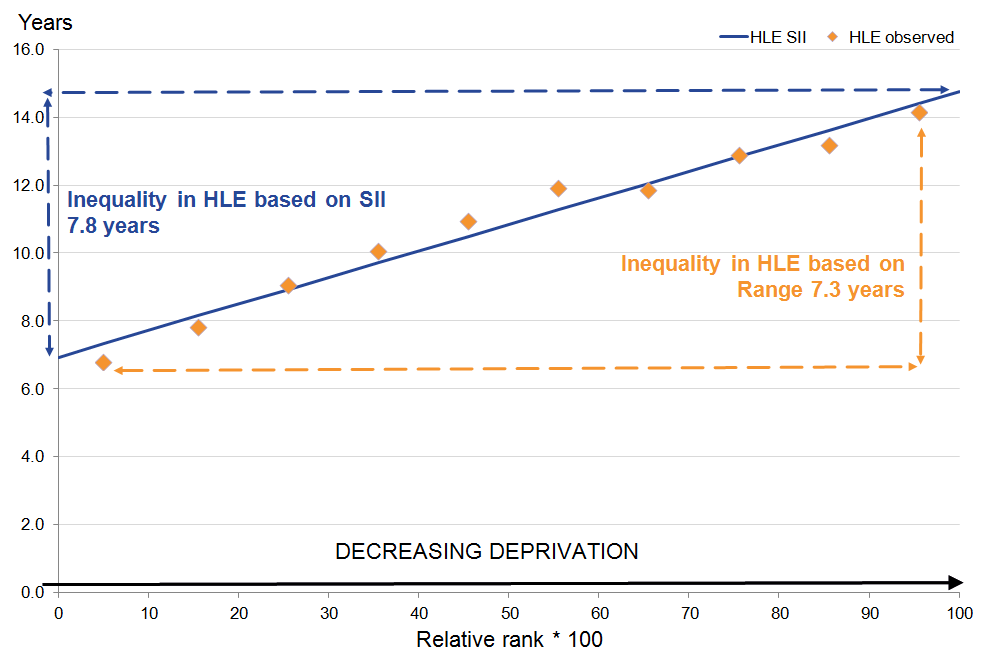
.png (30.6 kB) .xls (17.9 kB)At age 65 the least deprived women enjoyed 7.8 more healthy life years than the most deprived women, and for men it was 7.5 years more
At age 65, HLE in the most deprived decile was 7.1 years lower for men and 7.3 years lower for women than the least deprived decile when measured by the range. The inequality was again somewhat wider than in LE where the difference for men was 5.0 years and for women 4.6 years.
The SII showed greater inequality than the range at 7.5 years for men and 7.8 years for women between the most and least deprived areas. When assessing LE with the same measure, this was somewhat less than HLE at 5.1 years for men and 4.6 years for women (see Table 4 and Figures 8 and 9).
Table 4: Slope Index of Inequality (SII) and range for life expectancy (LE), healthy life expectancy (HLE) and proportion of life spent in "Good" health for males and females at age 65 by national deciles of area deprivation in England, 2013 to 2015
| England | ||||
| Range (years) | SII (years) | Simulated lower 95% confidence interval | Simulated upper 95% confidence interval | |
| Men | ||||
| LE | 5.0 | 5.1 | 5.0 | 5.1 |
| HLE | 7.1 | 7.5 | 7.1 | 7.9 |
| Proportion of life in "Good" health (%) | 24.9 | |||
| Women | ||||
| LE | 4.6 | 4.6 | 4.5 | 4.6 |
| HLE | 7.3 | 7.8 | 7.4 | 8.3 |
| Proportion of life in "Good" health (%) | 24.6 | |||
| Source: Office for National Statistics | ||||
| Notes: | ||||
| 1. Life expectancy includes all usual residents. | ||||
| 2. The health state prevalence estimates used to estimate Healthy Life Expectency are sourced from Annual Populations Survey (APS) data. The APS excludes residents of communal establishments except NHS housing and students in halls of residence where inclusion takes place at their parents' home address. | ||||
| 3. Range is calculated by taking the difference between decile 1 and decile 10. | ||||
| 4. SII is calculated by taking the difference between the extremes of a population weighted regression line of best fit. | ||||
| 5. For more information on how to interpret simulated confidence intervals see the methodology section. | ||||
Download this table Table 4: Slope Index of Inequality (SII) and range for life expectancy (LE), healthy life expectancy (HLE) and proportion of life spent in "Good" health for males and females at age 65 by national deciles of area deprivation in England, 2013 to 2015
.xls (29.2 kB)
Figure 8: Inequality in healthy life expectancy (HLE) for men at age 65 by deprivation decile England, 2013 to 2015
Source: Office for National Statistics
Notes:
- The health state prevalence estimates used to estimate Healthy Life Expectancy are sourced from Annual Population Survey (APS) data. The APS excludes residents of communal establishments except NHS housing and students in halls of residence where inclusion takes place at their parents' address.
Download this image Figure 8: Inequality in healthy life expectancy (HLE) for men at age 65 by deprivation decile England, 2013 to 2015
.png (26.3 kB) .xls (18.4 kB)
Figure 9: Inequality in healthy life expectancy (HLE) for women at age 65 by deprivation decile England, 2013 to 2015
Source: Office for National Statistics
Notes:
- The health state prevalence estimates used to estimate Healthy Life Expectancy are sourced from Annual Population Survey (APS) data. The APS excludes residents of communal establishments except NHS housing and students in halls of residence where inclusion takes place at their parents' address.
Download this image Figure 9: Inequality in healthy life expectancy (HLE) for women at age 65 by deprivation decile England, 2013 to 2015
.png (23.9 kB) .xls (18.4 kB)LE and HLE at age 65 increased between each decile from most to least deprived for men and women, and the same pattern was generally observed for the proportion of remaining life in “Good” health. Longer lives are associated with decreasing deprivation and more years in good health.
Table 5: Healthy life expectancy (HLE) and life expectancy (LE) for men and women at age 65 by national deciles of area deprivation in England, 2013 to 2015
| Decile | LE (years) | Lower 95% confidence interval | Upper 95% confidence interval | HLE (years) | Lower 95% confidence interval | Upper 95% confidence interval | Proportion of life in "Good" health (%) |
| Males | |||||||
| 1 | 15.8 | 15.7 | 15.9 | 6.1 | 5.8 | 6.5 | 38.8 |
| 2 | 16.6 | 16.5 | 16.7 | 7.0 | 6.6 | 7.4 | 42.3 |
| 3 | 17.4 | 17.3 | 17.4 | 8.8 | 8.3 | 9.2 | 50.4 |
| 4 | 18.1 | 18.0 | 18.2 | 9.1 | 8.7 | 9.5 | 50.3 |
| 5 | 18.6 | 18.5 | 18.6 | 10.5 | 10.1 | 10.9 | 56.5 |
| 6 | 19.0 | 19.0 | 19.1 | 10.8 | 10.4 | 11.2 | 56.9 |
| 7 | 19.4 | 19.3 | 19.5 | 11.5 | 11.2 | 11.9 | 59.5 |
| 8 | 19.6 | 19.6 | 19.7 | 12.0 | 11.6 | 12.3 | 61.0 |
| 9 | 20.0 | 19.9 | 20.0 | 12.2 | 11.8 | 12.5 | 61.0 |
| 10 | 20.8 | 20.7 | 20.8 | 13.2 | 12.8 | 13.6 | 63.7 |
| Females | |||||||
| 1 | 18.5 | 18.5 | 18.6 | 6.8 | 6.4 | 7.2 | 36.6 |
| 2 | 19.2 | 19.2 | 19.3 | 7.8 | 7.4 | 8.2 | 40.7 |
| 3 | 20.0 | 19.9 | 20.1 | 9.1 | 8.6 | 9.5 | 45.3 |
| 4 | 20.6 | 20.5 | 20.6 | 10.1 | 9.6 | 10.5 | 48.9 |
| 5 | 21.0 | 20.9 | 21.0 | 10.9 | 10.5 | 11.4 | 52.1 |
| 6 | 21.3 | 21.2 | 21.4 | 11.9 | 11.5 | 12.3 | 56.0 |
| 7 | 21.7 | 21.6 | 21.7 | 11.9 | 11.4 | 12.3 | 54.7 |
| 8 | 21.9 | 21.8 | 22.0 | 12.9 | 12.5 | 13.3 | 58.9 |
| 9 | 22.3 | 22.2 | 22.3 | 13.2 | 12.8 | 13.6 | 59.2 |
| 10 | 23.1 | 23.0 | 23.1 | 14.1 | 13.7 | 14.6 | 61.2 |
| Source: Office for National Statistics | |||||||
| Notes: | |||||||
| 1. Life expectancy includes all usual residents. | |||||||
| 2. The health state prevalence estimates used to estimate Healthy Life Expectancy are sourced from Annual Population Survey (APS) data. The APS excludes residents of communal establishments except NHS housing and students in halls of residence where inclusion takes place at their parents' address. | |||||||
| 3. Deciles are presented by sex. | |||||||
Download this table Table 5: Healthy life expectancy (HLE) and life expectancy (LE) for men and women at age 65 by national deciles of area deprivation in England, 2013 to 2015
.xls (31.2 kB)The proportion of life men and women could expect to spend in “Good” health at age 65 by deciles of deprivation are shown in Table 5. For the most deprived areas, men and women could expect to live 38.8% and 36.6% of their lives in “Good” health, whereas men and women in the least deprived areas could expect to live a larger proportion of their lives in “Good” health at 63.7% and 61.2% respectively. This means that the gap between the most deprived and least deprived deciles for men was 24.9 percentage points and 24.6 percentage points for women.
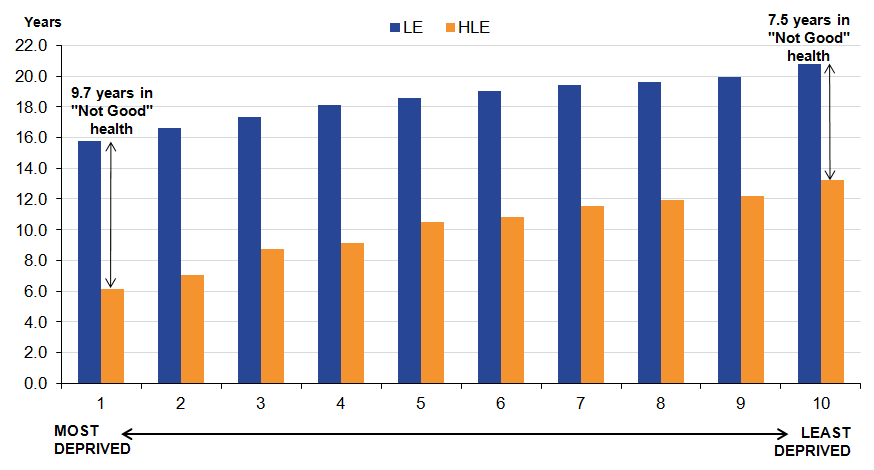
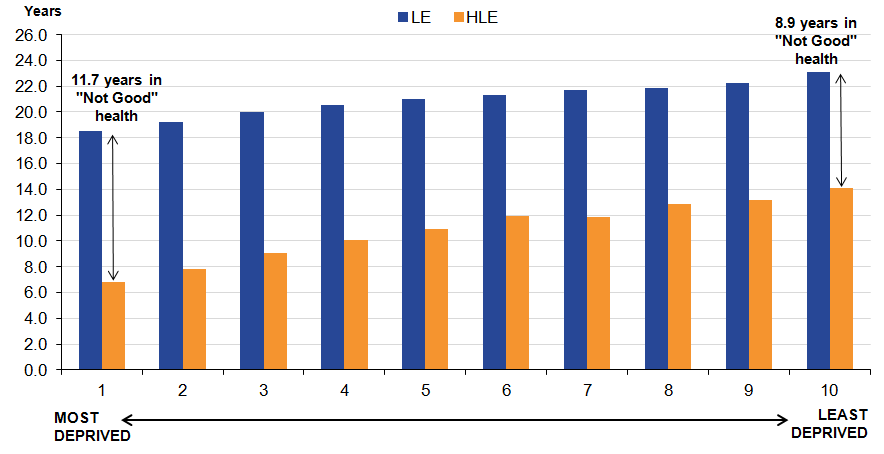
At age 65, years spent in “Not Good” health was shortest amongst the least deprived, and longest amongst the most deprived, as observed at birth. Men in the least deprived decile could expect to spend 7.5 years in “Not Good” health compared with 9.7 years in the most deprived decile. For women, these figures were 8.9 years in “Not Good” health in the least deprived decile and 11.7 years in the most deprived decile (see Figures 10 and 11).
Figure 10: Healthy life expectancy (HLE) and life expectancy (LE) for men at age 65 by national deciles of area deprivation, England 2013 to 2015
Source: Office for National Statistics
Notes:
Life expectancy includes all usual residents.
The health state prevalence estimates used to estimate Healthy Life Expectancy are sourced from Annual Population Survey (APS) data. The APS excludes residents of communal establishments except NHS housing and students in halls of residence where inclusion takes place at their parents' address.
Download this image Figure 10: Healthy life expectancy (HLE) and life expectancy (LE) for men at age 65 by national deciles of area deprivation, England 2013 to 2015
.png (29.3 kB) .xls (17.9 kB)
Figure 11: Healthy life expectancy (HLE) and life expectancy (LE) for women at age 65 by national deciles of area deprivation, England 2013 to 2015
Source: Office for National Statistics
Notes:
Life expectancy includes all usual residents.
The health state prevalence estimates used to estimate Healthy Life Expectancy are sourced from Annual Population Survey (APS) data. The APS excludes residents of communal establishments except NHS housing and students in halls of residence where inclusion takes place at their parents' address.
Download this image Figure 11: Healthy life expectancy (HLE) and life expectancy (LE) for women at age 65 by national deciles of area deprivation, England 2013 to 2015
.png (28.9 kB) .xls (17.9 kB)5. What are health expectancies?
Health expectancies add a quality of life dimension to estimates of life expectancy (LE) by dividing expected lifespan into time spent in different states of health. Healthy life expectancy (HLE) estimates lifetime spent in “Very good” or “Good” health based on how individuals perceive their general health. Health expectancies are summary measures of population health and important indicators of the well-being of society, providing context to the impacts of policy changes and interventions at both national and local levels. Health expectancies are used across public, private and voluntary sectors, in the assessment of healthy ageing, fitness for work, monitoring health improvement, fairness of extensions to the State Pension age, pension provision and health and social care need.
The importance of HLE as a summary measure of population health is reflected in its inclusion in the 2 high level outcomes for the Public Health Outcomes Framework (PHOF). The first outcome is increased HLE, taking account of the quality as well as the length of life. The second is to reduce differences in LE and HLE between communities, through greater improvements in more disadvantaged communities. The vision for the outcomes is “to improve and protect the nation’s health and well-being, and improve the health of the poorest fastest” (page 9, DH, 2012).
The 2013 to 2015 HLE figures in this publication represent the expected life years in “Good” health for an individual, assuming 2013 to 2015 mortality and health status rates apply throughout that individual’s life. Therefore, they provide a snapshot of the health status of the population(s) in England during 2013 to 2015. The health status and mortality rates of a population change year-on-year due to exposure to different risks and treatments affecting health and also through inward and outward migration. Therefore, the estimates reported in this bulletin should not be interpreted as the actual number of years a person will live in “Good” health. HLE figures are a likely estimate should the health status and mortality rates remain fairly stable over the life course.
HLE estimates are, in part, subjective and based upon the following survey question:
“How is your health in general; would you say it was...”
- Very good
- Good
- Fair
- Bad
- Very bad
If a respondent answered “Very good” or “Good” they were classified as having “Good” health. Those who answered “Fair”, “Bad”, or “Very bad” were classified as having “Not Good” health.
Changes in health expectancies over time are assessed by comparing non-overlapping time periods. Therefore, estimates for 2013 to 2015 should not be compared with estimates for 2012 to 2014 or 2011 to 2013 for example, as they will contain some of the same survey respondents.
Nôl i'r tabl cynnwys6. Quality and methodology
The Health expectancies Quality and Methodology Information document contains important information on:
the strengths and limitations of the data and how it compares with related data
users and uses of the data
how the output was created
the quality of the output including the accuracy of the data
Calculating healthy life expectancy
The data used in calculating the prevalence of “Good” general health was obtained from the Annual Population Survey (APS). It was aggregated over a 3-year period to achieve sufficiently large sample sizes to enable meaningful statistical comparison.
Results are presented with 95% confidence intervals in datasets to help interpretation. Confidence intervals in this statistical bulletin indicate the uncertainty surrounding healthy life expectancy (HLE) estimates and allow more meaningful comparisons between areas. When comparing the 2 estimates, non-overlapping confidence intervals are indicative of statistical significance.
Slope index of inequality
The slope index of inequality (SII) was used to assess the absolute inequality in HLE between the least and most deprived deciles. This indicator measures the gap in HLE by taking into account the inequality across all adjacent deciles of relative deprivation, rather than focusing only on the extremes.
To calculate the slope index of inequality:
Deciles were ordered by decreasing area deprivation, that is, from the most to the least deprived. The fraction of the total population in each decile (f) was calculated. The cumulative frequency (ci), that is, the cumulative sum of the population in successively less deprived deciles, was also obtained and the relative deprivation rank (x) for each decile was calculated as:
This formula calculates the relative deprivation rank for use in the slope index of inequality calculation.
The SII (slope of the regression line) was then estimated by regressing HLE for each decile against the relative deprivation rank (x), weighted by the population in each decile.
Confidence interval details for SII indicators
The confidence intervals for the SII are calculated using a simulation program. Simulation is a method used to estimate the degree of uncertainty for measures where the statistical distributions underpinning the measure are too complex to analyse mathematically. For each decile, the life expectancy (LE) and healthy life expectancy (HLE) has been calculated along with its standard error (SE). These SEs give information about the degree of uncertainty around each of the health state life expectancy values: essentially it describes a statistical distribution for each decile. Using a random number generating algorithm, a random value is taken from each decile LE and HLE distribution and the SII recalculated. This is repeated many times (for example, 10,000), to build up a distribution of SII values based on random sampling from the decile LE distributions. The 2.5% and 97.5% values from this distribution of SII values is then reported as the 95% confidence interval for the SII, rather than that based on 10 observations representing the deciles.
Note that previously the confidence intervals were calculated based purely on the SII regression slope, ignoring the distributional information about the decile LEs and HLEs. This method generally overestimated the width of the confidence intervals, that is, it was overly conservative in most cases. The current method allows greater discrimination between areas and over time.
More information can be found in the QMI.
Nôl i'r tabl cynnwys
