1. Main points
- More than a third of 25- to 64-year-olds in the lowest healthy life expectancy (HLE) areas were economically inactive because they are long-term sick or disabled in 2015.
- More than 1 in 10 people in the lowest HLE areas were limited a lot carrying out normal day-to-day activities; in the highest HLE areas it was less than 1 in 25.
- People living in the lowest HLE areas have lower educational attainment than people living in the highest HLE areas and their health is worse independent of educational level.
- The widest disparity in smoking prevalence between the lowest and highest HLE areas was among 30- to 49-year-olds.
- Obesity prevalence in adults was more than two times higher in Kingston-upon-Hull (30.6%) than in Richmond upon Thames (13.9%).
- More than 1 in 8 children in the lowest HLE areas grew overweight between entering primary school and starting secondary school.
- The majority of adults in the lowest HLE areas were not meeting the "five-a-day" healthy eating guideline.
- Over a third of adults in the lowest HLE areas were physically inactive defined as doing less than 30 minutes of physical activity of moderate intensity per week in 2015.
- Nearly twice as many people die from causes considered preventable in the lowest HLE areas compared with the highest.
2. What you need to know about this release
This report has used published data from a number of sources covering different samples and time periods, although the most recent data was used at the time of writing. It has created two distinct area clusters (highest and lowest), formed by ranking England’s upper tier local authorities (UTLAs) by their healthy life expectancy (HLE) at birth estimates for the period 2013 to 2015, and mostly used these to illustrate disparity in factors affecting health. In construction of statistics for these clusters, a combined indicator value was calculated, based on the aggregation of values for the UTLAs contained within them and weighting each according to the UTLA population size. For example among the authorities in the highest HLE areas, the indicator value for Oxfordshire was given more weight than that of Rutland because of its larger population size.
Some indicators are only available at the person level and male HLE at birth has been used for illustration in scatter plots; but the reference table contains female HLE at birth too. Therefore these scatter plots can be created to show the relationship between the person level indicator and female HLE at birth.
A number of indicators used in this report were sourced from the Public Health Outcomes Framework and details of indicator definitions and their data sources can be accessed from the Public Health Outcomes Framework data tool.
The Annual Population Survey (APS) was used for the construction of labour market, education and authority specific smoking prevalence by sex, and further information on the quality of this underlying data can be accessed from the APS Quality and Methodology Information Report. Estimates of Health State Life Expectancy and the membership of the authorities contained within the areas clusters based on the ranking of HLE can be accessed from the latest Health State Life Expectancy release.
Our Longitudinal Study is a large longitudinal data source that links census and vital events records and was used to estimate measures of life expectancy and survival by socioeconomic position. Further details of our Longitudinal Study can be accessed from our website.
At the outset it is necessary to qualify the limitations of this descriptive narrative requested by the review team. For example, it is not possible without further analysis, including longitudinal research, to state definitively what characteristics of each area or its population are most influential in determining its place in the “league table” of HLE. While the lifestyle and other factors discussed in this report are described mainly as illustrations of and contributors to the area-level HLE gap, it should be noted that the health status and behaviours of the local population also influence the nature of the area. For example, individuals or families suffering from long-term health problems or health-related unemployment may move to areas of lower cost housing because of their financial situation and thereby introduce selection effects.
Nôl i'r tabl cynnwys3. Introduction
This article brings together information about aspects of health-related lifestyles and the broader economic and social circumstances of people living in areas with the highest and lowest healthy life expectancy (HLE) at birth. The State Pension Age Review Working Group1 identified the stark contrast in life expectancy and HLE experienced by residents living in some parts of the UK compared to others. They requested a compilation of information that would help them to contextualise these differences in outcome in terms of how people lived their lives in relation to health, their level of education and their employment and socioeconomic position.
For this purpose we have explored readily available data and used published literature to compare and contrast local areas in England, on the basis of their most recent HLE at birth, across a range of indicators.
The phenomena explored were:
- employment and economic activity
- disability and health conditions
- educational attainment and other aspects of socioeconomic position
- smoking prevalence
- obesity
- consequences of alcohol misuse
- physical activity
- diet
- preventable mortality
This analysis mostly draws from the Public Health Outcomes Framework (PHOF) data tool and data available from the Annual Population Survey 2015. Some of the indicators considered are only available at person level; for simplicity they are plotted and illustrated using scatter plots against male HLE at birth to show the relationship.
3.1 Background
How individuals live their lives is influenced by the social determinants of health and as such health status is not simply a consequence of lifestyle choices. A complex interaction of factors shape individuals’ decisions that influence their health. Wider determinants of health such as education, work, access to resources, culture, environmental conditions, social capital are important. In addition, individual lifestyles, themselves shaped by values and beliefs about health, have been investigated as a means to understand the mechanisms at play that lead to inequality and how they can be tackled (Dahlgren, G and Whitehead, M, 1993).
A social gradient in health is well established, whereby health worsens with increasing socioeconomic disadvantage. Fair Society Healthy Lives (The Marmot Review), published in 2010, highlighted those living in the most deprived areas are more likely to have shorter life expectancy and experience a burden of poor health. Our recent analyses showed that males living in the least deprived areas lived on average 9.2 years longer than males living in the most deprived areas in 2013 to 2015 (ONS 2017); for females this gap was 7.1 years. This difference is somewhat wider in the quality of those years lived; for males the gap in HLE was 18.9 years; for females it was 19.6 years.
Another feature of disparity in healthy longevity, which the State Pension Age Review team highlighted as concerning, was geographical, particularly the North-South health divide. The North of England has consistently had poorer health than the rest of England, with the gap widening over four decades (Hacking, JM et al 2011). An inquiry on Health Equity for the North published in 2014 showed the North of England was particularly affected by the drivers of poor health with two distinct features:
- deprivation is not uniformly spread across the country. In fact, whilst the North represents 30% of the English population, it includes 50% of the poorest areas in the country
- poor neighbourhoods in the North tend to have worse health than other areas in England with similar levels of poverty
The social gradient in health was steepest in the North, showing more marked contrasts between the least and most deprived areas than in England as a whole (Due North, University of Liverpool and Centre for Local Economic Strategies 2014). However, this should not detract from the fact that in London particularly, the contrast in levels of exposure to deprivation can be among the largest.
3.2 Data
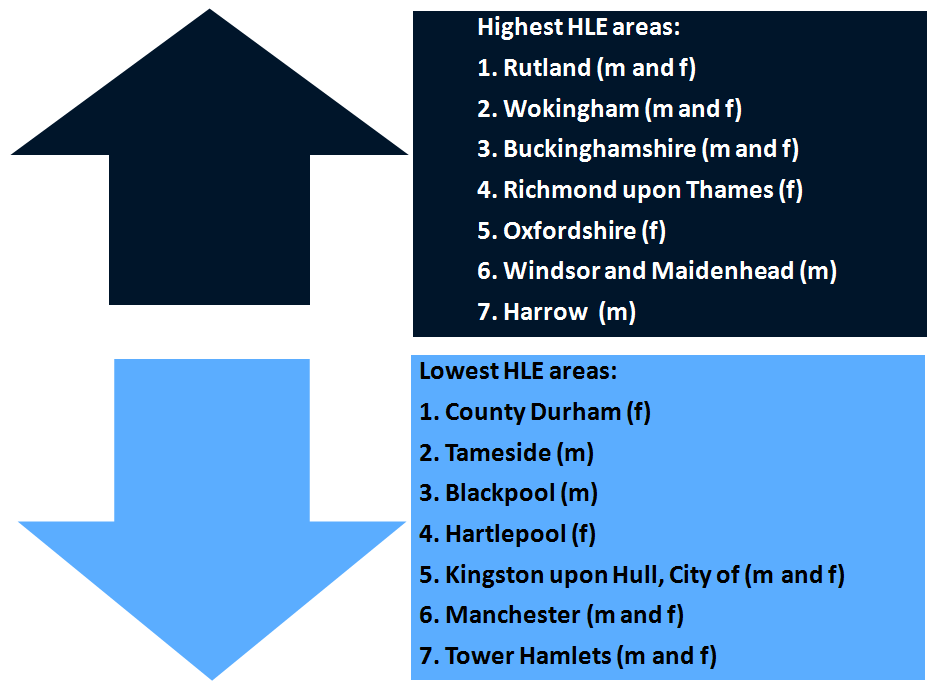
To provide a context for variability in lifestyles and behaviours as well as some of the wider determinants of health, a small subset of England’s UTLAs2 were grouped into two clusters based on their healthy life expectancy (HLE) rank for the period 2013 to 2015; specifically, the top and bottom five authorities with the highest and lowest HLE at birth in England were grouped into two clusters taking account of both male and female HLE, producing a grouping of seven authorities in each cluster as the top and bottom five for each sex were not identical. The composition is shown in Figure 1.
Figure 1: Grouping of authorities into the High and Low HLE clusters
Source: Office for National Statistics
Notes:
- “m” denotes the UTLA was in the top or bottom 5 for male HLE at birth. “f” denotes the UTLA was in the top or bottom 5 for female HLE at birth. “m and f’” denotes the UTLA was in the top or bottom 5 for both male and female HLE at birth.
Download this image Figure 1: Grouping of authorities into the High and Low HLE clusters
.png (34.3 kB)
For these clusters, indicators were calculated. Further analyses in this report predominantly focuses on these top and bottom ranking UTLAs, referring to them as the “Highest HLE” and “Lowest HLE” areas. An examination of the figure above shows that areas with the highest HLE, apart from Rutland, were located in the South, while those with the lowest HLE, apart from Tower Hamlets, were located in the North.
3.3 Measurement
Life expectancy (LE) at birth in England has been increasing consistently since the first estimates began in 1951 ONS (2015) and increased by 12.6 years in the 50 years between 1951 and 2011 for males and by 11.3 years for females. If living a longer life indicates health improvements, we would want to discover whether the additional years lived were spent healthy. Healthy life expectancy (HLE) looks at the number of years one could expect to live in good health. This is estimated from how individuals rate their health status in terms of “very good” or “good health” when answering the following question;
“How is your health in general; would you say it was…very good, good, fair, bad or very bad?”
This question aims to measure subjective health related well-being taking account of how in general you perceive your health and encompasses mental as well as physical aspects. While it relies on subjective self-reports, this single item question is easy to understand and administer in surveys. A large meta-analysis (a compilation of similar studies aggregated to increase statistical power) published in 2006 demonstrated that responses to a simple, single-item general self-reported health survey question had a strong, significant and independent association with future mortality risk even after adjustment for key covariates such as functional status, depression, and co-morbidity, with the relationship persisting over long follow-up periods (De Salvo, K.B et al 2006).
Notes for introduction:
John Cridland CBE was appointed on 1st March 2016 to carry out the review, supported by a team of civil servants seconded to the independent Review. The Review was tasked with making recommendations on a suitable State Pension age, with the key objectives of supporting affordability, fairness and fuller working lives.
Upper tier local authorities in England are composed of counties, metropolitan boroughs and unitary authorities, totalling 152. However for statistical purposes, the City of London and Isles of Scilly are excluded.
4. The wider determinants of health
4.1 Economic position
More than a third of 25- to 64-year-olds in the lowest HLE areas are economically inactive because they are long-term sick or disabled
Using 2015 data from the Annual Population Survey (APS), the economic position of people living in the highest and lowest healthy life expectancy (HLE) clusters were compared. Figure 2 illustrates the inequality in using three standard measures of economic position.
Figure 2: Economic Positions in the highest and lowest Healthy Life Expectancy (HLE) areas and in England, 2015
England
Source: Office for National Statistics, Annual Population Survey 2015
Notes:
- Employed is the number of employed people aged 16 to 64 divided by the population aged 16 to 64.
- Unemployed is the number of unemployed people aged 16 and over divided by the sum of employed people aged 16 and over and unemployed people aged 16 and over.
- Economically Inactive is the number of economically inactive people aged 16 to 64 divided by the population aged 16 to 64.
Download this chart Figure 2: Economic Positions in the highest and lowest Healthy Life Expectancy (HLE) areas and in England, 2015
Image .csv .xlsRates of employment were clearly distinct; in areas with the lowest HLE, two in every three residents aged 16 to 64 were in employment, compared with almost four in every five in areas with the highest HLE, a 12.0 percent difference in the employment rate.
Additionally, there are differences in the proportion of people aged 16 and over that were unemployed; while the England average in 2015 was 5.1%, unemployment rates were more than twice as high in areas with the lowest compared with the highest HLE (7.8% and 3.7% respectively).
There is also a clear relationship between an authority’s male unemployment rate and their healthy life expectancy at birth (figure 3).
Specifically, as unemployment reduces, HLE tends to increase. The male unemployment rate was more than eight times higher in Hartlepool (11.7%) compared with Warwickshire (1.4%); while the gap in male HLE at birth between these authorities was 11 years. However there were outliers such as Tameside with a relatively low unemployment rate of 4.5% and a male HLE at birth of 56.4 years; in contrast Rutland had a similar unemployment rate of 4.2%, but there HLE was 71.1 years.The relationship between male unemployment and mortality rates has been investigated using longitudinal data which found exposure to unemployment raising the risk of premature mortality and mortality more generally over relatively long follow-up periods (White, C. et al 2005 and 2007). The relationship between self-rated health and unemployment has also been investigated, suggesting exposure increases risk of reporting low self-rated health (Bartley, M. 1994).
Figure 3. Unemployment in 2015 as an indicator of male HLE at birth between 2013 and 2015: England’s UTLAs1
Source: Office for National Statistics, Annual Population Survey, 2015; 2016
Notes:
- Data is presented for 150 of the 152 upper tier local authorities in England. Isles of Scilly and City of London have been excluded in the HLE data due to small sample numbers.
- If a line of best fit based on linear regression were to be placed between the data points, it would indicate the gradient in HLE and how HLE varies by level of unemployment rate on average. The strength of this relationship is estimated using R2 which for this relationship has a value of 0.42 (the closer the R2.value is to 1 the stronger the relationship). The line of best fit is constructed using the linear equation y=a+bx, where a represents the average HLE when the unemployment rate equals 0%, b is the slope of the line (the regression coefficient), x is the authority’s unemployment rate and y is the fitted HLE. In this instance a =68.3 and b = -0.99.
Download this chart Figure 3. Unemployment in 2015 as an indicator of male HLE at birth between 2013 and 2015: England’s UTLAs^1^
Image .csv .xlsA third measure of economic position is the proportion of working age adults (16 to 64) economically inactive (those not seeking work and not in employment). In the lowest HLE areas, more than 1 in 4 were economically inactive (27.1%) compared to less than 1 in 5 in the highest (17.8%). Overall, just over a 1 in 5 of England’s working age population (22.0%) was economically inactive.
The government in 2016 released their Work, health and disability green paper: improving lives, a joint initiative between the Department for Work and Pensions and the Department of Health, where the importance of health and work and their inter-dependency are emphasised. The State Pension Age Review team had identified the high rate of economic inactivity in low HLE areas among those of working age (figure 2), and this is something the government wish to tackle through inter-departmental action.
The rate of economically inactive adults of working age was more than 50% higher in the lowest HLE areas compared with the highest, and exceeded a quarter of those of working age in these areas. The reasons why people are economically inactive vary; the most common reasons are illustrated in figure 4, which focuses on the age group 25 to 64 to largely remove the body of economically inactive students.
Figure 4. Most common reasons for economic inactivity among those aged 25 to 64 in the highest and lowest HLE areas and in England, 2015
England
Source: Office for National Statistics, Annual Population Survey, 2015
Download this chart Figure 4. Most common reasons for economic inactivity among those aged 25 to 64 in the highest and lowest HLE areas and in England, 2015
Image .csv .xlsIndividuals living in the highest HLE areas were twice as likely to be retired or state they did not need or want work before the age of 65 (28.5% compared to 14.3%). The scale of this difference may point to relative affordability of early retirement, as well as differences in health deficits impacting on ability to work. The general picture in England for this measure (23.6%), is clearly more closely aligned to the highest HLE areas than the lowest.
Looking after the home or family was the most common reason why 25- to 64-year-olds stated they were economically inactive in England (34.0%) and in areas with the highest HLE (41.7%); however, in the lowest HLE areas it was only the second most common reason (32.3%). Again this may be related to the affordability of relying on one income but it could also be related to differences in the provision of unpaid care. Among females, more than half in the highest HLE areas were economically inactive on grounds of looking after the home and family, and 45% in the lowest HLE areas.
Some people do not participate in the labour market, by either working or seeking work, due to long-term sickness or disability. As this report is exploring potential reasons why HLE varies in some parts of the England compared with others, it would be expected to observe differential levels of disability within the highest and lowest HLE areas. For example, more than a third (35.9%) of 25 to 64 years olds living in the lowest HLE areas were not economically active in 2015 due to long term sickness or disability, which was the most common reason to be economically inactive in these areas. This compares to just 15.2% of people living in the highest HLE areas; in England it was 27.6%. Economic inactivity on grounds of long-term sickness or disability was much higher for males than females both in the highest and lowest HLE areas. In the lowest, more than half of men aged 25 to 64 (51.2%) were economically inactive for this reason, while it was just over a quarter (27.5%) in the highest.
Across England’s UTLAs, the proportion of people aged 25 to 64 who were economically inactive because of long-term sickness or disability was highest in Knowsley at 50.2% and lowest in Central Bedfordshire at 10.3%, representing an almost five-fold inequality on this measure between these authorities. Knowsley CCG at the time of the 2011 Census was shown to have the highest proportion of its residents providing 50 hours or more unpaid care to family members or friends (ONS 2014), another factor influencing labour market participation and a likely consequence of the higher numbers long-term sick or disabled in that authority.
Nearly half of economically inactive people in Blackpool aged 25 to 64 were so because of long-term sickness or disability (47.2%), which highlights the fact that among the lowest HLE areas, an individual’s ability to work or seek work is to some extent constrained by health conditions and illness which may result in them being unfit to work. The HLE gap may also be increased by individuals with long-term health problems differentially moving to more deprived areas with lower housing costs, and healthier “upwardly mobile” individuals moving to more affluent areas.
Disability, defined as being limited in daily activities because of a physical or mental health condition lasting a year or more in response to survey questions, and its extent were also widely contrasting in areas with the highest and lowest HLE among those of working age 16 to 64 (figure 5).
Figure 5. Prevalence of chronic illness and disability in the highest and lowest HLE areas and in England, persons aged 16 to 64 in 2015
England
Source: Office for National Statistics, Annual Population Survey, 2015
Notes:
- Disability is defined as being limited in daily activities because of a physical or mental health condition lasting a year or more.
Download this chart Figure 5. Prevalence of chronic illness and disability in the highest and lowest HLE areas and in England, persons aged 16 to 64 in 2015
Image .csv .xlsAlmost 1 in 3 residents in the lowest HLE areas reported having a physical or mental health condition lasting a year or more compared to less than 1 in 4 in the highest HLE areas. However, when asked whether the condition reduced their ability to carry out normal daily activities, the contrast became more acute, especially when considering the reporting of the more severe category of being “limited a lot”. In the lowest HLE areas, approximately 1 in 3 of residents with a physical or mental health condition lasting a year or more of working age were ‘limited a lot’ in daily activities (32.2%). This compares with only 15.9% in the highest HLE areas. Overall, just over 1 in every 10 residents of working age were ‘limited a lot’ in the lowest HLE areas whereas it was less than 1 in every 25 in the highest HLE areas (figure 5).
Of the areas with the lowest HLE, males in County Durham were expected to spend the largest number of years “limited a lot” in daily activities (9.8 years) in 2010 to 2012 which was more than twice as long as males in Wokingham (4.8 years). This is despite males in County Durham living 3.6 years less than males in Wokingham in the same period (ONS 2016).
4.2 Socioeconomic position
'Fair Society Healthy Lives' (The Marmot Review 2010) was an independent review into the state of health inequality in England, containing a wealth of research to make judgements supporting evidence-based strategies for reducing health inequalities. The report highlighted differences in mortality rates between people working in less skilled jobs compared to managerial positions.
A recent investigation into the most common age at death (ONS 2017) compared longevity using alternative measures of life expectancy in addition to the traditional measure. It showed marked contrasts in the median and modal age at death by a measure of socioeconomic position based on occupation, the National Statistics Socioeconomic Classification (NS-SEC) . This demonstrated that mortality rates varied markedly depending on current or previous occupational circumstances, and for children, on that of their parents. The median represents the age at which half a typical cohort would still be alive; the mode represents the most common age at death (figure 6). Further details on the definition of the median and the mode can be found in the release the most common age at death (ONS 2017).
For males assigned to the higher managerial and professional class it was expected that half a typical cohort would still be alive between the ages of 84 and 85, and the highest number of deaths would occur between the ages of 86 and 87. Males assigned to the routine class had a median age at death 5.5 years lower and a modal age at death 2.4 years lower. However the gap in the median and mode was less than that measured by traditional mean life expectancy. For females, the same class contrasts showed a 4.0 year gap in the median and a 2.7 year gap in the mode. Both the median and the mode were higher among higher managerial and professional males than it was among routine females, suggesting socioeconomic advantage compensates somewhat for gender disadvantage with regards to longevity.
Figure 6. Male and Female longevity represented by the mean, median and mode for selected NS-SEC classes: England and Wales 2007 to 2011
England and Wales
Source: Office for National Statistics, Longitudinal Study
Download this chart Figure 6. Male and Female longevity represented by the mean, median and mode for selected NS-SEC classes: England and Wales 2007 to 2011
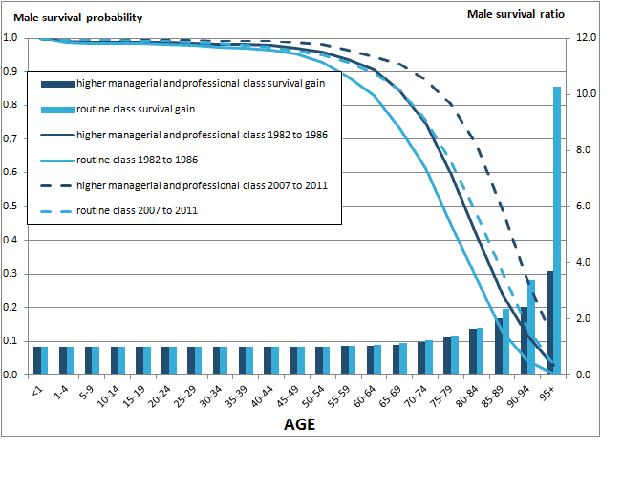
Image .csv .xlsThe gain and inequality in longevity by socioeconomic classes between 1982 to 1986 and 2007 to 2011 can also be illustrated using survival curves (figure 7).
Apart from the significant change in survival to older ages over the 30-year period for both sexes in each class, males gained more than females. Among males the gain was strongest for those assigned to the routine occupations in ages 75 and above. Among females this was also true except for ages 90 to 94, but the difference in the gain was smaller than for males.
Figure 7a: Probability of survival and survival ratio for males by age and socio-economic position between 1982 to 1986 and 2007 to 2011
England and Wales
Source: Office for National Statistics, Longitudinal Study
Notes:
- Survival ratio is calculated by dividing two survival probabilities, showing the size of survival improvement over 30 years.
- Survival probabilities are measured using the conditional probability of death (qx) from the life table, for more detail on life table please see our website.
- Class-1 represents males in higher managerial and professional occupations
- Class-7 represents males in routine occupations
Download this image Figure 7a: Probability of survival and survival ratio for males by age and socio-economic position between 1982 to 1986 and 2007 to 2011
.png (33.8 kB)
Figure 7b: Probability of survival and survival ratio for females by age and socio-economic position between 1982 to 1986 and 2007 to 2011,
England and Wales

Source: Office for National Statistics, Longitudinal Study
Notes:
- Survival ratio is calculated by dividing two survival probabilities, showing the size of survival improvement over 30 years.
- Survival probabilities are measured using the conditional probability of death (qx) from the life table, for more detail on life table please see our website.
- Class-1 represents males in higher managerial and professional occupations
- Class-7 represents males in routine occupations
Download this image Figure 7b: Probability of survival and survival ratio for females by age and socio-economic position between 1982 to 1986 and 2007 to 2011,
.png (45.0 kB) .xls (30.2 kB)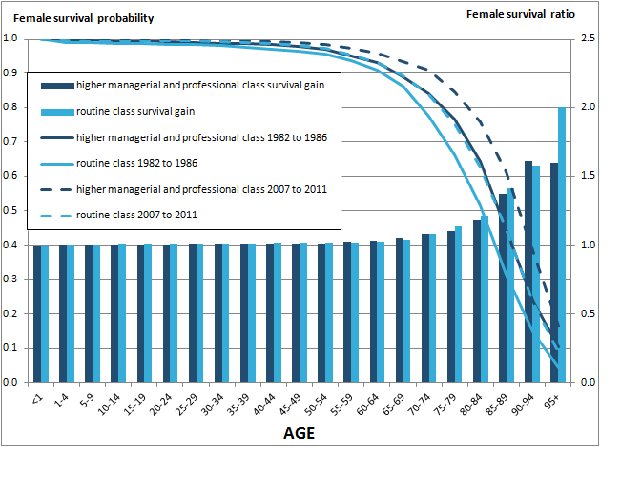
As Figure 7 shows, socioeconomic class has an important influence on mortality outcomes; the socioeconomic composition of these areas at 2011 Census is shown in Figure 8 and is likely to affect survival in these area clusters.
Figure 8. Socioeconomic composition of the highest and lowest HLE areas in England in 2011, persons aged 16 to 74
England
Source: Office for National Statistics, Census 2011
Notes:
- A person is defined as long-term unemployed at the time of the 2011 Census if they were unemployed and the year they last worked was 2009 or earlier.
- To assign a person (aged 16 to 74) to an NS-SEC category at the 2011 Census, the current or most recent occupation title was combined with employment status, whether they are employed or self-employed and whether or not they manage or supervise other employees.
Download this chart Figure 8. Socioeconomic composition of the highest and lowest HLE areas in England in 2011, persons aged 16 to 74
Image .csv .xlsAs can be observed from Figure 8, a greater proportion of the population age 16 to 74 were in Routine and Manual occupations (those working to routine, semi-routine and lower supervisory and technical occupations) in the lowest HLE areas (45.1%). Conversely people in Managerial and Professional occupations (those working in higher or lower managerial or professional occupations)were much more common in the highest HLE areas (45.9%). In addition, unemployment and its duration has been shown to be an important risk factor for premature mortality (Morris JN et al 1994); in the lowest HLE areas, the percentage of people reporting they were long-term unemployed at the 2011 Census was more than twice that in the highest HLE areas.
4.3 Education
Education is another important influence on health and impacts on access to the labour market. Unemployment rates are higher for adults with few or no qualifications and skills. Analysis of the 2015 Annual Population Survey suggests people living in the highest HLE areas are better educated than those in the lowest (Figure 9).
Figure 9: Highest qualification level among those aged 25 to 64 in the highest and lowest HLE areas in 2015 using the National Qualifications Framework1
England
Source: Office for National Statistics, Annual Population Survey, 2015
Download this chart Figure 9: Highest qualification level among those aged 25 to 64 in the highest and lowest HLE areas in 2015 using the National Qualifications Framework^1^
Image .csv .xlsA greater proportion (56.8%) of 25- to 64-year-olds in the highest HLE areas had qualifications at National Qualification Framework level 4 or above (such as a degree or Higher Professional Diploma), compared to only 36.5% in the lowest HLE areas, while the England average was 40.9%. Furthermore, the lowest HLE areas had a greater proportion of adults with no qualifications at all (12.8%), which was 50% higher than in England overall (8.6%) and nearly three times higher than in the highest HLE areas.
A graded relationship between the level of qualifications and health is evidenced with adults with no qualifications being the least likely to report their general health as either “very good”, or “good”. However, in each separate educational category those living in the lowest HLE areas had worse general health than those living in the highest, showing the importance of area context contributing to health disparities (figure 10).
Figure 10: Percent reporting their general health as "very good" or "good" by educational level among those aged 25 to 64, in highest and lowest HLE areas, 2015
England
Source: Office for National Statistics, Annual Population Survey, 2015
Download this chart Figure 10: Percent reporting their general health as "very good" or "good" by educational level among those aged 25 to 64, in highest and lowest HLE areas, 2015
Image .csv .xlsThe socioeconomic gap in reported health, using education as a measure, was wider in the lowest HLE areas: the absolute difference in those reporting their general health as either “very good” or “good” was 34.8% between the highest and lowest educated, while in the highest HLE areas this difference was only 18.0%. Even those with no qualifications in the highest HLE areas reported better health than those in the categories “other qualifications”, “below NQF level 2 qualifications” and “trade apprenticeships”.
Differences in HLE related to education are likely to be closely connected to other factors such as occupation, income and social capital. Individuals living in more deprived areas may have had less educational opportunities than others, and may be less likely to be either geographically or socially mobile.
Nôl i'r tabl cynnwys5. Lifestyle and consequences
5.1 Smoking
Smoking prevalence was nearly three times higher in Hull than in Wokingham
Smoking prevalence is on a long-term decline since the seventies; 16.9% of people in England were current smokers in 2015. For males, just under a fifth smoke now, and for females just over a seventh. This compares with half of men and two-fifths of women in 1974. Long-term persistent smoking has a harmful impact on health and it is the largest cause of preventable ill health and premature mortality in England with around 1 in every 6 deaths attributed to smoking (Statistics on Smoking, NHSD 2016).
People living in areas with the lowest HLE were 1.7 times more likely to smoke than those living in the highest HLE areas in 2015 (figure 11). In Wokingham, among the highest HLE areas, just 9.5% of its residents smoked; whereas in Kingston-Upon-Hull, among the lowest HLE health areas, it was close to 3 times higher at 26.8%, a gap of 17.3 percentage points.
Figure 11: Smoking prevalence in adults in the highest and lowest HLE areas by sex, 2015
England
Source: Office for National Statistics, Annual Population Survey, 2015
Download this chart Figure 11: Smoking prevalence in adults in the highest and lowest HLE areas by sex, 2015
Image .csv .xlsWhile men’s smoking prevalence is higher than women’s on average, there were a third more women smokers in the lowest HLE areas than there were men smoking in the highest HLE areas. It is also interesting to note that the most advantaged males significantly outlived the most disadvantaged females in 2007 to 2011 (ONS 2015) suggesting socioeconomic advantage can compensate for gender disadvantage in relation to its association with healthy lifestyles (figure 11). In addition, the contrast in smoking prevalence is clearly present between the highest and lowest HLE areas for each sex; moreover, each UTLA in the low HLE cluster had a higher smoking prevalence than England, and conversely a lower smoking prevalence than England among UTLAs in the highest HLE cluster.
For illustrative purposes it is possible to plot smoking prevalence for each UTLA in England and fit a trend line through it (figure 12).
Figure 12: Smoking prevalence (2015) and healthy life expectancy at birth (2013 to 2015) for males in UTLAs in England1
Source: Office for National Statistics, Annual Population Survey, 2015; ONS 2016
Notes:
- Data is presented for 150 of the 152 Upper Tier Local Authorities in England. Isles of Scilly and City of London have been excluded in the Healthy Life Expectancy data due to small sample numbers.
- Please refer to note 2 in figure 3 for definitions of R2 and the regression equation. R2 = 0.37, a = 74.66 and b = -0.612
Download this chart Figure 12: Smoking prevalence (2015) and healthy life expectancy at birth (2013 to 2015) for males in UTLAs in England^1^
Image .csv .xlsHere the extremes of smoking prevalence for males between authorities falling into the highest and lowest HLE areas can be identified by hovering over the data points (Manchester is towards the bottom left and Wokingham identified with a gold dot). Male smoking prevalence was more than two and half times higher in Manchester compared with Wokingham, and the gap between these areas in male HLE at birth was 15 years. Figure 12 is a guide to the potential beneficial effect on HLE of an area reducing its smoking prevalence as UTLAs with lower prevalence generally have higher HLE.
For females, smoking prevalence among adults was highest in Kingston-upon-Hull (27.3%) and lowest in Redbridge (7.6%), 3.6 times higher. A similar pattern of lower smoking prevalence associated with higher HLE at birth was also present for females.
While smoking is an important risk factor for many diseases causing illness, disability and premature mortality, it is just one factor contributing to variations in health outcomes. For example, male smoking prevalence is similar in the relatively high HLE authority of Enfield (23.1%) to that in the relatively low HLE authority of Tameside (23.5%); but the male HLE at birth gap was 12 years between these authorities.
Addiction to smoking can start early as smoking is largely taken up in childhood and adolescence. In 2014, the What About Youth Survey estimated the prevalence of current smokers at age 15 among boys in Blackpool was 12.2%, which was only 3.1% higher than boys in Richmond upon Thames (9.1%). Among girls Blackpool had a lower prevalence (14.8%) than Richmond upon Thames (19.8%). However, these disparities at age 15 were not mirrored in the adult population of these authorities. Research has demonstrated that people from more affluent backgrounds are more likely to be able to quit smoking later in life. This is illustrated in figure 13 which looks at smoking prevalence by broad age group.
Figure 13: Smoking Prevalence in Adults in the highest and lowest HLE areas by age and sex, 2015
England
Source: Office for National Statistics, Annual Population Survey, 2015
Download this chart Figure 13: Smoking Prevalence in Adults in the highest and lowest HLE areas by age and sex, 2015
Image .csv .xlsAmong those living in the highest HLE areas there is a clear pattern of falling prevalence with increasing age for both males and females; however, the prevalence of smoking in the lowest HLE areas is actually higher at ages 30 to 49 than it is among those aged 18 to 29.
The proportion of cigarette smokers who have quit is not primarily due to differences in wanting to quit smoking but rather due to the higher levels of smoking in less affluent areas, resulting in greater levels of nicotine dependency (Healthy Lives, Healthy People: A Tobacco Control Plan for England, Department of Health 2011). High adult smoking prevalence as well as local cultures of smoking, such as smoking with friends and family is socially reinforcing smoking behaviour and therefore acts as a barrier to being able to quit. For example, a 15-year-old living with a parent who smokes is 80% more likely to smoke compared to a 15-year-old living in a smoke free household (Loureiro et al, 2010).
Blackpool also had the worst rate of smoking during pregnancy in the country, with over a quarter (27.2%) of women in Blackpool known to be smoking at the time of delivery. This is more than twice the national average of 11.4%. Smoking during pregnancy is known to negatively impact pregnancy-related health and can include complications during childbirth, an increased risk of miscarriage, premature birth, stillbirth, low birth weight and sudden unexpected death in infancy, so a decrease in maternal smoking is expected to result in health benefits for both mother and child (Department of Health 2011).
5.2 Obesity
Obesity prevalence in adults was more than two times higher in Kingston-upon-Hull (30.6%) compared with Richmond upon Thames (13.9%)
The Body Mass Index (BMI) is defined as weight in kilograms divided by the square of height in metres, and represents a proxy measure of excess weight and obesity, but it does not give an indication of how fat is distributed across the body. For the purposes of this analysis, BMI is used to compare the relative levels of obesity across areas. Central adiposity, where body fat is accumulated around the waist, is thought to be more damaging for health compared to fat deposited in other parts of the body (National Obesity Observatory 2009) but data on this measure are less readily available.
Based on figures from the Active People Survey covering the period of 2013 to 2015, nearly a quarter of adults in England (24.4%) were obese as defined by having a Body Mass Index (BMI) ≥ 30. However, obesity is not uniformly prevalent across the country (figure 14).
The percentage of residents classified as obese ranged from 13.7% in Kensington and Chelsea to 33.8% in Barnsley. Over 1 in 3 adults in Barnsley were classified as obese compared to less than 1 in 7 within Kensington and Chelsea; in this London borough males were expected to live 12.7 years longer in good health compared to males in Barnsley and 10 years longer for females. Richmond upon Thames had the lowest prevalence of adult obesity (13.9%) among the highest HLE areas, while Kingston-upon-Hull had the highest prevalence (30.6%) among the lowest HLE areas. Overall, there is a weaker, but still significant, relationship between an UTLA’s male and female HLE at birth and its prevalence of obesity (figure 14) than was the case for smoking. In general, authorities with lower prevalence of obesity though had a higher HLE for each sex.
Figure 14: Prevalence of adult obesity as an indicator of male healthy life expectancy at birth: UTLAs¹
England 2013 to 2015
Source: Office for National Statistics, Active People Survey, 2013 to 2015
Notes:
- Data is presented for 150 of the 152 Upper Tier Local Authorities in England. Isles of Scilly and City of London have been excluded in the Healthy Life Expectancy data due to small sample numbers.
- Data for obesity prevalence is for persons as sex specific estimates were not available at local authority level.
- Please refer to note 2 in figure 3 for definitions of R2 and the regression equation. R2 = 0.21, a = 72.53 and b = -0.40.
Download this chart Figure 14: Prevalence of adult obesity as an indicator of male healthy life expectancy at birth: UTLAs¹
Image .csv .xlsTower Hamlets had the lowest HLE in England for each sex, but had one of the lowest proportions of obese adults at 14.9% compared to the England average of 24.4%. One possible explanation could be the large ethnically diverse local population (nearly four times higher than nationally); research evidence suggests that BMI may not necessarily be an equally valid measure across all population groups, especially ethnic groups. For example, adults of South Asian origin are more prone to carrying excess fat centrally compared to the White population. Therefore, a low BMI could mask an elevated obesity related health risk (National Obesity Observatory 2009)
Excess weight (where BMI is greater than or equal to 25 kg/m2) and obesity are the fifth leading risk factor of global mortality and account for 5% of global deaths Global recommendations on physical activity, WHO (2010) . As such, the cost of excess weight and obesity to society and the economy was estimated to be £16 billion in 2007 Healthy Lives, Healthy People: A Call to Action on Obesity in England, Department of Health (2011).
In England, the risk of excess weight in children increases as they get older; the proportion of children with excess weight increases from just over a fifth (21.9%) in 4- to 5-year-olds to a third (33.2%) in 10- to 11-year-olds. The increase in excess weight between entering primary school and starting secondary school occurs for areas with the lowest as well as the highest HLE (figure 15).
Figure 15: Percentage of overweight children at ages 4 to 5 and ages 10 to 11 in the highest and lowest HLE areas
England 2014 to 2015 school year
Source: National Child Measurement Programme
Download this chart Figure 15: Percentage of overweight children at ages 4 to 5 and ages 10 to 11 in the highest and lowest HLE areas
Image .csv .xlsIn England, 1 in every 9 children grew overweight between starting primary and starting secondary school. In the highest HLE areas it was 1 in every 10 children between these stages; in the lowest HLE areas, it is more than 1 in every 8 children.
Looking at 2014 to 2015 data from the National Child Measurement Programme further shows the lowest HLE areas all had a greater proportion of overweight children at reception age compared to the national average. Focusing on the areas with the highest and lowest HLE in the country, Tower Hamlets had the largest increase in excess weight prevalence between 4- to 5-year-olds and 10- to 11-year-olds, with 19.4% more children of excess weight at ages 10 to 11, increasing from 22.5% among 4- to 5-year-olds to 41.9% among 10- to 11-year-olds. This is somewhat divergent from the obesity prevalence estimated for adults in this borough.
5.3 Alcohol
Alcohol-related hospital admissions were three and a quarter times higher in Blackpool compared to Wokingham in the tax year ending 2015
Alcohol consumption is considered to be the third-most sizeable lifestyle risk factor for disease and death in the UK, after smoking and obesity. Alcohol consumption contributes to a wide range of health conditions including chronic diseases such as liver disease, diabetes and cardiovascular disease as well as cancers such as breast and gastrointestinal. These health conditions impact on hospital admissions and death rates; the alcohol-related harm costs on the UK were estimated at £21 billion a year: The Government's Alcohol Strategy, HM Government (2012).
Looking at the drinking habits of adults in Great Britain in 2014, shows the majority of the population are drinkers. The number of people reporting drinking alcohol in the previous week was 28.9 million, which equates to 58% of the population. Of these, 2.5 million (9%) drank more units of alcohol in one day than the low risk weekly drinking guideline of not more than 14 units. Almost 1 in 5 higher earners (18%) with an income of £40k or more drank alcohol on at least 5 days of the week compared to less than 1 in 10 of lower earners with an income of less than £10k (Adult drinking habits in Great Britain: 2014, ONS (2016)). Although this suggests that frequent drinkers were more likely to be in more advantaged socio-economic areas, it is more useful to focus on an indicator where the negative impact of alcohol can be measured as the longevity and amount consumed are important considerations as well as the frequency of drinking.
A proxy measure for the harmful effects of drinking is the number of occasions where acute healthcare is required as a result, which can be measured through Hospital Episode Statistics. The national rate of alcohol-related admissions in England for males and females combined during the financial year ending (FYE) 2015 was 634.7 per 100,000; but there were large differences in the rate of admission for alcohol-related conditions across the country. Figure 16 shows the contrast for males and its relationship with male HLE at birth.
Figure 16. Admission episode rates for alcohol related conditions and healthy life expectancy at birth for males in England’s Upper Tier local Authorities1
Source: Public Health England
Notes:
- Data is presented for 150 of the 152 Upper Tier Local Authorities in England. Isles of Scilly and City of London have been excluded in the Healthy Life Expectancy data due to small sample numbers.
- Admission episodes are based on the tax year for 2014 to 2015; Healthy life expectancy is based on a three year aggregation of calendar years for the period 2013 to 2015
- Value for Hackney and City of London combined; value for Cornwall & Isles of Scilly combined
- Please refer to note 2 in figure 3 for definitions of R2 and the regression equation. R2 = 0.55, a = 75.04 and b = -0.015
Download this chart Figure 16. Admission episode rates for alcohol related conditions and healthy life expectancy at birth for males in England’s Upper Tier local Authorities^1^
Image .csv .xlsFor example, by comparing the extremes, the rate of admission episodes among males was more than three times greater in Blackpool (1,544.0 per 100,000) compared to Wokingham (493.6 per 100,000). These areas are starkly contrasting in terms of male HLE at birth; men in Wokingham were expected to live 14.2 more years in good health compared to men in Blackpool in 2013 to 2015. The rate of admissions for alcohol-related conditions is strongly negatively associated with HLE for males, meaning areas with the lowest HLE were more likely to have a higher rate of alcohol-related admissions. However the relationship with female HLE at birth was somewhat weaker, despite being in the same direction.
On the basis of the relationship shown in Figure 16, it suggests that reducing Blackpool’s male admission rate to a commensurate level observed in England as a whole (817.6 per 100,000) by tackling the underlying causes that result in such a high admission rate could produce improvements in its male HLE at birth.
However, Figure 16 shows there are outliers to the general pattern. One authority (Rutland), which has the highest HLE for males at birth, had an admission rate for alcohol related conditions among males (746.6 per 100,000) somewhat higher than Wokingham, and of similar magnitude to Tower Hamlets (761.0 per 100,000), the authority with the lowest HLE for males. Rutland’s small population (37,600) is older and less diverse; only 2.9% of the population are from Black and Minority Ethnic groups (ONS 2012) and nearly a quarter (23.2%) are aged 65 years and over. Conversely, Tower Hamlets is considerably more ethnically diverse. Research overall indicates most ethnic minority groups have higher abstinence or lower levels of drinking alcohol compared to people from White backgrounds. (Joseph Rowntree Foundation 2010).
Furthermore, rates of hospital activity for any condition depend to some extent on the availability of the relevant services in each area. Some areas might have similar drinking behaviour but higher or lower rates of alcohol-related admissions than expected because local hospitals provide relevant specialist services, lack appropriate resources, or are harder or easier to access.
The rate of alcohol-related admissions also differs by gender; the rate is higher for males than females. For example, the male rate in Wokingham is 493.6 per 100,000 compared to 280.8 per 100,000 for females; the rate in Blackpool for males was 1,544.0 per 100,000 and 919.7 per 100,000 for females. The gender difference progresses through to death as the majority of alcohol-related deaths in the UK in 2014 were among males (65%) (ONS 2016).
The rate of alcohol related admissions for persons in the FYE 2015 in the lowest HLE areas exceeded that of the highest by 59% (802.4 per 100,000 compared to 506.2 per 100,000). The alcohol admissions rate in the highest HLE areas is also 20% lower than the average for England (634.7 per 100,000).
Research has shown links between patterns of alcohol use and other aspects of lifestyle. Blackpool had the highest rate of deaths from drug misuse in England in 2012 to 2014 with 15.9 deaths per 100,000, more than five times the national average of 3.1 per 100,000 (ONS 2016). Furthermore, anti depressants prescriptions using NHS digital data showed that a third of Blackpool’s residents were prescribed anti-depressant medication in 2013 (Nuffield Trust and Health Foundation, 2014).
Recent research has investigated an “alcohol harm paradox” (Alcohol Research UK, 2015); while consumption of alcohol may be greater among people of higher socioeconomic position, the harmful effects of consumption is more concentrated in those of lower socioeconomic position in terms of admissions to hospital and from alcohol-related mortality. This research cited differences in propensity for binge drinking, beverage choice and patterns of heavy drinking as important factors.
5.4 Physical activity and inactivity
Over a third of adults in the lowest HLE areas were physically inactive under the government’s definition
The definition of physically active adults is undertaking 150 minutes (2.5 hours) of moderate activity per week, in bouts of 10 minutes or more. The guideline is in recognition of the impact of physical activity on health. In 2015, over half of adults measured using the Active People Survey (57.0%) were meeting this recommendation in England but there were differences between the highest and lowest HLE areas (figure 17).
Figure 17: Proportion of adults (aged 16 and above) meeting the Chief Medical Officer’s physical activity guidelines in the highest and lowest HLE areas and England, 2015
Source: Public Health England
Notes:
- The number of respondents aged 16 and over doing at least 150 “equivalent” minutes of at least moderate intensity physical activity per week in bouts of 10 minutes or more in the previous 28 days expressed as a percentage of the total number of respondents aged 16 and over.
Download this chart Figure 17: Proportion of adults (aged 16 and above) meeting the Chief Medical Officer’s physical activity guidelines in the highest and lowest HLE areas and England, 2015
Image .csv .xlsLooking specifically within the lowest and highest HLE areas, the greatest difference between local authorities is 20.6% between Blackpool (where less than half of adults were meeting the recommendation) and Richmond upon Thames (where more than two-thirds of adults were meeting the recommendation). Overall Newham had the lowest percentage of physically active adults in England in 2015 with only 44.8% of residents meeting the guideline and the highest was York with almost 70% of adults meeting it. A short “trip” along the District Line between Richmond upon Thames and Newham demonstrates a wide disparity in levels of physical activity amounting to 23%.
Figure 18 illustrates the relationship between physical activity and male HLE at birth; specifically, the higher the UTLA’s proportion of residents meeting the physical activity guideline, the more favourable its male HLE in general is. A similar pattern was also observed for females. However, there were notable outliers, such as Harrow and Manchester where around 55% of adults were meeting the guideline, but their male HLE at birth was sizeably contrasting (69.2 years in Harrow; 55.6 years in Manchester). The relationship overall though suggests that increasing a local population’s compliance with the guideline would likely improve its HLE.
Figure 18. Physical activity level as an indicator of male HLE at birth: England’s UTLA1
Source: Public Health England
Notes:
- Data is presented for 150 of the 152 Upper Tier Local Authorities in England. Isles of Scilly and City of London have been excluded in the Healthy Life Expectancy data due to small sample numbers.
- The number of respondents aged 16 and over, with valid responses to questions on physical activity, doing at least 150 “equivalent” minutes of at least moderate intensity physical activity per week in bouts of 10 minutes or more in the previous 28 days expressed as a percentage of the total number of respondents aged 16 and over. Data only available for persons.
- Please refer to note 2 in figure 3 for definitions of R2 and the regression equation. R2 = 0.37, a = 38.9 and b = 0.421.
Download this chart Figure 18. Physical activity level as an indicator of male HLE at birth: England’s UTLA^1^
Image .csv .xlsThe government also has a definition for physically inactive adults; specifically those doing less than 30 minutes of physical activity of moderate intensity per week. In 2015, York had the lowest proportion of physically inactive adults (17.5%) and Barking and Dagenham the highest (43.7%). Overall, nearly 3 in 10 people (28.7%) in England were physically inactive under this definition; but the lowest HLE areas had a higher proportion of physically inactive adults compared to the national average. The proportion of physically inactive adults is negatively associated with HLE, which means people living in areas with a high proportion of physically inactive adults spend a smaller proportion of their lives in good health. On average, over a third of adults (34.2%) in the lowest HLE areas were physically inactive compared to less than a quarter (23.1%) in the highest.
It should be noted that more deprived areas may have features which discourage physical activity, such as less access to green space and more unsafe public spaces. At the same time, it is likely that individuals with existing health conditions may be less able to take regular exercise whatever their location than healthier people.
5.5 Diet
The majority of adults in the lowest HLE areas were not meeting healthy eating guidelines
In 2015, nearly half of the England population (47.7%) were not meeting the daily recommendation guideline of consuming five portions of fruit and vegetables per day. On average, over half of people in the lowest HLE areas (53.7%) were not meeting this guideline compared to 41.6% in the highest despite a national health campaign. There was a 13.6 year lower male HLE at birth in Liverpool, the authority with the lowest percentage (36.5%) of adults meeting the guideline, than Rutland, the authority with the highest percentage (62.8). Harrow, one of the seven highest HLE areas had a lower proportion on this positive health indicator than County Durham among the lowest HLE areas. Figure 19 shows that in general though, the higher the proportion of an UTLA’s population that complied with the “five a day” guideline the higher was its male HLE at birth; a similar relationship was also present with female’s HLE too.
Figure 19. Percent of adults meeting the Government’s healthy eating guideline of ‘5 a day’ as an indicator of male HLE at birth: England’s UTLA1
Source: Public Health England
Notes:
- Data is presented for 150 of the 152 Upper Tier Local Authorities in England. Isles of Scilly and City of London have been excluded in the Healthy Life Expectancy data due to small sample numbers.
- Proportion of the population meeting the five a day guideline is based on Active People Survey 2015 data. HLE at birth is based on the period 2013 to 2015.
- Please refer to note 2 in figure 3 for definitions of R2 and the regression equation. R2 = 0.37, a = 42.7 and b = 0.39.
Download this chart Figure 19. Percent of adults meeting the Government’s healthy eating guideline of ‘5 a day’ as an indicator of male HLE at birth: England’s UTLA^1^
Image .csv .xlsDiet is a major contributing factor to chronic disease and premature death in England as a poor diet increases the risk of some cancers and cardiovascular disease, which are also associated with obesity (Department of Health 2010. Healthy Lives, Healthy People: Our Strategy for Public Health in England). Consuming fruit and vegetables is just one element of a healthy diet. The recently published (Public Health England 2016, Eatwell Guide) advises on how much food should be consumed from each good group in order to achieve a healthy, balance diet along with the recommended calorie amount for men and women (2,500kcal a day and 2,000kcal a day respectively).
It is worthwhile to consider the impact of other behaviours on an individual’s diet. Watching TV, one measure of sedentary behaviour, has found to be positively associated with a greater consumption of energy-sense snacks, soft drinks and fast food resulting in an increase in energy intake (Department of Health 2010). This highlights the importance of considering the interaction of lifestyle risk factors.
Policies to promote a healthy diet have been less successful in reaching disadvantaged areas, where there is a greater concentration of fast food outlets. (Public Health England, 2014). Such easy access to cheap, highly palatable and energy-dense food, which lacks nutritional value, could be deterring people from choosing to eat more healthily. At the same time, research has shown that people in disadvantaged areas have less easy access to healthy food such as fresh fruit and vegetables (Wrigley, N et al 2003).
5.6 Preventable mortality
Preventable deaths were two and a half times higher in Manchester than in Wokingham
In 2014, approximately 1 in 5 (19.4%) of all deaths were from causes considered preventable (90,985 out of 468,875 deaths) in England (ONS 2016).
Preventable mortality is defined as:
“A death is preventable if, in the light of understanding of the determinants of health at the time of death, all or most deaths from that cause (subject to age limits if appropriate) could be avoided by public health interventions in the broadest sense.” (Office for National Statistics, 2016)
Areas with the lowest HLE were more likely to have a higher age-standardised mortality rate from preventable causes compared with the highest (Figure 20). In 2013 to 2015, Wokingham had the lowest rate of preventable mortality (130.5 deaths per 100,000) whilst Manchester had the highest rate (320.5 per 100,000), almost two and a half times higher. All of the lowest HLE areas had a preventable mortality rate higher than the national average of 184.5 per 100,000 whilst all the highest HLE areas had a lower rate.
Figure 20: Age-standardised preventable mortality rate per 100,000 in the highest and lowest HLE areas and in England, 2013 to 2015
Source: Public Health England
Download this chart Figure 20: Age-standardised preventable mortality rate per 100,000 in the highest and lowest HLE areas and in England, 2013 to 2015
Image .csv .xlsThere is also a strong negative association between an UTLA’s male preventable mortality rate and its male HLE at birth (Figure 21), with few noticeable outliers.
Figure 21: Age-standardised male mortality rate from causes considered preventable as an indicator of male HLE at birth for England’s UTLAs1, 2013 to 2015
Source: Public Health England
Notes:
- Data is presented for 150 of the 152 Upper Tier Local Authorities in England. Isles of Scilly and City of London have been excluded in the Healthy Life Expectancy data due to small sample numbers.
- Value for Cornwall combines Isles of Scilly data for the measure mortality rate from causes considered preventable.
- Please refer to note 2 in figure 3 for definitions of R2 and the regression equation. R2 = 0.75, a = 78.47 and b = -0.064.
Download this chart Figure 21: Age-standardised male mortality rate from causes considered preventable as an indicator of male HLE at birth for England’s UTLAs1, 2013 to 2015
Image .csv .xlsThe rate of preventable mortality in males in the lowest HLE areas was 333.6 per 100,000 compared with an England average for males of 232.5 deaths per 100,000, and 173.5 per 100,000 in the highest HLE areas. In Manchester the male preventable mortality rate was 409.4 per 100,000, 2.7 times higher than in Rutland where it was 153.4 per 100,000. If the male mortality rate from causes considered preventable among the lowest HLE areas was to reduce to the England average, a substantial improvement in their HLE would be expected.
For females, Manchester also had the highest rate of mortality from causes considered preventable at 239.7 per 100,000, 2.4 times higher than in Bracknell Forest where it was 101.1 deaths per 100,000. Among the lowest HLE areas, the female rate of mortality from causes considered preventable was 205.9 per 100,000. A similar strong negative association between preventable mortality and HLE was also present for females.
Nôl i'r tabl cynnwys6. Conclusion
This report has shown that when looking at a cluster of local areas with particularly high and low healthy life expectancy (HLE), the local population profiles across a range of indicators were largely distinct. The lowest HLE areas had fewer people of working age economically active, a smaller proportion in employment, a higher proportion seeking work and a higher proportion economically inactive because of long-term sickness or disability. In addition more than 1 in every 10 people aged 16 to 64 in the lowest HLE areas were limited a lot in daily activities because of a physical or mental health condition lasting a year or more. Work is beneficial in maintaining physical and mental health, and has been shown to improve it for those with long-term health conditions and disabilities returning to work (Waddell, G. and Burton, A.K. 2006). Unemployment, conversely, is associated with deterioration in physical and mental health, a greater dependency on health services and a shorter life expectancy. In terms of state pension age increases and its corollary for people to extend their working lives, employment opportunities in the lowest HLE areas will be an important indicator to monitor to ensure such increases are fair.
An examination of how people live their lives across a small subset of lifestyle indicators is also revealing. In every case the lowest HLE areas had worse scores than England generally and, in most cases, substantially worse than the highest HLE areas. With the aim in mind of maintaining fitness to work to enable people to extend their working lives to the higher state pension ages envisaged, improving life chances and reducing unhealthy behaviours, where the impact of risk factors is known, will be necessary to achieve this aim.
However, the reduction in health inequalities including HLE is necessarily a long-term issue. There is substantial research showing that some health outcomes are influenced by a range of factors starting from early life (Barker, D. 1998), while there are cohorts of adults whose mortality experience and health in old age will be affected by occupational exposures and smoking patterns that are already in the past. At the same time, the interactions of individual and area determinants of HLE, and the relative share of long-term and short-term factors, are still not fully understood.
Local government as well as national government have a role in promoting active, healthy lifestyles to address some of the important public health and employment challenges facing their populations. By providing equal opportunities for people in local populations to work and lead healthy lives, both the physical and mental health of England as a whole will likely improve, and contribute to narrowing the gap between the highest and lowest HLE areas. In return, individuals and local health and social care services will benefit from a reduced burden of chronic disease and disability, as well as equipping people to live fuller longer working lives, benefiting local economies.
Nôl i'r tabl cynnwys7. References
Dahlgren, G. and Whitehead, M. (1993) Tackling inequalities in health: what can we learn from what has been tried? Model of Main Determinants of Health from Tackling inequalities in health: what can we learn from what has been tried? Working paper prepared for the King’s Fund International Seminar on Tackling Inequalities in Health, September 1993, Ditchley Park, Oxfordshire. London: King’s Fund. Accessible in: Dahlgren G, Whitehead M. (2007) European strategies for tackling social inequities in health: Levelling up Part 2. Copenhagen: WHO Regional Office for Europe
Fair Society Healthy Lives (The Marmot Review, 2010)
ONS (2017). Health State Life Expectancies by Index of Multiple Deprivation 2013 to 2015
Due North, University of Liverpool and Centre for Local Economic Strategies (2014)
ONS (2016). Health State Life Expectancies: UK 2013 to 2015
ONS (2015). How has life expectancy has changed over time?
White, C. and others (2005). Person, place or time? The effect of individual circumstances, area and changes over time on mortality in men, 1995–2001. HSQ 28; pp 18-26
Department for Work and Pensions (2016). Work, health and disability green paper: improving lives
ONS (2014). Unpaid Care Expectancies across NHS Clinical Commissioning Groups, England 2010-12
Morris, J.N. and others (1994). Loss of employment and mortality. BMJ; 308(6937): 1135–1139
Smoking and Mental Health: Mental Health Foundation
National Obesity Observatory (2009). Measures of Central Adiposity as an Indicator of Obesity
Global Recommendations on Physical Activity, WHO (2010)
Healthy Lives, Healthy People: A Call to Action on Obesity in England, Department of Health (2011)
The Government's Alcohol Strategy, HM Government (2012)
Adult drinking habits in Great Britain: 2014, ONS (2016)
ONS (2012). 2011 Census: Key Statistics for Local Authorities in England and Wales
Joseph Rowntree Foundation (2010). Ethnicity and Alcohol: A Review of the UK Literature
ONS (2016). Alcohol Related Death in the United Kingdom: Registered in 2014
Nuffield Trust and Health Foundation (2014). Focus On: Antidepressant prescribing
Department of Health (2011). Start Active, Stay Active
Public Health England (2016). Eatwell Guide
NHS Choices (2015). Why 5 a day?
World Health Organisation (2016) Healthy Diet
ONS (2016). Avoidable mortality in England and Wales
Barker D. (1998). Mothers, babies and health in later life. Edinburgh: Churchill Livingstone
Waddell, G. and Burton, A.K. (2006). Is work good for your health and well-being?
Nôl i'r tabl cynnwys