Cynnwys
- Main points
- Statistician’s comment
- Things you need to know about this release
- How age at death has changed in England and Wales over 30 years
- How age at death has changed in higher managerial and professional occupations and routine occupations over 30 years
- What is NS-SEC?
- What is the difference between the mean, modal and median age at death?
- How is it calculated?
- Quality and methodology information
1. Main points
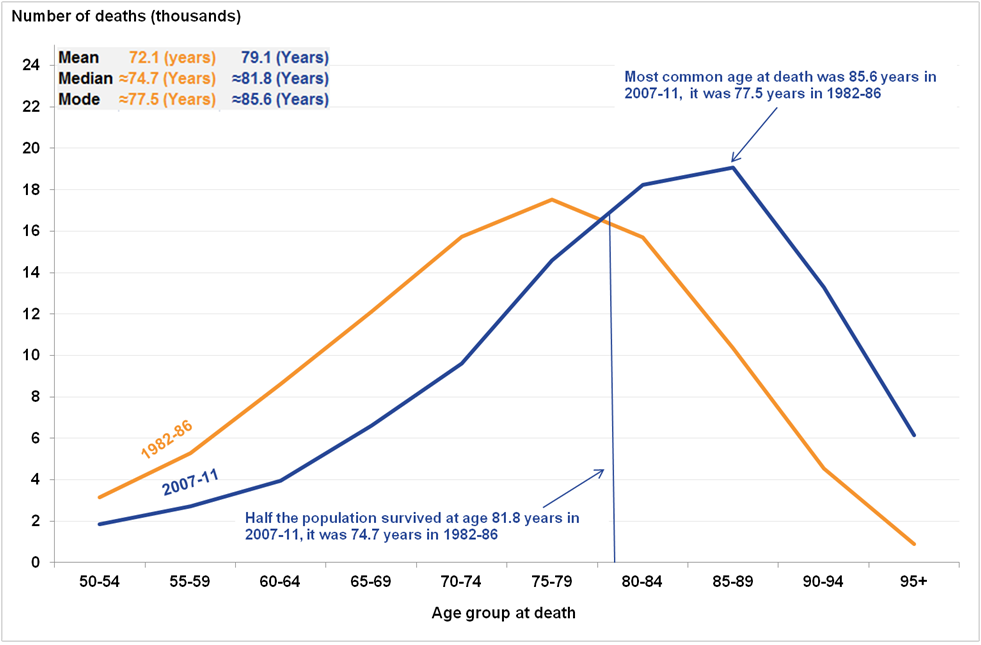
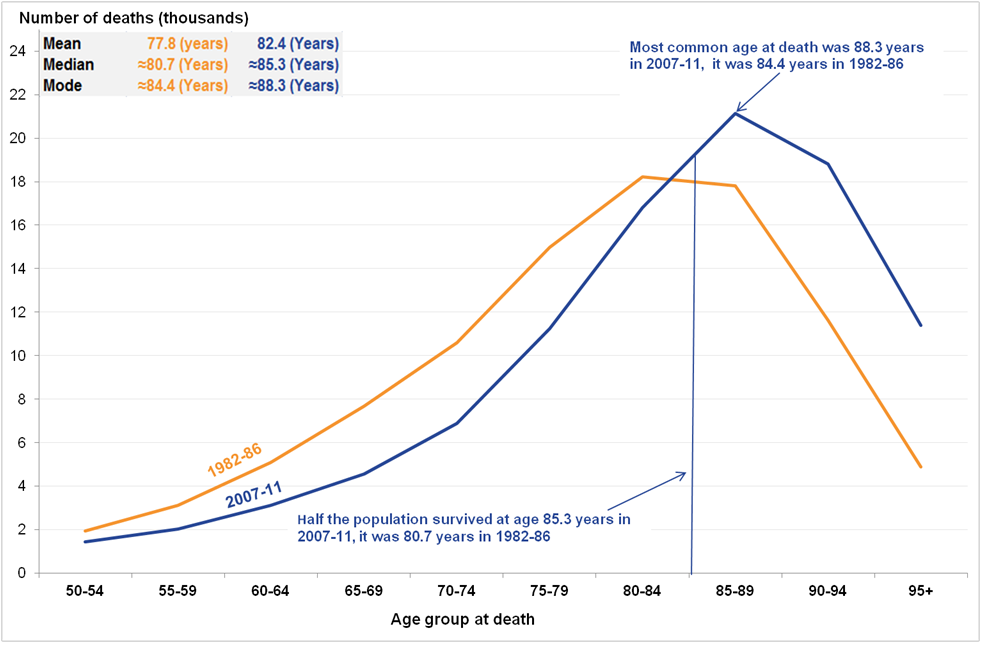
In England and Wales for the period 2007 to 2011, the most common age at death was 85.6 years for men and 88.3 years for women, an increase of 8.2 years and 3.8 years respectively since 1982 to 1986.
The age at which half of the population is expected to be still alive had reached 81.8 years for males and 85.3 years for females; it stood at 74.7 years and 80.7 years respectively in 1982 to 1986.
In 2007 to 2011, the most common age at death for the men and women classified to the higher managerial and professional occupations was 86.8 years and 89.4 years, which is 2.4 years and 2.7 years higher than the men and women classified to the routine occupations.
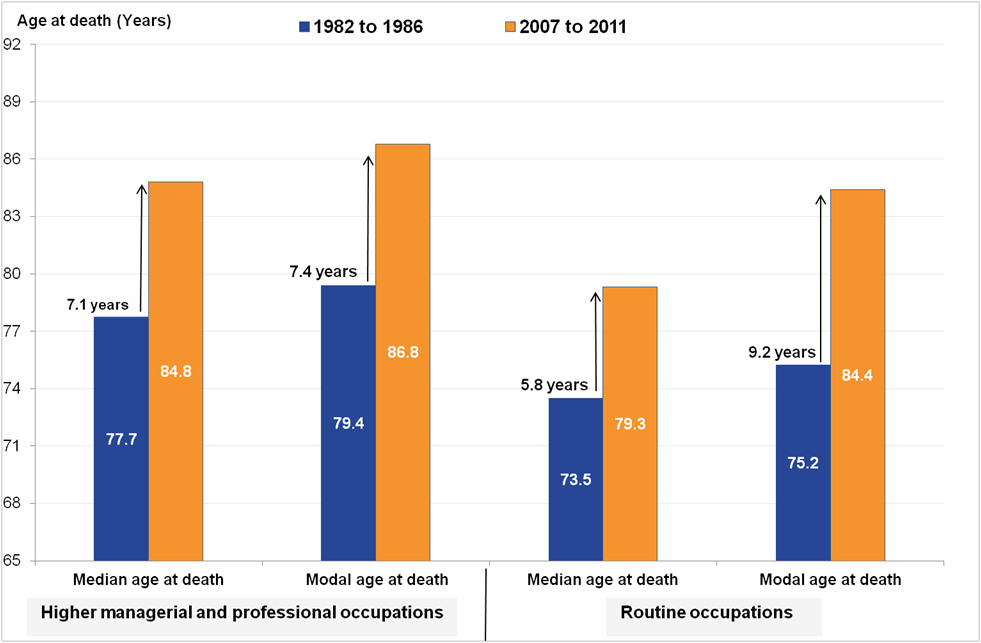
Since the early to mid 1980s, the change in the most common age at death for men was much larger in the routine occupations compared with the higher managerial and professional occupations, ranging from 9.2 years (75.2 to 84.4 years) in the former and 7.4 years (79.4 to 86.8 years) in the latter.
2. Statistician’s comment
"In England and Wales, deaths for men peaked at age 85 which is an increase of 8 years since the 1980s, while for women they peaked at age 88 and an increase of 4 years. These increases are important to consider for both pension provision now and in the long term and also for health and social care need."
Asim Butt, Health Analysis and Life Events, Office for National Statistics
Nôl i'r tabl cynnwys3. Things you need to know about this release
The analysis presented here is an extension of the project which reported the trend in life expectancy at birth and at age 65 by socio-economic position in England and Wales between 1982 to 1986 and 2007 to 2011. Therefore, this story focuses on modal age at death which is the most common age at death, and median age at death which is the age at which a half of a population have survived. However, we also provide detailed information about the data sources.
Age at death is measured using period life tables. Period life tables use the current age-specific mortality rates with no assumption about the projected death rates. Therefore, age at death reported here for the given time period is the expected age at death if a person experienced those age-specific mortality rates throughout his or her life.
Nôl i'r tabl cynnwys4. How age at death has changed in England and Wales over 30 years
If the current male population in England and Wales would follow the age-specific mortality rates that were observed in our Longitudinal Study (LS) for the period 2007 to 2011, then it is expected that half of the population could be expected to be still alive at the age of 81.8 and most would die at the age of 85.6.
This marked gain in age at death was observed following the mortality pattern in the LS, which is a 1% representative sample of England and Wales. However, it is interesting to know that complete population level mortality data for the period 2008 to 2010 had shown relatively similar estimates: median age at death is 81 years and most common age at death is 85 years.
Figures 1 and 2 show the expected number of deaths when applying the age- and sex-specific observed mortality patterns from the LS to a cohort of 100,000 separately for males and females. The distribution of deaths is clearly moving towards the right (older ages), which demonstrates deaths that were occurring at younger ages have been moved towards the older ages. This means people are living longer than before and, as a result, the age at which deaths peak has increased in England and Wales.
For example, in England and Wales, the mean age at death (traditional life expectancy at birth) was 72.1 years for males and 77.8 years for females in 1982 to 1986; it had risen to 79.1 years and 82.4 years respectively, by 2007 to 2011. Similarly, the modal age at death, which identifies the age at which deaths peaked over the life course, had reached 85.6 years for men and 88.3 years for women, increasing by 8.2 years and 3.8 years since 1982 to 1986, respectively.
These figures also illustrate that in England and Wales the median age at death, the age at which half of a hypothetical cohort would still be alive, was relatively shorter for males when compared with females. However, improvement over the past 30-year period was much larger for males: median age at death increasing from 74.7 years to 81.8 years for males, a gain of 7.2 years; for females, it increased from 80.7 years to 85.3 years, a gain of 4.6 years.
It is worth emphasising that the modal age at death is higher than the median, and the median age at death is higher than that of the mean age at death (the best known measure of life expectancy). This is because deaths are concentrating towards older ages and both the median and modal age at death takes more account of deaths at older ages whereas the mean age at death is making an allowance of deaths across all ages.
Figure 1: Males’ distribution of death in a typical cohort of 100,000, England and Wales, between 1982 to 1986 and 2007 to 2011
Source: Office for National Statistics Longitudinal Study
Notes:
Age at death for the younger age groups has been excluded in order to view more clearly the mortality pattern at the older ages.
A vertical line identifies the median age at death, plotted approximately within the age group.
Number of deaths is extracted from the life table column dx which gives the expected deaths occurring in the age group based on the probability of dying (qx) during the specific age group.
Download this image Figure 1: Males’ distribution of death in a typical cohort of 100,000, England and Wales, between 1982 to 1986 and 2007 to 2011
.png (115.9 kB) .xls (26.1 kB)
Figure 2: Females’ distribution of death in a typical cohort of 100,000, England and Wales, between 1982 to 1986 and 2007 to 2011
Source: Office for National Statistics Longitudinal Study
Notes:
Age at death for the younger age groups has been excluded in order to view more clearly the mortality pattern at the older ages.
A vertical line identifies the median age at death, plotted approximately within the age group.
Number of deaths is extracted from the life table column dx which gives the expected deaths occurring in the age group based on the probability of dying (qx) during the specific age group.
Download this image Figure 2: Females’ distribution of death in a typical cohort of 100,000, England and Wales, between 1982 to 1986 and 2007 to 2011
.png (112.6 kB) .xls (25.6 kB)5. How age at death has changed in higher managerial and professional occupations and routine occupations over 30 years
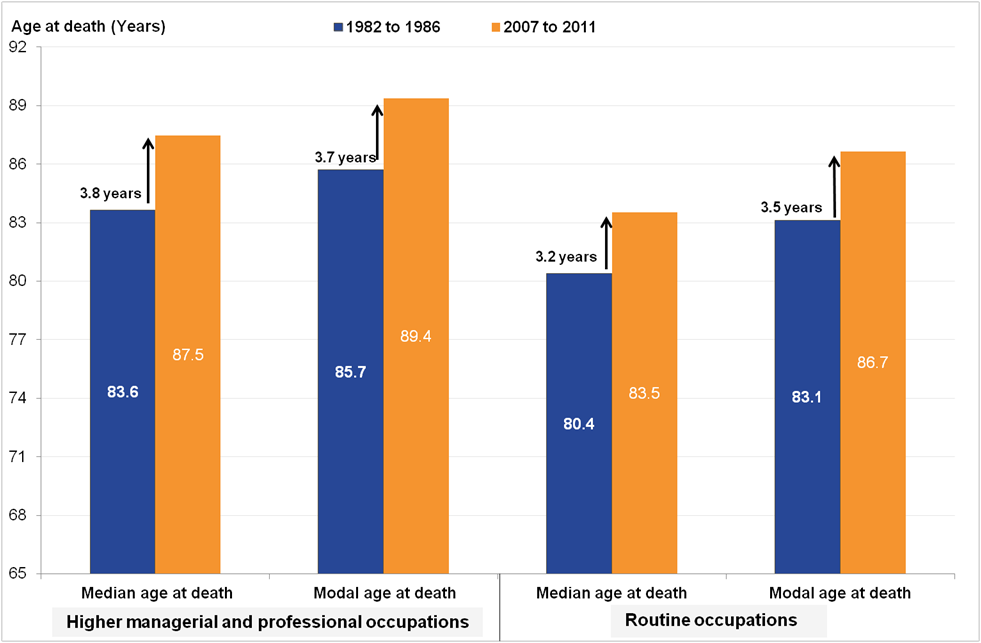
Figures 3 and 4 illustrate changes in the median and modal age at death for men and women classified to higher managerial and professional occupations (the most advantaged class) and to routine occupations (the least advantaged class) over the past 30 years in England and Wales using the National Statistics Socio-economic Classification (NS-SEC). Age at death changed markedly across each NS-SEC for men and women alike, but the improvements are most visible for men.
Men in the most advantaged occupations, known as higher managerial and professional, had a modal age at death of 86.8 years in 2007 to 2011, an increase of 7.4 years since 1982 to 1986; however, over the same time period the improvement in the modal age at death for routine occupations was higher (75.2 years to 84.4 years), amounting to 9.2 years. This suggests that age at death differs noticeably between both groups of occupations, but there is a stronger improvement in the routine occupations which includes men working with the least advantaged employment conditions, and encompasses occupations such as lorry drivers working as an employee for a firm and bar staff.
For males over the past 30 years, median age at death for the higher managerial and professional occupations improved by 7.1 years, from 77.7 years to 84.8 years. This is the largest improvement in median age at death for males across all socio-economic classes.
As seen in Figure 4, in 2007 to 2011 women in higher managerial and professional occupations achieved the age at death of 89.4 years (1.1 years higher than in England and Wales); for the routine occupations it was 86.7 years, a difference between these classes of 2.7 years. For the same period for women, the median age at death was 87.5 years for the higher managerial and professional occupations and 83.5 for routine occupations, a difference of 4 years.
By and large, women live longer than men. Therefore, their most common age at death is comparatively higher than for men. In 2007 to 2011, the routine occupations modal age at death for women was 2.3 years higher than the same occupations for men (86.7 years against 84.4 years); for the higher managerial and professional occupations, the gap was 2.6 years (89.4 years against 86.8 years). When these gender gaps were compared with the earlier period (1982 to 1986), gaps stood at 7.9 years (83.1 years against 75.2 years) for the routine occupations and 6.3 years (85.7 years against 79.4 years) for the higher managerial and professional occupations. This means the gender gap in the modal age at death has reduced over time; however, the size of the gender gap was highest for the routine occupations in 1986 to 1982, but lowest for these occupations in 2007 to 2011.
Figure 3: Median and modal age at death for men for selected socio-economic positions between 1982 to 1986 and 2007 to 2011, England and Wales
Source: Office for National Statistics Longitudinal Study
Notes:
- Figures may not sum due to rounding.
Download this image Figure 3: Median and modal age at death for men for selected socio-economic positions between 1982 to 1986 and 2007 to 2011, England and Wales
.png (63.6 kB) .xls (25.6 kB)
Figure 4: Median and modal age at death for women for selected socio-economic positions between 1982 to 1986 and 2007 to 2011, England and Wales
Source: Office for National Statistics Longitudinal Study
Notes:
- Figures may not sum due to rounding.
Download this image Figure 4: Median and modal age at death for women for selected socio-economic positions between 1982 to 1986 and 2007 to 2011, England and Wales
.png (62.5 kB) .xls (25.6 kB)6. What is NS-SEC?
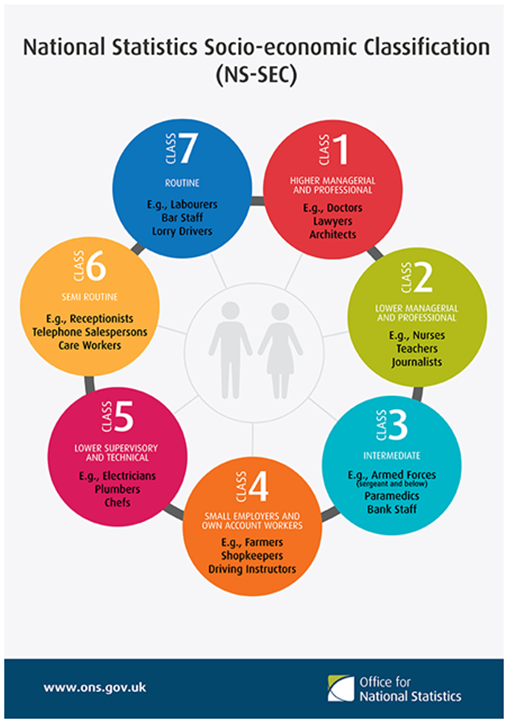
The National Statistics Socio-economic Classification (NS-SEC) was developed to measure employment relations and conditions of occupations. NS-SEC is central to show the structure of socio-economic positions in modern societies and to help explain variations in social behaviour and other social phenomenon. In our longitudinal study, the relationship between mortality and socio-economic positions has been under investigation since 1980.
Figure 5 demonstrates the classification of some occupations in the NS-SEC classes. We provide detailed information about NS-SEC’s history, methodological development over time and its usage in research.
Nôl i'r tabl cynnwys
7. What is the difference between the mean, modal and median age at death?
Average life spans are usually measured using the life table. A life table is a standard method of analysing mortality by age to summarise a population’s mortality experiences. These mortality experiences can be presented using 3 measures of average lifespan.
The mean
The most commonly used measure of average life span is life expectancy at birth or the mean age at death. It is the average number of years a person is expected to live before his or her death. We regularly produce period life expectancy which is widely understood and used as a robust measure of population health.
The mode
A second measure of life span is the late modal age at death. This measure, which has emerged as an alternative measure of life span in low infant mortality countries such as England and Wales, identifies the age at which the highest number of deaths occur over the life course. This focuses on deaths occurring at older ages in the life table in its calculation.
The median
The third measure is the median age at death. This estimates the age at which half of a cohort would have died and half would still be alive.
All 3 measures of life span are summary measures of aging in a population, helping to understand mortality improvements from mid to older ages over time. It feeds into the policies surrounding pension, housing and health and social care.
Please note that age at death figures are measured using period life tables. Period life tables use the age- specific mortality rates of a specific time period and apply them to a hypothetical cohort of newborn babies, usually 100,000. It makes no allowance for future or projected mortality as mortality rates are likely to change over time. This means age at death reported here at the given time period is the expected age at death if he or she would experience given age-specific mortality rates throughout his or her life.
Nôl i'r tabl cynnwys8. How is it calculated?
In this article, all estimates are calculated using abridged life tables. In the abridged life table, mortality and population data are usually grouped by 5-year age groups with the assumption that deaths are evenly distributed within the age groups. This means that the observed probability of dying in the age group 50 to 54 is the same for those who fall in that age group. In this analysis, this assumption is reasonable for life expectancy, but for the median and modal age at death it is necessary to use an approximation to identify the likely age of death.
The abridged life table has been used in 3 ways to investigate the changing distribution of death by NS-SEC in England and Wales over 30 years.
Mean age at death
Mean age at death (life expectancy at birth) is calculated using the standard Chiang II methods for the abridged life table, where the final age band was closed at age 95 and over to measure the survival at older ages. This excel file explains our standard approach to estimates of life expectancy at birth when the final age band was closed at age 85 and over.
Please note that life expectancy at birth estimates published here may differ from those published previously that used the same time period and NS-SEC classes because the final age band in that release closed the life table at age 90 and over. We published a research paper which assessed the impact of extending the abridged life table from closing it at age 85 and over to closing it at age 90 and over and showed it improved the accuracy of the life expectancy measure, and therefore moving it to age 95 and over improves it further.
The estimates of life expectancy at birth (mean age at death) by the National Statistics Socio-economic Classification (NS-SEC) using abridged life tables closed at age 95 and over are published alongside this release to illustrate how the mean varies from the median and the modal age at death. A formal revision of the existing time series using abridged life tables closed at age 95 and over will be published at a future date.
Median and modal age at death
In the abridged life table, median and modal age groups are identified using the dx column in the life table, which represents the expected number of deaths in each age group based on the probability of dying in the specific age interval in a hypothetical cohort of 100,000 persons. By using dx, the modal age group is where the highest number of deaths occurred out of this cohort of 100,000; the median age group is where cumulative deaths (that is, dxi + dx(i-1)) exceed 50,000. After identifying the median and modal age groups, basic group data formulas are applied to obtain approximate median and modal age at death.
Nôl i'r tabl cynnwys9. Quality and methodology information
This release is the extension of the project which reported the trend in life expectancy at birth and at age 65 by socio-economic position in England and Wales between 1982 to 1986 and 2007 to 2011. Therefore, Quality and Methodology information for Trend in life expectancy by National Statistics Socio-economic classification is provided to inform important information on:
output quality
about the output
how the output is created
validation and quality assurance
concepts and definitions
other information, relating to quality trade-offs and user needs
sources for further information or advice


