Cynnwys
- Main points
- Background
- Quality of care in the last 3 months of life
- Quality of care by place of death
- Quality of care by cause of death
- Quality of care by sex
- Quality of care by deprivation
- Quality of care by setting or service provider
- Dignity and respect in the last 3 months of life
- Coordination of care in the last 3 months of life
- Relief of pain in the last 3 months of life
- Overall level of care in the last 2 days of life
- Support for relatives, friends or carers at the end of life
- Decision making at the end of life
- Preferences and choice at the end of life
- Sample information
- Uses and users of end of life care statistics
- Consultation & future publications
- Further information
- Acknowledgements
- References
- Background notes
- Methodoleg
1. Main points
3 out of 4 bereaved people (75%) rate the overall quality of end of life care for their relative as outstanding, excellent or good; 1 out of 10 (10%) rated care as poor.
Overall quality of care for females was rated significantly higher than males with 44% of respondents rating the care as outstanding or excellent compared with 39% for males.
7 out of 10 people (69%) rated hospital care as outstanding, excellent or good which is significantly lower compared with care homes (82%), hospice care (79%) or care at home (79%).
Ratings of fair or poor quality of care are significantly higher for those living in the most deprived areas (29%) compared with the least deprived areas (22%).
1 out of 3 (33%) reported that the hospital services did not work well together with GP and other services outside the hospital.
3 out of 4 bereaved people (75%) agreed that the patient’s nutritional needs were met in the last 2 days of life, 1 out of 8 (13%) disagreed that the patient had support to eat or receive nutrition.
More than 3 out of 4 bereaved people (78%) agreed that the patient had support to drink or receive fluid in the last 2 days of life, almost 1 out of 8 (12%) disagreed that the patient had support to drink or receive fluid.
More than 5 out of 6 bereaved people (86%) understood the information provided by health care professionals, but 1 out of 6 (16%) said they did not have time to ask questions to health care professionals.
Almost 3 out of 4 (74%) respondents felt hospital was the right place for the patient to die, despite only 3% of all respondents stating patients wanted to die in hospital.
Nôl i'r tabl cynnwys2. Background
The National Survey of Bereaved People (VOICES, Views of Informal Carers – Evaluation of Services) collects information on bereaved people’s views on the quality of care provided to a friend or relative in the last 3 months of life, for England. The survey has now been run for 5 years and was commissioned by the Department of Health in 2011 and 2012, and NHS England from 2013. It is administered by the Office for National Statistics (ONS).
VOICES data provides information to inform policy requirements, including the End of Life Care Strategy, published by the Department of Health in July 2008. This set out a commitment to promote high quality care for all adults at the end of life and stated that outcomes of end of life care would be monitored through surveys of bereaved relatives (End of Life Care Strategy, Department of Health, 2008). Recently, the Liverpool Care Pathway, which provided a protocol for end of life care, has received criticism (Review of the Liverpool Care Pathway, Department of Health, 2013) and resulted in questions being added to the VOICES survey from 2014. These measure new areas of interest such as provision of food and fluid at the end of life and communication with next of kin (see the Further information section for full details of these changes). Policy changes have also led to a new national framework for local action on end of life care (National Palliative and End of Life Care Partnership, 2015).
This statistical bulletin reports on the national results from the 2015 VOICES survey. Data was collected over a 4 month field period from September to December 2015 from a sample of deaths registered between 1 January and 30 April 2015 (see the Sample information section). Very few significant changes between the 2014 and 2015 results were found and comparisons with the previous year are only made where differences are significant. Comparisons have generally not been made with earlier years due to the discontinuity in survey questions. Full 2015 results can be seen in the downloadable VOICES dataset linked from this bulletin.
VOICES results are based on the opinions of relatives who rate the quality of care provided to their friend or relative. While 21,320 people responded to the survey, not all of the survey questions are relevant to, or answered by all respondents, so some results are based on answers from fewer people than others. Where relevant the number of respondents for a question is provided to aid interpretation. Further guidance on interpreting the results in this bulletin is provided in Background notes 7 and 8.
Nôl i'r tabl cynnwys3. Quality of care in the last 3 months of life
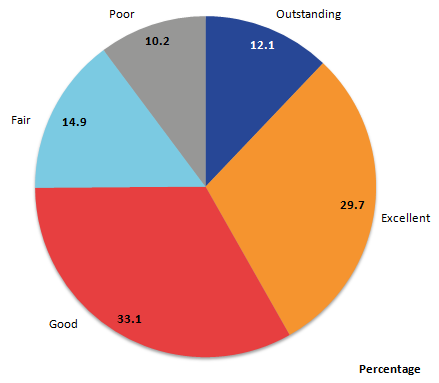
Ratings of the overall quality of care across all services in the last 3 months of life were reported by most respondents (95%, 20,173 responses). Services included care provided by hospitals, care homes, hospices and care while at home from GPs and care services such as Macmillan. Of all responders, 3 out of 4 (75%) rated care as outstanding, excellent or good, while 1 in 10 (10%) rated care as poor (see Figure 1).
Figure 1: Overall quality of care in the last 3 months of life, England, 2015
Source: Office for National Statistics
Notes:
20,173 respondents answered this question.
Percentages may not sum to 100 due to rounding.
Download this image Figure 1: Overall quality of care in the last 3 months of life, England, 2015
.png (16.4 kB) .xls (26.6 kB)4. Quality of care by place of death
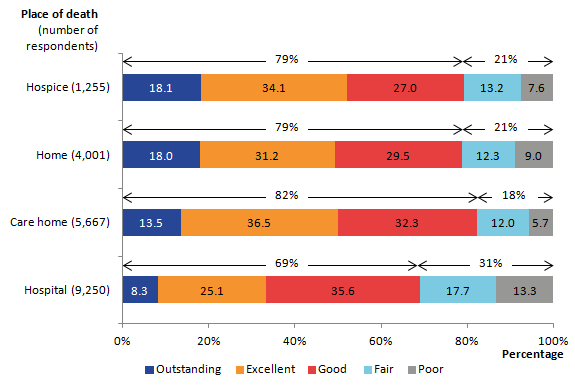
The relatives of people who died in hospital rated overall quality of care significantly worse than any other place of death. Approximately 3 out of 10 (31%) respondents rated care in hospitals as fair or poor, compared with the lowest rate of 18% for care homes. Conversely, respondents of approximately 8 out of 10 people who died in care homes (82%), hospices (79%) or their own home (79%) rated care as outstanding, excellent or good. Again, hospitals are significantly below this, with 7 out of 10 (69%) respondents rating care as outstanding, excellent or good (Figure 2).
Figure 2: Overall quality of care by place of death in the last 3 months of life, England, 2015
Source: Office for National Statistics
Notes:
- Percentages may not sum to 100 due to rounding.
Download this image Figure 2: Overall quality of care by place of death in the last 3 months of life, England, 2015
.png (14.0 kB) .xls (28.2 kB)5. Quality of care by cause of death
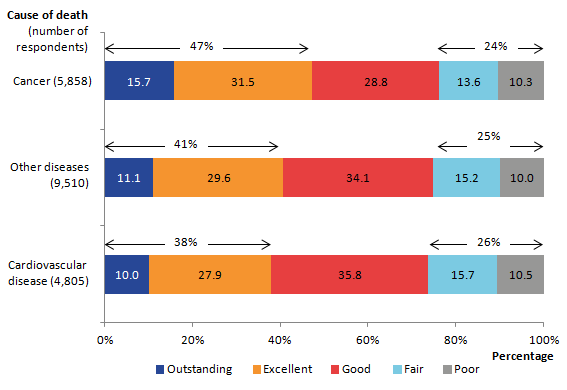
When looking at overall quality of care for different causes of death, outstanding, excellent and good ratings combined do not differ significantly for people rating the care of cancer patients (76%), cardiovascular patients (74%) or patients dying from other causes (75%). However, when examining the ratings for outstanding and excellent only, overall quality of care for cancer patients in the last 3 months of life is rated significantly higher than care for people dying from cardiovascular disease or other causes. Just under half (47%) of cancer patients had care rated as outstanding or excellent, compared with 38% of cardiovascular patients and 41% of people dying from other causes (see Figure 3).
Figure 3: Overall quality of care by cause of death in the last 3 months of life, England, 2015
Source: Office for National Statistics
Notes:
- Percentages may not sum to 100 due to rounding.
Download this image Figure 3: Overall quality of care by cause of death in the last 3 months of life, England, 2015
.png (13.0 kB) .xls (27.1 kB)6. Quality of care by sex
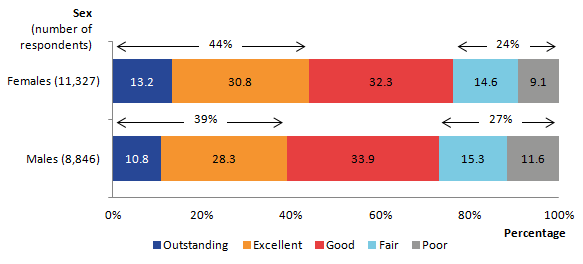
In 2015, respondents rated females as receiving significantly higher overall quality of care than their male counterparts, a difference that was not apparent in 2014. Significantly more respondents rated the quality of care for females as outstanding or excellent (44%), compared with outstanding or excellent ratings for males in 2015 (39%, see Figure 4). This compares with 42% and 43% for males and females respectively in 2014.
Care for male patients rated as fair or poor (27%), was also significantly worse than for females (24%). This difference of fair or poor quality of care between the 2 sexes was not seen in 2014.
Figure 4: Overall quality of care by sex in the last 3 months of life, England, 2015
Source: Office for National Statistics
Notes:
- Percentages may not sum to 100 due to rounding.
Download this image Figure 4: Overall quality of care by sex in the last 3 months of life, England, 2015
.png (9.1 kB) .xls (26.6 kB)7. Quality of care by deprivation
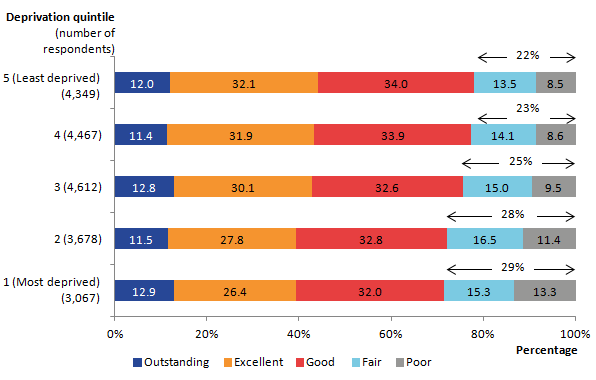
A notable pattern of overall quality of care exists when considering the level of deprivation of the deceased’s area of usual residence. While there is no difference in the proportion of people rated as receiving outstanding care by deprivation level, there is an association between greater deprivation and ratings of poor care (see Figure 5). Significantly more people with the most deprived status have care rated as fair or poor (29%) compared with the least deprived group (22%). This echoes the findings from the VOICES by area deprivation bulletin (ONS, 2013). Further details are available in the downloadable VOICES dataset “Overall quality” tab. Background note 6 provides details on the measure of deprivation.
Figure 5: Overall quality of care by deprivation quintile in the last 3 months of life, England, 2015
Source: Office for National Statistics
Notes:
Deprivation level is calculated based on the deceased's postcode of usual residence and based on IMD 2010.
Percentages may not sum to 100 due to rounding.
Download this image Figure 5: Overall quality of care by deprivation quintile in the last 3 months of life, England, 2015
.png (18.7 kB) .xls (26.6 kB)8. Quality of care by setting or service provider
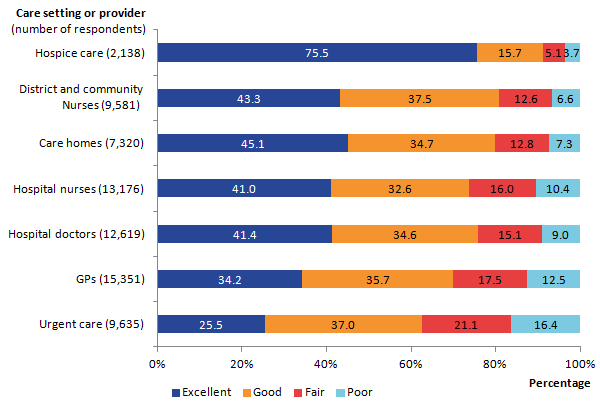
Respondents are asked to rate the quality of care within each setting that the patient was cared for in the last 3 months of life. Overall quality of care questions asked respondents to consider all aspects of care provided and rate them together, while in contrast, quality of care by setting or provider questions enabled respondents to rate specific care settings that the patient had experienced. These included rating care at home, in a hospital, in a care home or in a hospice and from specific care providers such as district nurses and health professionals who can respond to needs outside normal working hours (urgent care providers). Quality of care by setting is measured on a 4 point scale from excellent to poor.
Quality of care rated as excellent was highest where care was provided by hospices (76%) and lowest where care was provided by urgent care services (26%). The low ratings for urgent care services (which include out of hours services) draws parallels with findings from a recent end of life care audit which showed that only 11% of NHS trusts offered out of hours face to face access to palliative care services (End of Life Care Audit, Royal College of Physicians, 2016).
As seen in overall quality of care, approximately 1 in 10 people rated care provided by hospital doctors (9%) and hospital nurses (10%) as poor (see Figure 6).
Figure 6: Overall quality of care by setting or service provider, England, 2015
Source: Office for National Statistics
Notes:
- Respondents can answer quality of care questions for each setting where the patient received care.
- Percentages may not sum to 100 due to rounding.
Download this image Figure 6: Overall quality of care by setting or service provider, England, 2015
.png (15.0 kB) .xls (28.2 kB)The VOICES dataset contains further data on quality of care ratings within each health care setting. For many settings, quality of care is significantly higher for people who died of cancer compared with cardiovascular disease or other causes. For cancer patients, hospice care was rated 84% excellent, district and community nurses 49% excellent and GPs 40% excellent. An exception to cancer patients receiving the highest rated care by setting, was from hospital nurses, where quality of care was rated significantly higher for patients with cardiovascular disease (44%), than patients with cancer or other causes of death (both 40% rated excellent). See VOICES dataset “Quality of care (3mnth)” tab.
Nôl i'r tabl cynnwys9. Dignity and respect in the last 3 months of life
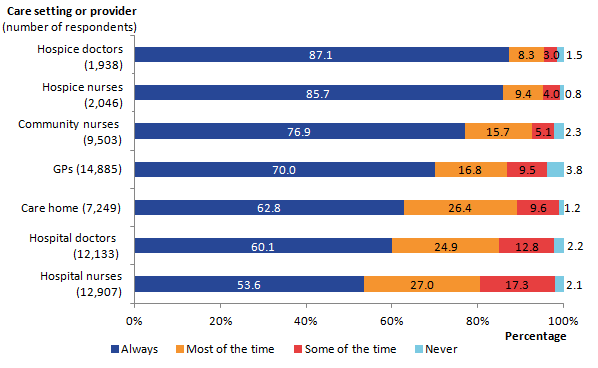
One aspect of care measured was how often staff in different settings treated the patient with dignity and respect. Staff in hospices were most likely to be rated as always showing dignity and respect to the patient in the last 3 months of life (87% for hospice doctors and 86% for hospice nurses) which was significantly higher than any other setting (see Figure 7).
Figure 7 presents information on how often the patient was treated with dignity and respect in the last 3 months by setting or service provider. Where settings are less likely to be rated as always treating patients with dignity and respect, such as care homes and hospitals, more people (approximately 1 in 4) rate that dignity and respect was given most of the time (care homes 26%, hospital doctors 25%, and hospital nurses 27%). GPs are significantly more likely to be rated as never treating patients with dignity and respect in comparison with all other settings (4%).
Figure 7: Dignity and respect by care setting or provider in the last 3 months of life, England, 2015
Source: Office for National Statistics
Notes:
- Percentages may not sum to 100 due to rounding.
Download this image Figure 7: Dignity and respect by care setting or provider in the last 3 months of life, England, 2015
.png (13.8 kB) .xls (36.9 kB)Hospital staff received the lowest ratings of always showing dignity and respect, this was 60% for hospital doctors and 54% for hospital nurses. Despite this, there has been a generally positive increase in the dignity and respect shown by hospital staff over the duration of the 5 annual VOICES surveys. Dignity and respect from hospital nurses has increased significantly from 48% in 2011 to 54% in 2015. Similarly, dignity and respect shown by hospital doctors has increased from 57% to 60% over the same period.
In the majority of care settings, cancer patients receive significantly higher ratings of always being treated with dignity and respect than patients dying from cardiovascular disease or other causes. This is true from district and community nurses (81% compared with the next highest of 75% for other causes of death), care homes (67% compared with the next highest of 63% for other causes of death), hospice doctors (92% compared with the next highest of 78% for cardiovascular patients) and hospice nurses (91% compared with the next highest of 77% for cardiovascular patients). A notable exception to cancer patients receiving greater dignity and respect is from hospital nurses, where 57% of cardiovascular disease patients were rated as always receiving dignity and respect in comparison with 53% for other causes of death and 52% for cancer patients.
Differences in dignity and respect shown to patients of different ages tend to be small and non- significant. Further details of responses related to dignity and respect reported by the different care settings and care providers in the last 3 months and the last 2 days of life are provided (see “Dignity and Respect (3 mnth)” and “Dignity and Respect (2day)” tab in the VOICES dataset). Recommendations in a recent End of Life Care Audit report emphasise the importance of NHS trusts to provide protocols ensuring provision of patient comfort, dignity and privacy up to, including and after the death of the patient (End of Life Care Audit, Royal College of Physicians, 2016).
Nôl i'r tabl cynnwys10. Coordination of care in the last 3 months of life
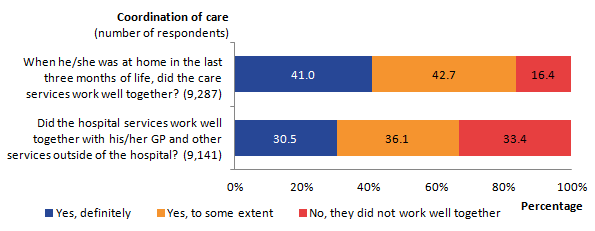
Two questions were asked about coordination of care. One question was asked in relation to those patients who had spent some or all of the last 3 months at home, about whether community services worked well together. Of the 44% (9,287) of people who responded to this question, 41% said that the services definitely worked well together (see Figure 8). This was significantly higher for people who died at home (55%) compared with those who died in a hospice (37%), hospital (33%) or care home (31%, see VOICES dataset ‘Coordination of care (3mnth)’ tab).
Figure 8: Coordination of care between care services in the last 3 months, England, 2015
Source: Office for National Statistics
Notes:
- Percentages may not sum to 100 due to rounding. Respondents can answer each of these questions applicable to settings where their relative received care.
Download this image Figure 8: Coordination of care between care services in the last 3 months, England, 2015
.png (14.5 kB) .xls (34.8 kB)Respondents were asked to answer the second coordination of care question if the patient had spent some time in hospital in the last 3 months of life. This asked if hospital services worked well with the GP and other community services outside the hospital. Here, 43% (9,141 people) responded to the question with 1 in 3 people (33%) reporting that services did not work well together. About 2 out of 3 (67%) said that the services definitely worked well together or worked well together to some extent. These questions align with Ambition 4 from Ambitions for Palliative and End of Life Care (2015). This highlights the importance of patients getting “the right help at the right time, from the right people” with the aim that more co-ordinated care can relieve distress at the end of life (National Palliative and End of Life Care Partnership, 2015). See “Coordination of care” tab in the VOICES dataset.
Nôl i'r tabl cynnwys11. Relief of pain in the last 3 months of life
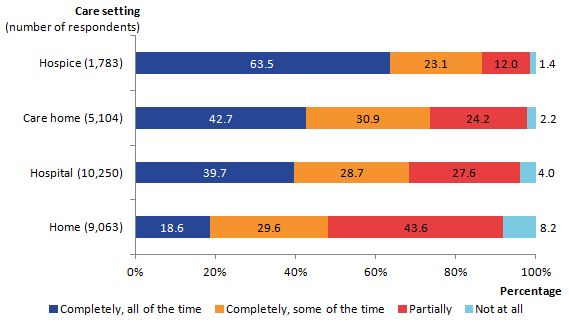
Figure 9 presents results on how well pain was relieved during the last 3 months of life, by care setting. Questions on relief of pain were relevant only for certain patients. Where it was relevant, relief of pain was reported by relatives as being provided “completely, all of the time” most frequently for patients in hospices (64%) and least frequently for those at home (19%). Almost 1 in 13 (8%) people cared for at home did not have their pain relieved at all (see the VOICES dataset). Pain relief does not vary significantly between cause of death and age of death at home, in a hospital or in a hospice.
Figure 9: Relief of pain by care setting in the last 3 months of life, England, 2015
Source: Office for national Statistics
Notes:
- Percentages may not sum to 100 due to rounding.
Download this image Figure 9: Relief of pain by care setting in the last 3 months of life, England, 2015
.png (12.0 kB) .xls (27.1 kB)More than half of cancer patients (55%) who received care at home were reported to have their pain relieved completely, all of the time, or completely, some of the time. This was significantly higher than people who died from cardiovascular disease (41%) or other causes (43%). Cardiovascular disease patients (59%) and patients dying from other causes (57%) were also significantly more likely to have their pain relief needs only partially met or not at all met, when compared with cancer patients (45%) also cared for at home. For further information, see “Relief of pain (3 mnth)” and “Relief of pain (2day)” tab in the VOICES dataset.
Nôl i'r tabl cynnwys12. Overall level of care in the last 2 days of life
In 2014, new questions were added to the VOICES questionnaire to understand the overall level of care given by health professionals in the last 2 days of life. These related to the respondent’s opinions on whether the patient was given adequate nutrition, fluid and pain relief in the last 2 days of life as well as how well the patient’s non-medical needs were met. These questions were added to provide an indicator of how well needs are met at the end of life following the withdrawal of the Liverpool Care Pathway. They also align to ambition 3 of Ambitions for Palliative and End of Life Care (National Palliative and End of Life Care Partnership, 2015), which aspires to remove all forms of distress during end of life care, including physical, emotional, psychological, social or spiritual distress.
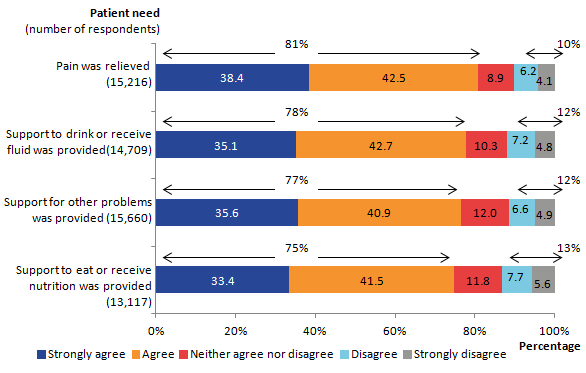
Figure 10 shows that in between 75% and 81% of cases, relatives agreed or strongly agreed that patients had adequate support to relieve thirst, hunger, pain and other problems. This indicates that in at least 3 out of 4 cases, people’s primary physical needs are met at the end of life. Despite this, 1 in 8 respondents (13%) disagreed or strongly disagreed that the patient’s need for food or nutrition was met. A similar proportion (12%) disagreed that there was adequate support for the patient to receive fluids and 12% disagreed that other problems were supported. One in 10 (10%) disagreed that pain relief was sufficient in the last 2 days of life.
Figure 10: Overall level of practical care provided by health professionals in the last 2 days of life, England, 2015
Source: Office for National Statistics
Notes:
- Percentages may not sum to 100 due to rounding.
Download this image Figure 10: Overall level of practical care provided by health professionals in the last 2 days of life, England, 2015
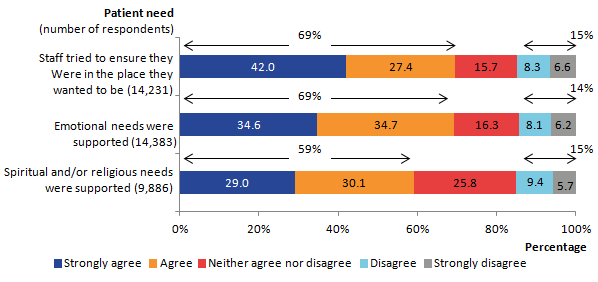
.png (16.4 kB) .xls (27.1 kB)Other new questions asked about the emotional and practical support provided in the last 2 days of life. Similar proportions of people agreed or strongly agreed that the patient’s emotional needs were considered and supported (69%) and that the patient was cared for in the place they wanted to be (69%). Despite this, 1 in 7 people disagreed that these needs were met, with 14% disagreeing or strongly disagreeing that the patient’s emotional needs were supported or that they were cared for in the place they wanted to be (15%, see Figure 11).
Significantly fewer people agreed that support and consideration for spiritual and/or religious needs was provided in comparison with other needs. Only 59% of people agreed or strongly agreed that support for religious and/or spiritual needs was provided, while 1 out of 7 (15%) respondents disagreed or strongly disagreed that support for religious and/or spiritual needs was given. A higher proportion of people responded with neither agree nor disagree than for any other question (26%) which may reflect that this is not an important factor for all patients, or that respondents do not expect this need to be supported by health care staff. The result that 34% of respondents to the survey ticked the additional “does not apply” option may further reflect this. Full results are available in the VOICES dataset, “overall care (2 day)” tab.
Figure 11: Overall level of emotional care provided by health professionals in the last 2 days of life, England, 2015
Source: Office for National Statistics
Notes:
- Percentages may not sum to 100 due to rounding.
Download this image Figure 11: Overall level of emotional care provided by health professionals in the last 2 days of life, England, 2015
.png (13.7 kB) .xls (27.1 kB)When comparing care settings for overall level of care in the last 2 days of life, hospitals are significantly less likely to be rated positively against these questions than other care settings. For example, significantly fewer respondents agreed or strongly agreed that patients who died in hospital received support to eat or receive nutrition (66%), compared with the next highest rating of 78% of patients who died at home. Similarly, only 70% of respondents whose relatives died in hospital agreed that the patient had received support to drink or take on fluids, compared with the next highest proportion of 81% of patients who died at home. Conversely, 1 in 6 (17%) respondents disagreed or strongly disagreed that support to drink or receive fluids was provided in hospital, significantly higher than for respondents whose relatives died at home (10%), or in a care home (6%).
Respondents agreed or strongly agreed that support for emotional needs was provided in hospital in only 60% of cases, compared with the next highest rating of 75% at home. Only half of respondents (51%) agreed that efforts were made to make sure the patient was in the place they most wanted to be where the patient died in hospital, compared with 73% of patients in a care home, 86% in a hospice and 95% at home. Full results for these questions, including more detailed analysis by cause of death, place of death and age at death are available in the VOICES dataset, “overall care (2 day)” tab.
Nôl i'r tabl cynnwys13. Support for relatives, friends or carers at the end of life
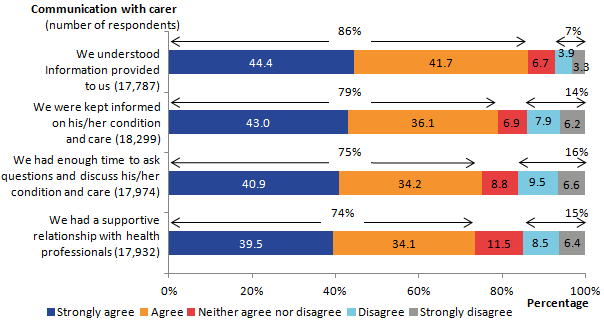
The survey asks questions about the quality of communication between relatives, friends or carers and health care professionals in the last 2 days of life. The majority (between 74% and 86%) of people responded agree or strongly agree to these questions:
“we understood the information given to us” (86%)
“we were kept informed of his/her condition and care” (79%)
“we had enough time with staff to ask questions and discuss his/her condition and care” (75%)
“we had a supportive relationship with the health care professionals” (74%, see Figure 12)
In contrast, between 7% and 16% disagreed or strongly disagreed with these statements.
Figure 12: Quality of communication with health care professionals in the last 2 days of life, England, 2015
Source: Office for National Statistics
Notes:
- Percentages may not sum to 100 due to rounding.
Download this image Figure 12: Quality of communication with health care professionals in the last 2 days of life, England, 2015
.png (17.5 kB) .xls (27.6 kB)The VOICES dataset, (“communication (2 day)” tab) presents these results broken down by further categories. When comparing quality of communication results by place of death, respondents whose friend or relative died in hospital were significantly less likely to agree or strongly agree that they were kept informed of the patient’s condition (73% compared with the next lowest of 81% at home), that staff had enough time to discuss the patient’s condition and care (68% compared with the next lowest of 78% at home), or that the health professionals had a supportive relationship with the carer (66% compared with the next lowest of 79% at home).
Significantly more relatives of people treated in hospital than other settings reported poor communication with health professionals. As many as 1 in 5 people disagreed or strongly disagreed that they were able to discuss the patient’s condition with staff (22%), that they had a supportive relationship with staff (20%) or that they were kept informed of the patient’s condition (19%). Significantly more people whose relative or friend died in hospital also did not understand the information provided to them (10%) in comparison with other settings.
Notably, respondents aged under 60 are significantly less likely to answer positively to these questions than those aged over 60. For instance, those aged under 60 agreed or strongly agreed that they had enough time to ask questions and discuss the patient’s condition, less than those aged over 60 (71% compared with 79% respectively).
Other questions on the survey asked about the support the respondent and family of the deceased received and whether they were dealt with sensitively. More than half of respondents to these questions (59%) said that they had definitely been given enough support at the time of the death. A further 27% said that they had to some extent.
When asked whether they had talked to anyone from any support services since the death, most respondents reported that they had not, and did not want to (66%). However, 21% said that they had not, but would have liked to. This was significantly higher for female respondents (23% versus 16% for males) and younger respondents (25% for under 60 years and 17% for those 60 years and over).
The survey also asked whether respondents were involved in decisions about the care provided to the patient as much as they wanted to be. Out of the 19,684 responses to this question, more than 3 out of 4 bereaved carers (76%) stated that they were involved in decisions as much as they wanted to be. However, when looking at place of death, this was significantly lower for hospitals, where 69% were involved in decisions about care as much as they wanted to be, compared with the next lowest, hospices (77%).
Ambition 1 from the “Ambitions for Palliative and End of Life Care” emphasises the importance of having “honest, informed and timely conversations” both with the individual and the people caring for them (National Palliative and End of Life Care Partnership, 2015). Further information is presented in the “Support for Carer (3 mth)” and “Support for Carer (2day)” tab in the VOICES dataset.
Nôl i'r tabl cynnwys14. Decision making at the end of life
Most people (97%, 20,614) responded to the question of whether decisions were made about care which the patient would not have wanted. Of these, 1 out of 5 (20%) respondents said that decisions were made about the patient’s care, which the patient would not have wanted. Approximately 3 out of 5 (60%) respondents said that no decisions were made that the patient would not have wanted.
Respondents reported that they believed the majority of patients (87%) were involved in decisions about their care as much as they wanted (61% of the sample (12,917 people) responded to this question). The NHS constitution emphasises the importance of “the right to be involved in discussions and decisions about your health and care, including your End of Life Care, and to be given information to enable you to do so” (The NHS constitution, Department of Health, 2015). Further details about decision making around care are reported in the “Patients’ needs and preferences (3 mth)” tab in the VOICES dataset with results presented by cause of death, place of death and age at death.
Nôl i'r tabl cynnwys15. Preferences and choice at the end of life
End of life care policies are giving increasing emphasis to providing good quality care which meets the wishes of the individual (The Choice in End of Life Care Programme Board, 2015). Particular emphasis has been given to ensuring that a person is able to die in their place of choice. The VOICES survey asks respondents if the patient had expressed a preference for where they would like to die and asked to state where this was (for instance, at home, in a hospice etc.). Out of the 7,561 responses to this question, the majority believed the deceased had wanted to die at home (81%), 8% said they wanted to die in a hospice, 7% in a care home, 3% in hospital and 1% somewhere else (see the VOICES dataset, priorities (3mnth) tab).
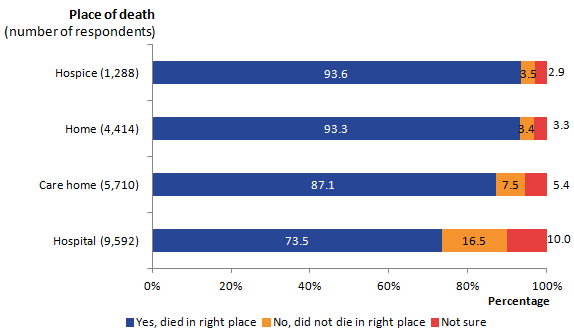
Respondents were asked if the patient had died in the right place and 99% (21,004) of people who responded to the survey, answered this question. Figure 13 presents whether bereaved people on balance, felt the deceased had died in the right place. Results show that in hospices and at home more than 9 out of 10 people (94% for hospice and 93% for home) were believed to have died in the right place for them. Almost three-quarters (74%) of respondents whose relative died in hospital believed that their relative died in the right place, despite only 3% of all respondents stating that patients wanted to die in hospital. Hospitals also have the highest proportion of respondents who felt the deceased did not die in the right place (17%) or were not sure if they died in the right place (10%, see Figure 13).
Figure 13: Did the patient die in the right place, by place of death, England, 2015
Source: Office for National Statistics
Notes:
- Percentages may not sum to 100 due to rounding.
Download this image Figure 13: Did the patient die in the right place, by place of death, England, 2015
.png (9.2 kB) .xls (26.6 kB)16. Sample information
The sample for the 2015 VOICES survey was selected from the adult deaths registered between 1 January 2015 and 30 April 2015, which were extracted from our death registration database. Records were removed where cause of death and place of death were outside the criteria (see below), where the informant’s name and address was missing and where the informant was designated an official (See Background note 4).
From the 155,257 deaths that were eligible for the survey, a stratified sample of 49,558 was drawn for the actual survey. Further information on the methods used in data collection for this survey is provided in the Quality and Methodology Information report.
Informants were contacted between 4 and 11 months following registration of the death, the recommended time for such surveys to balance the need for privacy and sensitivity during early bereavement while ensuring reliable recall about care provision (Hunt et al, 2011). The mailing period was also timed to exclude Christmas and the anniversary of the death. The VOICES-SF questionnaire was used: the Views of Informal Carers – Evaluation of Services (VOICES) short-form (see Background note 3).
Sex of deceased
This was determined from information recorded on the death certificate:
- male (46% of the selected sample)
- female (54% of the selected sample)
Place of death
Deaths were excluded where the place of death was recorded as “Elsewhere”, which includes external sites (such as roads or parks), public venues (such as shops or restaurants), work places and any other place which could not be identified to a specified location type. Location types that were included were grouped in the following way:
- home: the home of the deceased as reported on the death certificate (22% of the selected sample)
- hospital: NHS and private (49% of the selected sample)
- care homes (including residential homes) (24% of the selected sample)
- hospices (6% of the selected sample)
In some cases, it may be appropriate to group residential homes with home, since these all describe the usual residence of the person. However, for the purposes of the 2015 VOICES survey, residential homes were grouped with care homes because the survey addresses the quality of care provided by staff.
Cause of death
All details relevant to the cause of death on the death certificate are coded using the International Statistical Classification of Diseases and Related Health Problems – Tenth Revision, or ICD–10 (WHO, 1992).
Deaths were excluded from the sampling frame where the underlying cause of death was accident, suicide or homicide (ICD–10 codes V01 to Y98 and U50.9). The following deaths were included where they were recorded as the underlying cause:
- cardiovascular disease (CVD): ICD–10 codes I00 to I99 (27% of the selected sample)
- cancer ICD–10 codes C00 to D48.9 (this includes benign neoplasms) (27% of the selected sample)
- other: ICD–10 codes A00 to R99 (excluding CVD and cancer) (46% of the selected sample)
It is interesting to note that 2015 saw a change in the distribution of causes of death in the sample. The distribution of deaths where the underlying cause was CVD in the sample, decreased from 30% in 2014 to 27% in 2015. This was also true for cancer as the underlying cause where the sample distribution decreased from 29% in 2014 to 27% of the sample in 2015. The proportion of deaths from other causes increased from 41% of the sample in 2014 to 46% in 2015. This change in the sample distribution reflects increases in the number of deaths from dementia, which has undergone a coding change on death certificates and increased awareness leading to increases in the records. Excess winter deaths from respiratory disease were also higher in 2015 than recent years (ONS, 2015a).
Age at death
Deaths of people aged under 18 years were excluded, leaving an age range of 18 to 110 years for the sample. Ages were split into 3 groups:
- under 65 years (12% of the selected sample)
- 65 to 79 years (28% of the selected sample)
- 80 years or older (60% of the selected sample)
This older age group becomes of greater importance as the number of older adults increases (ONS, 2015b), mortality rates fall (ONS, 2015c) and people live longer (ONS, 2014a).
Geographical spread
To ensure a geographical spread, death records were assigned to an NHS Area Team based on the postcode of usual residence of the deceased. In 2014, Area Teams were split into 25 areas of England, in 2015, these areas were amalgamated into 13 groups, which were used as the basis for this sample.
Response rates
Of the sample of 49,558 deaths, 21,320 completed responses were received from informants, giving a response rate of 43%. The overall response rate is comparable to 2014 (also 43%, ONS 2015d) but has reduced by 3% in comparison with the 2013 survey (ONS, 2014b). This is likely to be due to changes to the questionnaire, such as making the method to refuse to participate more explicit and a declining trend in survey response rates more widely.
The VOICES dataset “Response rates” tab presents the response rates by characteristics of the deceased. Our mortality database contains the name and address of informants of the death and, in most cases, the relationship of the informant to the deceased. No further information about the informant was available so it was not possible to estimate response rates based on respondent details. Although the questionnaire is sent to the informant on the death certificate, they are encouraged to pass on the questionnaire to another family member if deemed more appropriate. In the questionnaire, respondents were asked their age, sex, ethnic group and relationship to the deceased. Where answers were provided, 61% of the sample were female, 58% aged over 60 and 97% were white.
Nôl i'r tabl cynnwys17. Uses and users of end of life care statistics
The National Survey of Bereaved People (VOICES) has a range of uses and users. The Department of Health commissioned this survey to follow up on a commitment made in the End of Life Care Strategy (Department of Health, 2008). The results of this survey will be used to inform policy decisions and to enable evaluation of the quality of end of life care in different settings, across different ages and different causes of death.
The Liverpool Care Pathway has provided a protocol for end of life care which has received criticism (Review of the Liverpool Care Pathway, Department of Health, 2013). Following this review, the Leadership Alliance for the Care of Dying People has been established to provide improvements in end of life care (Department of Health, 2014) and resulted in new policies such as Ambitions for Palliative and End of Life Care (National Palliative and End of Life Care Partnership, 2015). VOICES statistics provide data which will enable the impact of end of life care policies to be monitored during this transitional period.
VOICES data is also used to support third sector activity, such as supporting lobbying campaigns to improve care at home, allocating charity resources and evaluating and comparing service provision across settings. VOICES results also have value in academic research and have been used in numerous studies, for example, identifying factors influencing quality of care and the impact of pain management on experience of care.
There is also wide public interest in VOICES results, which helps to inform differences in quality of care between settings, health conditions and stage of life and can inform lifestyle choices on preferences for care and place of death. Survey respondents in particular have an interest in the results. The full range of uses for official statistics can be seen in The Use Made of Official Statistics (2010).
We welcome your feedback on the content, format and relevance of this release. You can post or email feedback to the address in the Background notes section.
Nôl i'r tabl cynnwys18. Consultation & future publications
To ensure the survey remains fit for purpose, NHS England ran a public consultation between 27 March and 23 June 2015. The consultation was open to anyone with an interest in feedback on the quality of end of life care.
A report summarising the feedback from the consultation is available on the NHS England website.
In light of the consultation findings, NHS England has commissioned an options appraisal. This will explore how capturing feedback on End of Life care can be improved by seeking to act upon the consultation responses.
If you would like any further information please contact: englandvoices@nhs.net
Nôl i'r tabl cynnwys