Cynnwys
- Main points
- Total healthcare expenditure in the UK
- Total healthcare expenditure per person
- Total healthcare expenditure in the UK as a percentage of GDP
- Growth in public and private sector healthcare expenditure
- Share of total healthcare expenditure from public and private sector
- Household final consumption expenditure
- Current and capital healthcare expenditure
- Revisions
- The system of health accounts
- References
- Background notes
1. Main points
Total healthcare expenditure in the UK, from both public and private sectors, was £150.6 billion in 2013, having increased by 2.7% between 2012 and 2013
Total spending per person on healthcare was £2,350 in 2013, more than two and a half times the level in 1997, when £941 was spent for each UK resident
Total healthcare expenditure in the UK accounted for 8.8% of gross domestic product (GDP) in 2013. Total healthcare expenditure as a percentage of GDP rose sharply between 2008 and 2009, as GDP fell, but has decreased since 2009
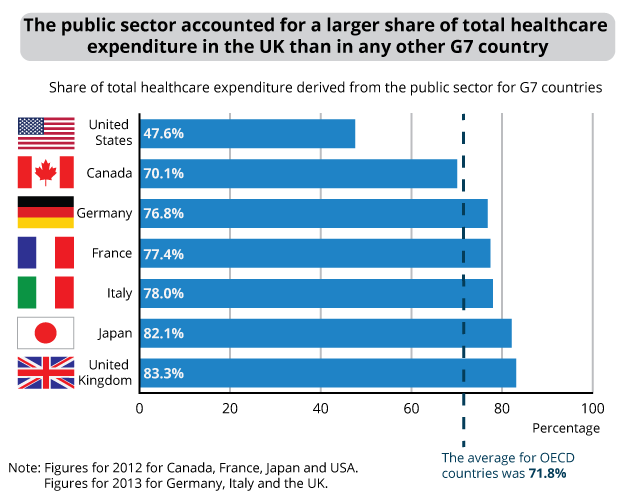
Public sector spending on healthcare totalled £125.5 billion in 2013 and accounted for 83.3% of total healthcare expenditure in the UK, with the remaining £25.1 billion being private sector spending
Public sector healthcare expenditure grew by 3.2% between 2012 and 2013, while private sector expenditure grew by 0.3%
Over two-thirds of private healthcare expenditure was household consumption in 2013, with the largest categories of household healthcare consumption being pharmaceutical products, therapeutic appliances and equipment, and hospital services
In 2013, current healthcare expenditure was £144.9 billion, which equated to 96.2% of total healthcare expenditure. The remaining £5.8 billion was capital expenditure
2. Total healthcare expenditure in the UK
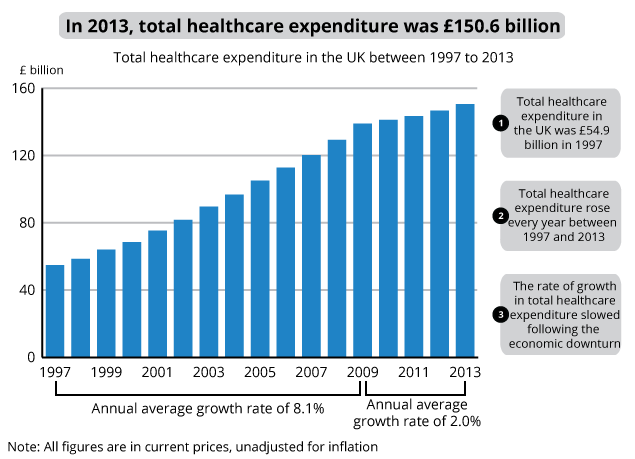
Figure 1 shows total healthcare expenditure in the UK, from public and private sectors, between 1997 and 2013. As with all figures in this report, Figure 1 displays spending in current prices – the price of goods or services at the time they were purchased, unadjusted for inflation. In 2013, total healthcare expenditure was £150.6 billion, the highest level recorded in the series, having been £54.9 billion in 1997.
Figure 1: Total healthcare expenditure in the UK, 1997 to 2013

Source: Office for National Statistics
Download this image Figure 1: Total healthcare expenditure in the UK, 1997 to 2013
.png (32.9 kB) .xls (32.3 kB)Total healthcare expenditure increased every year between 1997 and 2013. The average annual rate of growth1 in total healthcare expenditure for the period 1997 to 2009 was 8.1%, compared with 2.0% between 2009 and 2013. Between 2012 and 2013, total healthcare expenditure increased by 2.7%.
Notes for total healthcare expenditure in the UK
- All average percentage changes reported in this bulletin are calculated as compound means.
3. Total healthcare expenditure per person
In 2013, total healthcare expenditure per person was £2,350, which was 2.1% higher than in 2012. Healthcare expenditure per person in 2013 was two and a half times higher than in 1997, when total healthcare expenditure was £941 per person.
Figure 2: Total healthcare expenditure per person, 1997 to 2013
Source: Office for National Statistics
Notes:
- Total healthcare expenditure per person was £941 in 1997
- Between 1997 and 2009, total healthcare expenditure per person grew by an average of 7.5% per year
- Since 2009, healthcare spending per person has increased by an average of 1.3% per year
- By 2013, total healthcare spending had increased to £2,350 per person
- Growth rates used are compound growth rates
Download this chart Figure 2: Total healthcare expenditure per person, 1997 to 2013
Image .csv .xlsBetween 1997 and 2009, total healthcare expenditure per person more than doubled, increasing by 7.5% on average each year. By comparison, between 2009 and 2013, the growth in total healthcare expenditure per person slowed considerably, increasing on average by only 1.3% each year in this period. The primary cause of the slowdown in the growth of healthcare spending per person was the slowdown in growth of total healthcare expenditure, with changes in population growth having only a small effect on the growth rate of healthcare spending per person.
Nôl i'r tabl cynnwys4. Total healthcare expenditure in the UK as a percentage of GDP
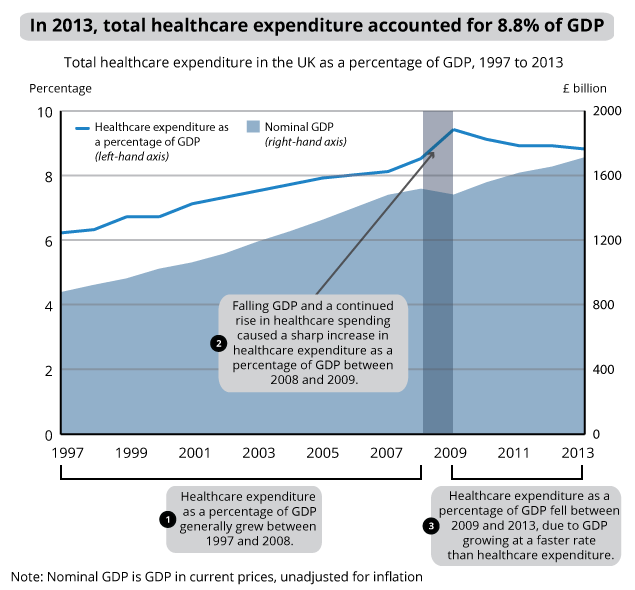
Figure 3 shows nominal GDP1 and total healthcare expenditure as a percentage of gross domestic product (GDP). In 2013, total healthcare expenditure accounted for 8.8% of GDP, the lowest percentage since 2008. In 1997, total healthcare expenditure in the UK accounted for 6.2% of GDP.
Figure 3: Total healthcare expenditure as a percentage of GDP, 1997 to 2013

Source: Office for National Statistics
Download this image Figure 3: Total healthcare expenditure as a percentage of GDP, 1997 to 2013
.png (46.6 kB) .xls (34.3 kB)Between 1997 and 2008, both GDP and total healthcare expenditure grew each year with total healthcare expenditure growing faster than GDP. This caused an increase in the share of GDP attributed to healthcare expenditure. Between 2008 and 2009, GDP fell, while healthcare expenditure continued to grow at a similar rate to the preceding years. This resulted in a sharp increase in healthcare expenditure as a percentage of GDP, from 8.5% to 9.4%. Since 2009, growth in healthcare expenditure has been slower than growth in GDP, resulting in healthcare spending as a percentage of GDP falling back to 8.8%.
Notes for total healthcare expenditure in the UK as a percentage of GDP
- GDP in current prices, unadjusted for inflation.
5. Growth in public and private sector healthcare expenditure
Figure 4 shows public and private sector healthcare expenditure. Public sector expenditure includes spending by the NHS and other government spending, such as healthcare in prisons and the armed forces. Private sector spending is made up of a number of components including private households, private medical insurance and spending by non-profit institutions such as charities.
In 2013, public sector healthcare expenditure was £125.5 billion, 3.2% higher than in 2012, while private sector healthcare expenditure was £25.1 billion, having grown 0.3% from 2012. Public sector healthcare expenditure has almost trebled since the start of the series, from £44.1 billion in 1997 to £125.5 billion in 2013. Private sector expenditure has more than doubled during the same period, increasing from £10.8 billion in 1997 to £25.1 billion in 2013.
Figure 4: Public and private sector healthcare expenditure in the UK, 1997 to 2013
Source: Office for National Statistics
Notes:
- Public sector healthcare expenditure increased from £44.1 billion in 1997 to £125.5 billion in 2013
- Private sector healthcare expenditure increased from £10.8 billion in 1997 to £25.1 billion in 2013
- Following the economic downturn in 2008, private sector healthcare spending fell in 2009 and 2010, but public sector spending continued to increase
- In 2013, public sector healthcare expenditure was £125.5 billion, while private sector healthcare spending was £25.1 billion
Download this chart Figure 4: Public and private sector healthcare expenditure in the UK, 1997 to 2013
Image .csv .xlsFigure 5 shows the annual growth rates of public, private and total healthcare expenditure between 1997 and 2013. From 1997 to 2009, the annual rate of growth in public sector healthcare expenditure ranged from 5.3% to 10.3%, averaging 8.4%. Between 2009 and 2013, the growth rate of public sector healthcare expenditure was considerably lower, averaging 2.1% per year over the period.
The growth rates of total healthcare expenditure were similar to the growth rates in public sector healthcare expenditure, as a result of the high proportion of healthcare expenditure that comes from the public sector.
Figure 5: Annual percentage increase in total, public and private sector healthcare expenditure in the UK, 1997 to 2013
Source: Office for National Statistics
Notes:
- Chart shows growth between years
- Between 2012 and 2013, public sector healthcare expenditure grew by 3.2%, while private sector expenditure grew by 0.3%
Download this chart Figure 5: Annual percentage increase in total, public and private sector healthcare expenditure in the UK, 1997 to 2013
Image .csv .xlsGrowth in private sector healthcare expenditure averaged 7.5% between 1997 and 2008. However, private sector healthcare expenditure fell between 2008 and 2010, following the economic downturn, and between 2010 and 2013 grew at a slower average rate of 2.6% per year.
Nôl i'r tabl cynnwys7. Household final consumption expenditure
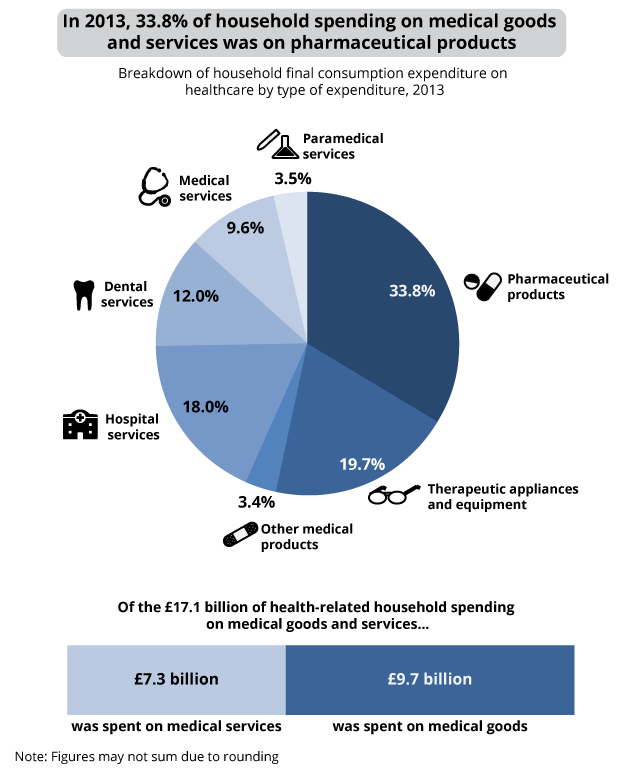
In 2013, 67.8% of private sector healthcare expenditure was from household final consumption expenditure, which includes both direct purchases of medical goods and services by households, and consumption of treatment funded through private medical insurance schemes.
Figure 8 shows the breakdown of household spending by the sub-categories of medical goods and services defined in the United Nations Classification of Individual Consumption by Purpose (COICOP) system.
Figure 8: Household final consumption expenditure on medical goods and services, 2013

Source: Office for National Statistics
Download this image Figure 8: Household final consumption expenditure on medical goods and services, 2013
.png (51.2 kB) .xls (28.2 kB)Pharmaceutical products accounted for the largest share of household healthcare expenditure, with over one-third of health-related household final consumption expenditure going on products in this category, such as medicinal preparations, drugs, medicines and vitamins. Therapeutic appliances and equipment, such as spectacles, hearing aids, prosthetics and wheelchairs, made up the next highest share, accounting for 19.7% of household consumption expenditure on healthcare.
Hospital services, which include all in-patient hospital services such as medical care, meals and accommodation charges, accounted for 18.0% of household final consumption spending on healthcare, the third highest share. Other private medical services included dental services, which accounted for 12.0% of health-related household spending, out-patient medical services such as consultations with doctors or specialists, accounted for 9.6% and paramedical services, which include the services of private nurses, midwives, acupuncturists and other similar professionals, accounted for 3.5%.
Nôl i'r tabl cynnwys8. Current and capital healthcare expenditure
Total healthcare expenditure can be split into current and capital spending. Capital expenditure is spending on items which are anticipated to be in use over several years and add to the stock of resources in the healthcare system, such as hospital buildings and ambulances. Current expenditure is spending on goods and services which are not considered part of capital spending, such as labour costs and utility services.
Since 1997, current expenditure has consistently made up the majority of total healthcare expenditure. In 2013, it accounted for 96.2% of total healthcare expenditure, compared with 93.0% in 1997. Current healthcare expenditure was £144.9 billion in 2013 and has increased each year since 1997. However, growth in current healthcare expenditure slowed from an average annual rate of 8.1% between 1997 and 2009 to a rate of 2.8% between 2009 and 2013.
Figure 9: Current and capital healthcare expenditure in the UK, 1997 to 2013
Source: Office for National Statistics
Notes:
- In 2013, current healthcare expenditure was £144.9 billion, while capital expenditure was £5.8 billion
- Current expenditure:
increased from £51.0 billion in 1997 to £144.9 billion in 2013
increased in every year between 1997 to 2013 - Capital expenditure:
rose from £3.8 billion in 1997 to £5.8 billion in 2013
peaked at £9.3 billion in 2008 but fell in each subsequent year
Download this chart Figure 9: Current and capital healthcare expenditure in the UK, 1997 to 2013
Image .csv .xlsIn 2013, £5.8 billion was spent on capital healthcare expenditure, accounting for the remaining 3.8% of total healthcare expenditure. Capital expenditure increased from £3.8 billion in 1997 to a peak of £9.3 billion in 2008, but fell every year from 2008 to 2013, following the onset of the economic downturn.
Nôl i'r tabl cynnwys9. Revisions
Overall revisions to the total healthcare expenditure series, from 1997 to 2012, have resulted in small changes to total healthcare expenditure of no more than 1.5% in any given year, compared to the figures published previously. The revisions have tended to be upwards in nature and are primarily a result of changes to the UK national accounts through the implementation of the new European System of Accounts 2010 (ESA 2010)1. These changes were adopted to bring the UK into line with international standards adopted by all European Union (EU) member states and with worldwide best practice. The revisions to total healthcare expenditure estimates are available in the reference tables.
Notes for revisions
- Details on the impact of ESA 2010 on UK National Accounts are available on the ONS website
10. The system of health accounts
From 2016, the Office for National Statistics (ONS) will be required by EU law to produce health accounts. These are a set of statistics which analyse healthcare expenditure by different types of function, provider organisation and financing method. The data produced for this output will provide a rich source of information on the structure of expenditure in the UK healthcare system.
The health accounts will be produced in line with a set of international definitions known as the System of Health Accounts 2011 (SHA 2011), which have been developed by the Organisation for Economic Co-operation and Development (OECD), Eurostat – the statistical office of the European Union, and the World Health Organisation (WHO). These definitions will be used by all member states of the EU from 2016 and are already in use by the majority of OECD member states. As a result, production of a UK System of Health Accounts will enable a consistent comparison of UK healthcare spending with other EU member states and most other large high-income countries.
Adopting the System of Health Accounts 2011 definitions is likely to result in a number of changes to the scope of healthcare, such as the inclusion of social care provided for health-related reasons, and the inclusion of more preventative healthcare activities aimed at reducing the occurrence of illness and injury.
While the first publication of the three core UK health accounts tables will be in March 2016, covering a major portion of the System of Health Accounts using data for 2014, we intend to produce a limited number of figures from the new System of Health Accounts in May 2015 using 2013 expenditure data. These figures will be published as experimental statistics in an article which will provide information on the specification of the System of Health Accounts and details about the methodology used.
Figures delivered by ONS for publication in the Eurostat and OECD databases in 2015, and in the OECD’s annual Health at a Glance report, will again be drawn from the series currently used in Expenditure on Healthcare in the UK. In 2016, Eurostat and OECD will switch to publishing the new UK health accounts data.
While the 2016 publication of ONS healthcare expenditure statistics will analyse the new System of Health Accounts data, we are likely to update the existing series used in this publication and publish this alongside the new data, in order to maintain the current time series.
Nôl i'r tabl cynnwys
