1. Context
In the UK, official statistics are produced by organisations named in the Statistics and Registration Service Act 2007. These organisations include the Office for National Statistics (ONS), government departments and national surveys, censuses and government administrative data. However, alternative data are increasingly being generated that might have potential in producing statistics, including data available on the internet, on social media, through sensors, customer transactions, electronic point of sale, and mobile phones.
Some organisations, especially those with proprietary access to some of these alternative data, can produce alternative statistical products to current official statistics. These alternative statistics often have better timeliness or spatial granularity to those offered by the standard procedures used to produce official statistics but lack transparency on methods and quality, and usually have a cost to the consumer.
Around the world, producers of official statistics are interested in understanding the value placed on official statistics. This is being explored by a United Nations Economic Commision for Europe taskforce (chaired by the UK) who are reviewing a dashboard of measures and approaches to calculate value within a framework (PDF, 3.73MB).
Comparing the value of official statistics with alternative non-official statistical products is a challenging question as standard demand and supply methods are hard to employ. For example, in the UK, official statistics are free at the point of use and the market share for official statistics cannot be understood in relation to price.
Previous studies (commissioned by the ONS), have had limited success in developing an approach to the valuation of official statistics. One recommendation from a study undertaken by Deloitte was to use indirect questioning to data users on price.
One technique, widely used in marketing studies, is known as “conjoint” analysis – a survey-based approach that asks respondents to “consider jointly” their preference between a number of products described by underlying attributes.
This article describes an innovative pilot study using conjoint analysis to test the potential in using this approach in the valuation of official statistics. This study was conducted internally to test out the concept initially with an aim to do a more expansive external study that would include stakeholders and the public more widely.
Nôl i'r tabl cynnwys2. Introduction
In economics, utility theory is used to model value or worth. It explains the behaviour of individuals on the premise that they can make rank-ordered choices depending on their underlying preferences. As the concept of utility is fairly abstract, it is generally thought that it cannot be measured directly.
Conjoint analysis is a revealed preference approach to estimating preferences by describing a product by its attributes and asking a series of questions to respondents, each time to choose their preference between different products with varying levels of each attribute. These questions are typically called “trade-off” questions where attributes and levels are “considered jointly”.
These preferences can be used to infer relative “utilities” that represent the relative value an individual has for each attribute and its levels. Adding these utilities for each attribute leads to the utility for the overall product.
For example, a television might be described using three attributes: “brand”, “screen-size” and “price”. A specific television might have a brand level of “Panasonic”, a screen-size level of 54 inches and a price level of £1,000. The utility a customer has for this television will simply be the sum of their utilities for each appropriate level of these attributes.
Methods such as conjoint analysis have been widely used in marketing, most typically in product positioning studies where markets are well defined. It is an outgrowth of stated preference techniques with best-worst scaling as used more commonly in types of contingent valuation, for example, environmental economics.
One main use of relative utilities is to derive “preference shares” where each respondent’s preference for a specific product, among a set of products, is modelled.
With appropriate weighting it is possible to create preference shares representing the population. With certain assumptions1 , these preference shares are used to denote actual market shares that should be expected given a set of products defining the market.
Furthermore, with price as an attribute, relative utilities may make it possible to calculate the “willingness to pay”: the maximum amount a respondent is willing to pay for a certain level of an attribute (over a baseline level).
The Office for National Statistics (ONS) used conjoint analysis in a small internal pilot study to test its potential to inform on the value of “official” earnings data. This pilot study consisted of two linked parts: a conjoint questionnaire, built using the software Conjoint.ly, followed by interviews with respondents. This report is the analysis of the results from the conjoint questionnaire.
The main objectives for this pilot are:
to test the concept of conjoint as a suitable approach to eliciting a value for official statistics
to test the functionality of Conjoint.ly software
to identify improvements for a follow up study
This article first introduces the methods used and follows this with the results. A discussion section highlights some of the main considerations for employing the conjoint approach to the valuation of official statistics before a final summary of the pilot.
An annex is also provided containing:
Annex A: Validation of individual level utilities
Notes for: Introduction
- All products in a market are available to everyone; respondents have full understanding of attribute definitions; products have reached market maturity.
3. Method
Choice of statistic and attributes
Measuring an overall value of official statistics is an objectively difficult task and the diversity of official statistics is extremely vast. Therefore, the purpose of this study is to focus on a specific statistical output to test the conjoint concept. Earnings data is used, as there are alternatives to official data that can help to set a reasonable market price and might also help to understand current market shares.
The following attributes and levels were selected to describe earnings data:
source: official or non-official
frequency: monthly or annually
geography: regional or national
price: free, £1,500 or £5,000
Definitions1 for each of these attributes are introduced to respondents before they are asked to respond to the conjoint questioning.
Commercial alternatives to official earnings data were found to have a cost around £1,500. This was used as the mid-point price level for the study, with £5,000 representing a high price (and free for the lowest price point in line with current official statistics).
Unconstrained versus constrained budget
In classical economics, real-life purchasing decisions collectively determine the price or value of a product in a marketplace. However, products that are free and have no market price, such as official statistics, are difficult to value.
A study by Rao and Sattler argues that someone with a finite budget will make value judgements differently to someone who does not have to concern themselves with a budget. The authors term this as a “constrained and unconstrained” budget setting respectively.
Using the authors’ argument, it follows that current users of official data will effectively value them as if they have unconstrained budgets.
This pilot study tests respondents' value judgements in both an unconstrained and constrained budget context to see if differences can be observed.
Study design
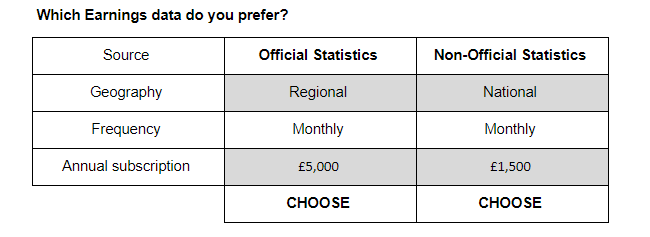
Conjoint studies ask respondents to choose their preference between two or more products. This is done via a series of trade-off questions as illustrated in Figure 1.
Figure 1: Example of a trade-off question
Internal pilot study, March 2020
Source: Office for National Statistics - Internal study
Download this image Figure 1: Example of a trade-off question
.png (10.5 kB) .xlsx (27.1 kB)
Respondents are asked to complete four short conjoint studies (denoted as Conjoint 1 to 4) in sequence. After each study, the interviewer asks the respondent for their reaction to how they felt they valued the various attributes.
The four conjoint studies follow a natural order building up to the constrained budget setting in Conjoint 4 as described in Table 1. The intention is to see how value judgements change throughout the settings.
| Study # | Attributes and Levels | Unconstrained (U) or Constrained (C) budget | Description |
|---|---|---|---|
| Conjoint 1 | Source: Official or Non-Official | U | Benchmark without Price |
| Frequency: Monthly or Annual | |||
| Geography: Regional or National | |||
| Conjoint 2 | Source: Official or Non-Official | U | Official = FREE, Non-official = cost |
| Frequency: Monthly or Annual | |||
| Geography: Regional or National | |||
| Price: Official = FREE | |||
| Non-official = £1500 or £5000 | |||
| Conjoint 3 | Source: Official or Non-Official | U | Price is possible for both Official and Non-official |
| Frequency: Monthly or Annual | |||
| Geography: Regional or National | |||
| Price: FREE, £1500 or £5000 | |||
| Conjoint 4 | Source: Official or Non-Official | C | Same as Conjoint 3 – with constrained budget |
| Frequency: Monthly or Annual | |||
| Geography: Regional or National | |||
| Price: FREE, £1500 or £5000 |
Download this table Table 1: Specification for each conjoint study
.xls .csvConjoint.ly templates
The Conjoint.ly software contains a number of templates to conduct a conjoint study. This pilot study uses the “brand” template which allows attribute levels to vary by brand (or source as we have it defined). This template is chosen because there are differing levels for price in Conjoint 2: official statistics can only be free whilst non-official statistics can only be £1500, or £5000.
It would also have been possible to use the “generic” template and to make use of functionality in Conjoint.ly to restrict official products to having a price level of free only.
Sample
A total of twenty staff from the Office for National Statistics (ONS) participated in the pilot study. Purposive sampling was used so that the respondents had different levels of seniority and were from different areas of the office. There were varying levels of service with some having worked outside of the ONS. Respondents also included those in the “valuing official statistics expert group” and those involved in the production of earnings data. Six of the respondents had budget responsibility.
Interview procedure
Due to the public health circumstances at the time of the research, interviews were conducted using Skype for Business. Shortly before the scheduled interview respondents were sent an email with links to the four conjoint conditions and a document defining the four attributes. They were instructed not to open these prior to the interview. The interviews were scheduled for 45 minutes and the interviewers were accompanied by a note taker and, on occasion, an observer. During the interviews a topic guide was followed2.
Respondents were asked to share their screen and interviewers asked for permission to record the interview audio and screen capture. To begin, participants were asked pre-test questions to ascertain their baseline knowledge of official and non-official statistics. This was done to establish, qualitatively, the current level of awareness of official statistics and if it is appreciated that many commercial data products might themselves depend on official data.
Then, participants independently worked their way through the first conjoint condition. When finished they were asked follow-up probes exploring their thoughts about the condition. This process was repeated for the following three conjoint conditions.
Analysis
For each conjoint study, a research report was generated through the inbuilt functionality in Conjoint.ly. Each report models each respondent’s utilities based on their responses to the trade-off questions, and a standard set of analyses are also produced using all the respondents’ utilities.
Conjoint.ly allows the downloading of utilities for the individual respondents and these are used to analyse the effects on value judgements across the four conjoint studies.
A simulation tool is also generated within Conjoint.ly which allows the user to experiment with defining products in a market. “Preference shares” are generated for different products scenarios and are used to examine how respondents collectively prefer the source of earnings data.
Care must be taken with interpreting these analyses as the sample of respondents was very small and only represented the views of internal “professional” users of official statistics, whereas the whole population ultimately benefits from them. Further conjoint research will require improvements to sample representatively.
One respondent was removed from analysis because of missing data.
Notes for: Method
Available on request.
The topic guide is described at length in a separate qualitative summary paper to this conjoint study. Available on request.
4. Results
Individual level analysis
In each conjoint study, Conjoint.ly derives utilities for each respondent, for all attributes and attribute levels. A technical note highlights that these utilities are derived using a “Hierarchical Bayesian Model” and a linear transformation is applied so that the first level of an attribute is set to zero and other attribute levels set in relation to this first level. The relationship between utilities for each respondent is preserved under the linear transformation.
Table 2 illustrates the utilities derived for three respondents in the Conjoint 3 exercise. It is seen that separate utilities are produced for frequency, geography and price depending on the source (official statistics or non-official statistics). Missing attribute levels in this output are set to zero as they represent the top level of each attribute.
| ID | Source | Frequency: Annual | Geography: Regional | Annual Subscription: £1500 | Annual Subscription: £5000 | ||||
|---|---|---|---|---|---|---|---|---|---|
| Non- official | Official | Non- official | Official | Non- official | Official | Non- official | Official | Non- official | |
| 1 | -5.47 | -3.81 | -3.43 | 4.97 | 3.37 | -0.25 | -2.29 | -6.30 | -5.24 |
| 2 | -3.99 | -6.66 | -5.27 | 5.26 | 5.17 | -2.38 | -1.28 | -4.14 | -4.04 |
| 3 | -5.29 | -5.74 | -4.56 | 5.13 | 4.84 | -0.26 | -1.92 | -4.48 | -4.33 |
Download this table Table 2: Respondent level utilities (for 3 respondents in Conjoint 3 exercise)
.xls .csvValidation
A series of checks were made on the utility results, for each respondent. These were:
examination of the order of utilities within each ordinal attribute (attributes that are expected to have a natural order to their levels): frequency, geography and price
the distribution of utilities for each attribute across all respondents
the similarity of utilities for frequency, geography and price conditional on the data being official or non-official data
The checks suggested that conjoint exercises one to three had consistent results. Price is seen to increase in importance in Conjoint 3 with the introduction of a cost for official statistics.
Conjoint 4 produced the expected result of price increasing in importance yet also showed some inconsistency with, most notably, a reduction in utility for the source being official and a corresponding increase in utility for regional level data. It is unclear why these inconsistencies exist although it might partly be due to the expected variability with such a small sample size.
The validation checks are described in more detail in Annex A.
Most influential attribute
The most important or influential attribute for each respondent is the one with the largest absolute utility by magnitude. In Table 2 the most important attribute for the first respondent is “Cost £5,000” with an absolute utility of 6.1.
Looking across the four conjoint exercises, the frequency for each attribute to be the most important is shown in Figure 2.
Figure 2: Most influential attributes in each conjoint study
Internal pilot study, March 2020
Source: Office for National Statistics - Internal pilot study
Download this chart Figure 2: Most influential attributes in each conjoint study
Image .csv .xlsCare must be taken in interpreting this chart as it does not convey the relationship between utilities. For example, the second most important attribute for a respondent might be very close in utility value to the most important.
Figure 2 shows us that the source is the most important attribute for around half of the 19 respondents in Conjoint 1 to 3. No one has source as the most important attribute for Conjoint 4. Across all respondents there is an unexplained reduction in utility for source matched by an increase in utility for geography.
Price starts to become more important in Conjoint 3, which is the first time that respondents consider official statistics as potentially having a cost. The importance of price increases as expected in Conjoint 4. The importance of frequency and geography varies across the four conjoint studies although the validation checks suggest that there is consistency in their distributions for Conjoints 1 to 3.
Willingness to pay
Willingness to pay (WTP) is an economic concept representing the maximum amount a customer is willing to pay for a product or service.
Conjoint studies derive relative utilities for all the attributes (and levels of) a product. If price is one of these attributes, then it can be possible to derive the WTP for a change in the level of an attribute of a product. In this study, our main interest is the WTP for official earnings data compared to an equivalent product that is non-official.
To calculate this WTP it is necessary for the utilities for frequency and geography to be the same irrespective of source, and this occurs when monthly and national level data is chosen as these utilities are always set to zero.
Price utility curves should also be the same for both official and non-official data, but the validation checks suggest that the price utility distributions for official data are less negative than for non-official data. By using a specific example where products are free, an illustration of the WTP for official data can be achieved.
Illustration of WTP
For this illustration we use the utility results for the first respondent in Table 2.
If there are two free earnings data products with the same geography and frequency then the total utility for these products will differ only by the utility for source.
| Source | Official (0) | Non-Official (-5.47) |
|---|---|---|
| Geography (National) | 0 | 0 |
| Frequency (Monthly) | 0 | 0 |
| Price (FREE) | 0 | 0 |
| Total utility | 0 | -5.47 |
Download this table Table 3: Utilities for two sets of FREE earnings data that differ only in source
.xls .csvThe respondent has a total utility of zero for official statistics and minus 5.47 for non-official Statistics. For the official statistics product to have the same total utility as the non-official we can increase the price of it until the total utility for official becomes minus 5.47.
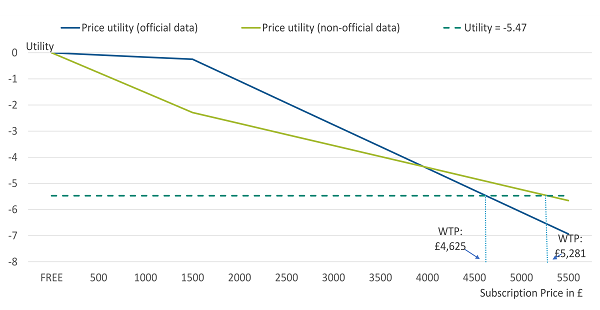
Using the price utilities, and interpolation, it is possible to create price utility curves for official and non-official data representing the marginal willingness to pay (that is, the marginal increase in utility for a reduction in price).
Figure 3, illustrates the price utility curves for the first respondent illustrated in Table 2.
The price utility curves for official and non-official data are shown together with a horizontal line depicting a utility of minus 5.47. The WTP is calculated by interpolation of the price utilities at the point at which the horizontal line crosses the price curves. The point that the price utility is minus 5.47 is £4,625 using the official price utility curve and £5,281 using the non-official curve.
Figure 3: Willingness to pay using separate price utilities for a single respondent
Internal pilot study, March 2020
Source: Office for National Statistics - Internal study
Download this image Figure 3: Willingness to pay using separate price utilities for a single respondent
.png (31.4 kB) .xlsx (31.7 kB)
Figure 4 and Figure 5 show the calculation of each respondent’s WTP for official data, in Conjoints 3 and 4 respectively. Each chart shows the WTP using the price utility curve for official data on the x-axis and the price utility for non-official data on the y-axis.
Figure 4: Willingness to pay for official over non-official statistics, using different price utilities, Conjoint 3
Internal pilot study, March 2020

Source: Office for National Statistics - internal pilot study, 19 respondents
Download this image Figure 4: Willingness to pay for official over non-official statistics, using different price utilities, Conjoint 3
.png (22.6 kB) .xlsx (33.2 kB)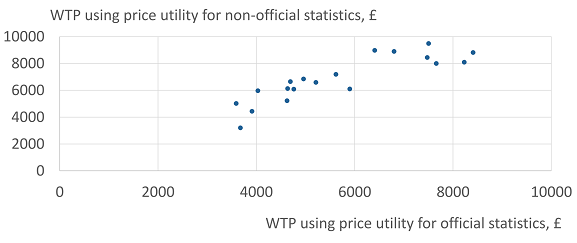
Figure 5: Willingness to pay for official over non-official statistics, using different price utilities, Conjoint 4
Internal pilot study, March 2020

Source: Office for National Statistics - Internal pilot study, 19 respondents
Download this image Figure 5: Willingness to pay for official over non-official statistics, using different price utilities, Conjoint 4
.png (23.6 kB) .xlsx (32.5 kB)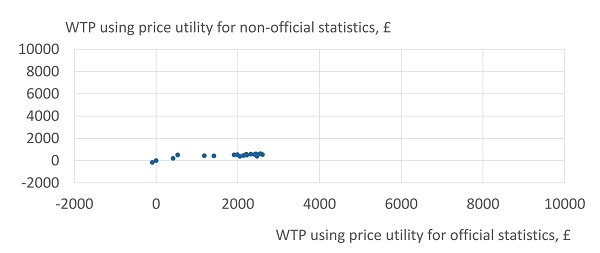
Figure 4 shows the expected pattern for WTP if price utilities are the same regardless of the source. It shows a linear relationship with only a tendency to be higher using non-official price utilities.
Figure 5 shows a much lower WTP mainly driven by the much smaller utilities for official data observed for Conjoint 4 in the validation checks. Although the relationship is linear, it is noticeable that respondents are willing to pay more if using the price utility for official statistics than the price utility for non-official statistics.
Summing the WTP for official statistics across all respondents in each conjoint study that had price as an attribute, we display the results in Figure 6 and Table 4. It is interesting to note that, using price utilities for non-official statistics in Conjoint 2, a similar WTP for official statistics is produced to Conjoint 3.
Figure 6: Total willingness to pay for official over non-official statistics
Internal pilot study, March 2020
Source: Office for National Statistics - Internal pilot study, 19 respondents
Download this chart Figure 6: Total willingness to pay for official over non-official statistics
Image .csv .xls
| Willingness to pay for official vs non-official | Using official statistics price utility | Using non-official statistics price utility | |
|---|---|---|---|
| Conjoint 2 | Total | na | £155,731 |
| Average | na | £8,196 | |
| Conjoint 3 | Total | £107,480 | £131,213 |
| Average | £5,657 | £6,906 | |
| Conjoint 4 | Total | £26,608 | £8,253 |
| Average | £1,400 | £434 | |
Download this table Table 4: Willingness to Pay for Official Statistics, using different price utilities for 1 year subscription, 19 respondents
.xls .csvPreference shares
When a market consists of more than one product, as in the case where there may be alternatives to official data, it is possible to model the overall preference for each product in that market. With certain assumptions, these preference shares can be used as a proxy for market shares.
Preference share simulations are useful for product positioning and for understanding how much customers are willing to pay to improve features of a product.
Conjoint.ly provides a simulation tool to test different product scenarios by varying the set of products available. Each respondent’s utilities are converted into their preference for each product using the logit choice formula:
Where:
j = the number of attributes defining a product
k = the number of products in the scenario
Uij = the utility for attribute j in product i
A weighted average of these preferences across respondents creates the overall preference share for products.
We present two scenarios consisting of two products each to illustrate this in Table 5 and Table 6. Preference shares are derived for each product using the utilities of our 19 respondents.
| Source | Frequency | Geography | Price | Preference |
|---|---|---|---|---|
| Official | Annual | National | Free | 99.71% |
| Non-Official | Annual | National | £1,500 | 0.29% |
Download this table Table 5 Scenario 1 specification and preference shares
.xls .csv
| Source | Frequency | Geography | Price | Preference |
|---|---|---|---|---|
| Official | Annual | National | Free | 56.81% |
| Non-Official | Monthly | Regional | £1,500 | 43.19% |
Download this table Table 6 Scenario 2 specification and preference shares
.xls .csv
Figure 7: Illustration of preference shares simulation
Internal pilot study, March 2020
Source: Office for National Statistics - Internal pilot study, 19 respondents
Download this chart Figure 7: Illustration of preference shares simulation
Image .csv .xlsIn scenario one there are two earnings data products, one being official data and the other non-official. The official data is free but the non-official data costs £1500. They are both provided at annual frequency and national geography. There is over a 99% preference share for official data.
However, in scenario 2, where non-official data is set to monthly and regional, the preference for official statistics reduces to 56% even though it is still free and there is a cost for non-official statistics.
In the application of official statistics, preference share simulations might be used to understand the current preference for official data versus known alternative products. Setting a threshold for preference of official statistics products might help official providers to understand which official statistics have the greatest and least value to customers. Understanding which features might be affecting the value to customers can help official data producers decide where to invest further development.
A limitation exists for official statistics that have no alternative in the market. Here it might be possible to use preference share simulations to develop improvements to existing statistics by setting scenarios containing multiple official statistics products with varying levels of attribute.
Extrapolating to population estimates
Deriving population estimates requires appropriate weighting for each respondent, as is standard using a sample.
Again, this might be challenging for this application as the population size for users of earnings data might be difficult to assess.
Validation of population estimates
Validation of a conjoint study can be done by simulating current market conditions: setting up a scenario for products currently available in the market and producing preference shares that are a reasonable approximation to current market share.
Market size cannot be directly estimated, although it is possible to use the preference shares for various product scenarios, for example, to calculate the expected revenue for 1,000 products. Conjoint.ly has the functionality to produce this output in its in-built simulation tool.
Understanding the current market for earnings data is difficult for both market size and market share. Although a finite number of non-official data providers might be identified, they will tend to be private companies and the level of financial information required might be lacking. Some data might have costs clearly publicised, as used in this study, but it is usual for companies to provide all sorts of cost packages that might include access to other data and value-added functions like different formats, analyses, tools etc.
With official statistics being free at the point of use, this also brings challenges to understand the market. It is likely that users will use both official and non-official data (if they can afford it). Even with good information on market size for non-official data on earnings, it is not clear how to represent this in market shares when official data can be used by all.
This study used too small a sample to attempt a form of validation, but this should be given more thought for future studies.
Nôl i'r tabl cynnwys5. Discussion
High variability
During this analysis it was necessary to run the Conjoint.ly reports a number of times as the results had quite a lot of variability.
The main cause of this variability is thought to be the use of hierarchical bayesian modelling in the derivation of each respondent’s utilities:
hierarchical bayes modelling produces a distribution for the utilities from which repeated random samples are pulled in order to create the inferences for utility values
the use of hierarchical modelling requires a part-pooling of the variance in responses across respondents; the sample of 19 respondents is very small to do this pooling reliably, leading to greater variability in results
Another factor impacting on the variance is the use of Conjoint.ly’s brand template. This results in the hierarchical model having to estimate two sets of utilities for each attribute depending on the source of the data. Coupled with the very small sample size this is likely to be demanding a lot from the hierarchical modelling.
There was no quantitative evidence in Conjoints 1 to 3 to suggest that utilities for frequency, geography and price are different for official statistics as opposed to non-official statistics. Conjoint 4 did show differences in utilities although the qualitative questioning did not suggest that such differences were notable for respondents.
To help reduce the variability in results, it is suggested that Conjoint.ly’s generic template might be more suitable as this assumes a single utility for each attribute and will reduce the number of utilities needed to be estimated. A much bigger sample is also necessary.
Price being free
Conjoint studies generally advise against using a price level of free as this is said to cause respondents to form different value judgements to other more tangible price points. We did not test this in this study, although we could have set up a conjoint exercise where the three price points did not include free. This would have to be done with care as official data is currently free, and a previous study conducted by the ONS has indicated that respondents might become suspicious that pricing policies are due to be brought in and consequently respond strategically.
Respondents generally took longer to respond to trade-off questions in Conjoint 3 than in either of Conjoint 1 and 2. Respondents suggested this was due to a cost being associated with official statistics in Conjoint 3 although there is still consistency in results across Conjoints 1 to 3.
There can also be reluctance to make a purchase at all, especially if the price is too high. Some data users might simply forgo the use of data if the price is too high, removing themselves from the market. Conjoint.ly functionality allows the option for a respondent to not like either product in a trade-off, and this might be used in future studies to test if setting a price for official statistics is an issue.
Segmentation
The sample of respondents included six with more seniority and budget control. Conjoint.ly allows segmentation and, for a set combination of products, preference shares for this group were compared with preference shares for all respondents. There was no evidence that the preference shares were different.
Flexibility of Conjoint.ly
Conjoint.ly requires hardcoded attributes and levels. All respondents will see these same attributes and levels. It might be that some flexibility could improve the data collection from a conjoint study. For example, a respondent might give a rating for official data and competitors. A bespoke choice set of competitor brands might then be used within the trade-off questions. This would give the respondent more relevant product offerings to choose from and multiple competitors could be tested.
A limitation of Conjoint,ly to the development of a more bespoke questionnaire is that it uses a hierarchical model to calculate utilities. This means that responses need to be pooled across respondents, meaning that each respondent must see and respond to the same attributes and levels.
A more flexible questionnaire might need to use a model that is not hierarchical, so that each respondent’s utilities can be derived from each respondent’s responses alone. This might be achieved by exporting responses from Conjoint.ly and running them through alternative regression modelling.
Secondary benefits
The study only considers the primary benefit (or utility) of access to official statistics. There are secondary (and tertiary) benefits that are even harder to quantify and may not be well suited to a willingness to pay (WTP) framework (or might even provide additional price points for WTP studies). These range from users being able to charge for products and services that result from using official statistics, to the benefits of academic research that may not have occurred to accountability of government.
These are out of scope for this particular study, but they might be approached in other studies or through different methods.
Nôl i'r tabl cynnwys6. Summary
This pilot study has used conjoint survey methods to identify the relative utilities respondents have for various features of earnings data: namely, source, frequency, geography and cost. The software used was Conjoint.ly.
Four separate conjoint exercises were conducted to test how respondents reacted to the introduction of price and whether they had a constrained or unconstrained budget. Each conjoint exercise generated respondent’s utilities from their responses to trade-off questions using the software’s internal hierarchical bayesian modelling.
Validation checks on these utilities suggest that the order of utilities is good within each conjoint study and that the distribution of utilities for each attribute are reasonably consistent across Conjoints 1 to 3. The utilities for geography and frequency appear similar for both official and non-official statistics.
Although it is not clear if results are distorted by including a cost for official statistics, the qualitative study did indicate that respondents had to consider their responses more carefully, demonstrating a more thorough evaluation exercise.
Conjoint 4, involving a constrained budget setting, had lower utilities for official data although correspondingly higher for regional data. The concept of constrained and unconstrained budgets is not thought to have been a major factor in this as there was nothing from the qualitative questioning to suggest that respondents suddenly valued attributes differently depending on the source. It is suggested that the small sample in conjunction with hierarchical modelling and the challenge of calculating separate utilities conditional on the source of the data might be the main factors in this variability.
Estimates for the willingness to pay for official data over non-official data are created using respondents’ relative utilities although it is difficult to validate them as there are difficulties in identifying current market shares for earnings data.
Preference shares simulated for various product scenarios reflect the underlying utilities derived across the respondents and can be used to understand the value of official data and help producers of official statistics identify the most important areas for improvement.
Finally, the concept of constrained and unconstrained budgets could not be tested reliably given the perceived distortion in results from Conjoint 4 which tested the constrained budget. However, results from budget holders did not differ from non-budget holders throughout the four conjoint exercises, giving some indication that budget control did not affect decision-making on value judgements.
Suggestions for improving this study and next steps include:
Study design:
testing different price ranges to see if respondents are influenced by the prices set in the trade-off questions
removing the concept of constrained and unconstrained budgets and replace with a question upfront asking respondents what level of budget responsibility they have before asking standard trade-off questions asking for preference to be ranked
using Conjoint.ly’s generic template as this will estimate a single utility for frequency, geography and price irrespective of data being official or non-official
including an option for the respondent to like neither product
consider extending to other official data
Sample:
using a much bigger sample to help the reduce the variability in the modelling
using a wide range of external stakeholders
Modelling:
gaining a better understanding of how the hierarchical bayesian model works and its pros and cons from other modelling methods
greater thought on how to define the market and to validate the preference shares generated from this study
7. Annex A: Validation of individual level utilities
Validation: order of attribute levels
“Frequency”, “geography” and “price” are ordinal attributes in that there should be a natural order to their levels. For example, with the attribute “frequency”, the utility for monthly data should be greater than the utility for annual data.
Table 7 summarises the number of respondents who have the expected ordering of utilities within each of these ordinal attributes. The table also shows us that the utility for official statistics has a higher utility than non-official statistics across all respondents and conjoint exercises, apart from one respondent in Conjoint 4.
Examination reveals that this respondent has a relative utility of 0.15 for non-official over official. This is very close to zero, the utility set for official and effectively shows that this respondent does not think the source is important. Other utilities that did not follow the expected order were also close to zero.
Overall, the sensible ordering of attribute levels supports the validity of the conjoint method.
| Study # | Official > Non- official | Official | Non- official | Official | Non- official | Official | Non- official | ||
|---|---|---|---|---|---|---|---|---|---|
| Monthly > Annual | Regional > National | Price Free > £1500 | £1500 > £5000 | Price Free > £1500 | £1500 > £5000 | ||||
| Conjoint 1 | 19 | 19 | 19 | 19 | 18 | ||||
| Conjoint 2 | 19 | 19 | 19 | 19 | 19 | 19 | |||
| Conjoint 3 | 19 | 19 | 19 | 19 | 18 | 14 | 19 | 19 | 19 |
| Conjoint 4 | 18 | 19 | 19 | 19 | 19 | 19 | 19 | 19 | 18 |
Download this table Table 7: Validation of order in utilities for respondents, 19 respondents
.xls .csvValidation: distribution of utilities
The distribution of utilities for each attribute and conjoint study reveals that Conjoint 4, where respondents were asked to consider themselves responsible for a budget, looks different from the other conjoint studies. In particular:
the relative utility distribution for official data is reduced
the relative utility distribution for regional data is increased
the relative utility distribution for price being £1500 is more negative
As respondents are under budget constraint, it is reasonable to expect that the “price” attribute should become more important. It is less clear why the utility distribution for official data should reduce and the utility for regional data should correspondingly increase. The small sample size might be a factor for this variability.
Validation: similarity between sources of utilities for attribute levels
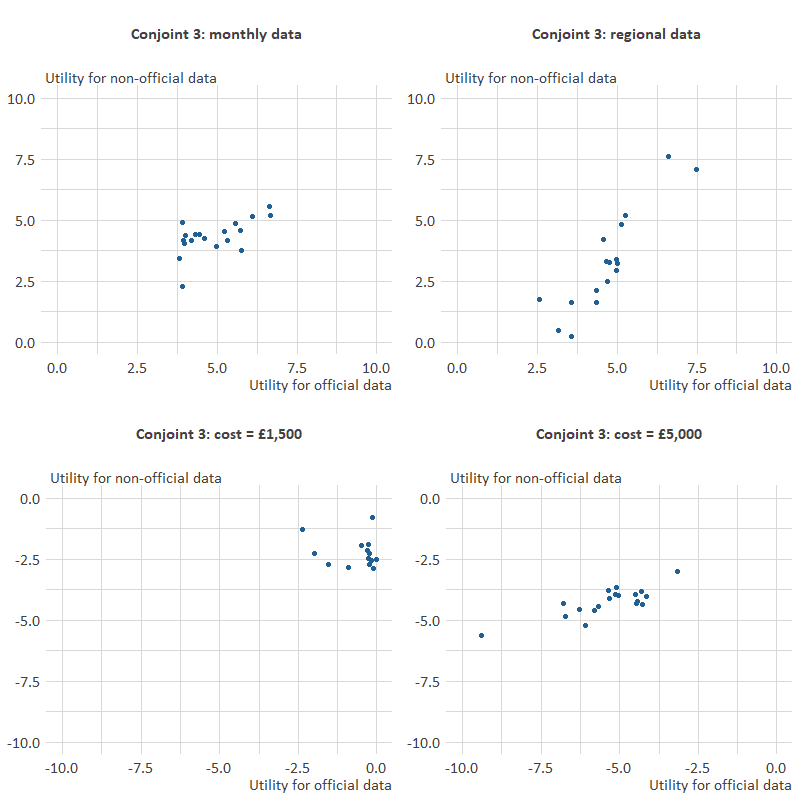
A third check uses scatter charts to see if the utilities for each attribute are the same regardless of the source of data. Figure 8 compares the relative utilities for each attribute depending on whether the source is official or non-official. These results are based on Conjoint 3 and each dot represents utility results for a single respondent.
Figure 8: Scatterplots of utilities for official vs non-official statistics in Conjoint 3
Internal pilot study, March 2020
Source: Office for National Statistics - Internal pilot study, 19 respondents
Download this image Figure 8: Scatterplots of utilities for official vs non-official statistics in Conjoint 3
.png (12.1 kB) .xlsx (51.7 kB)
Three scatterplots show broadly linear relationships regardless of the source: monthly data (relative to annual data), regional data (relative to national level) and cost = £5,000 (relative to it being free).
The scatterplot for cost = £1,500 is not linear although the utilities are fairly small for both official and non-official data. This suggests that paying £1,500 is not very influential in value judgements across respondents.
Bearing in mind the small sample and the variability in results to be expected, there is no strong evidence to suggest that utilities are different according to source. This was also found for Conjoints 1 and 2.
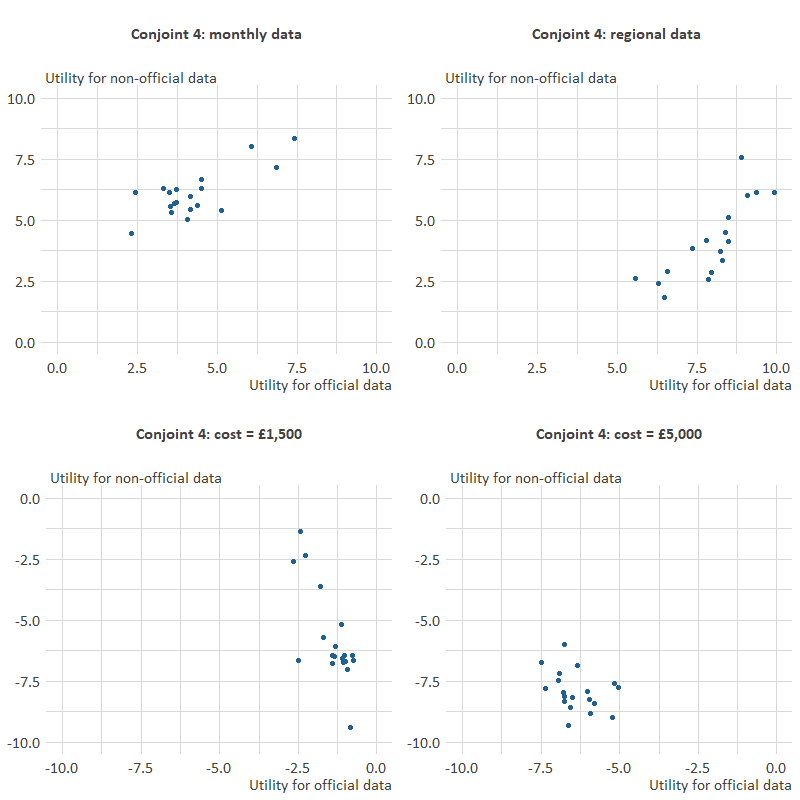
Conjoint 4 showed some inconsistency in utilities between official and non-official sources as illustrated in Figure 9.
Figure 9: Scatterplots of utilities for official vs non-official statistics in Conjoint 4
Internal pilot study, March 2020
Source: Office for National Statistics - Internal pilot study, 19 respondents
Download this image Figure 9: Scatterplots of utilities for official vs non-official statistics in Conjoint 4
.png (11.9 kB) .xlsx (51.7 kB)
The relationship between utilities for monthly data are still linear and broadly in the same range for official data (range between two and eight) and non-official data (range between four and eight).
Regional utilities relationship is still linear, but it is noticeable that the range for official data (between six and ten) is more than for non-official data (between two and eight).
The relative utility to pay £1,500 for non-official data is demonstratively more negative than for official data. Comparing this to the similar scatterplot in Conjoint 3 suggests that the utilities for paying £1,500 have become more negative for non-official data whilst official data has remained the same.
The relative utility to pay £5,000 does not have a linear relationship but is tightly grouped indicating that all respondents have a similar, very negative, utility to pay this amount of money regardless of the source. Comparing this scatterplot to the equivalent one for Conjoint 3 suggests that the largest shift is seen in non-official data, with the utility to pay £5,000 having become more negative.
We welcome any feedback you can give on the process.
If you have any further comments or questions on this work, please contact
valuing.official.statistics@ons.gov.uk
Thank you for participating
Nôl i'r tabl cynnwys