
1. Main points for 2017
There were 276,000 working days lost due to labour disputes, the sixth lowest annual total since records began in 1891.
The transport and storage sector accounted for 68% of all working days lost due to labour disputes; the strikes within this sector occurred mainly within public transport.
There were 79 stoppages, the lowest figure since records for stoppages began in 1891.
There were 33,000 workers involved in labour disputes, the lowest figure since records for workers involved began in 1893.
2. Introduction
This article presents analysis of the three main measures of labour disputes (working days lost, stoppages and workers involved) by industry, region, cause, size and duration. The statistics are put into context by considering estimates of working days lost per 1,000 employees. Data are taken directly from the employer or trade union involved after we have identified disputes from press reports.
This article gives information on labour disputes in 2017 as well as giving comparisons with earlier years. It presents year-total figures and provides a more in-depth analysis of figures than that published as part of the monthly Labour market statistical bulletin.
Nôl i'r tabl cynnwys3. Annual changes
A comparison of labour disputes in 2016 and 2017 is shown in Table 1. There are three core components to the figures: the number of working days lost through stoppages, the number of workers involved in those stoppages and the number of stoppages themselves. (See Section 12 Technical note for more details on these definitions.) Information on earlier years is available in Dataset Table 1: Labour disputes annual estimates, 1891 to 2017.
Table 1 : Number of working days lost, workers involved and stoppages in the UK, 2016 and 2017
| 2016 | 2017 | |||||
|---|---|---|---|---|---|---|
| Working days lost through stoppages: | 322,000 | 276,000 | ||||
| Workers involved in stoppages: | 154,000 | 33,000 | ||||
| Stoppages: | 101 | 79 | ||||
| Mean number of working days lost per stoppage | 3,191 | 3,499 | ||||
| Median number of working days lost per stoppage | 268 | 345 | ||||
| Source: Office for National Statistics | ||||||
| Notes: | ||||||
| 1. Workers in progress figures also include workers who did not strike initially, but who joined at a later date. | ||||||
Download this table Table 1 : Number of working days lost, workers involved and stoppages in the UK, 2016 and 2017
.xls (31.7 kB)As shown in Table 1, both the mean and the median number of working days lost per stoppage was higher in 2017 than in 2016. The mean value is generally much higher than the median, because working days lost can be greatly affected by large one-off strikes. For this reason, the median tends to give a more typical measure of the average number of working days lost per stoppage. This can be seen in Figures 1 and 2, where the median number of working days lost per stoppage is more consistent over time than the mean.
Figure 1: Median working days lost per stoppage in the UK
2010 to 2017
Source: Labour Disputes Inquiry, Office for National Statistics
Download this chart Figure 1: Median working days lost per stoppage in the UK
Image .csv .xls
Figure 2: Mean Working days lost per stoppage in the UK
2010 to 2017
Source: Labour Disputes Inquiry, Office for National Statistics
Download this chart Figure 2: Mean Working days lost per stoppage in the UK
Image .csv .xls4. Historical context
Figure 3 shows a time series of working days lost between 1891 and 2017. It shows that the amount of industrial action has significantly reduced since the early 1990s. This is a stark contrast to the level of action seen when the miners went on strike in the 1970s and 1980s. The 1910s and 1920s saw even greater levels of industrial action culminating in the general strike of 1926.
The highest annual total for working days lost on record was 162.2 million in 1926, the year of the general strike. Since 1926, there have been only three years when the annual total of working days lost has exceeded 20 million:
23.9 million in 1972, due mainly to a strike by coal miners
29.5 million in 1979, due mainly to the so-called “winter of discontent” (a number of strikes in the public sector in the winter of 1978 to 1979)
27.1 million in 1984, due mainly to a strike by coal miners
Since 2000, the highest annual total of working days lost was 1.4 million in 2011, due mainly to two large public sector strikes.
Figure 3: Working days lost in the UK
1891 to 2017
Source: Labour Disputes Inquiry, Office for National Statistics
Notes:
- 1898 - Welsh coal strike
- 1912 - National coal strike
- 1919 - Battle of George Square. Dispute over hours in a working week involving the shipbuilding and engineering trades
- 1921 - Black Friday
- 1926 - General Strike. Lasted 9 days. Over 1.5 million coal miners, dockworkers, iron workers, printers, railwaymen, steelworkers and other transport workers joined the strike
- 1972 - UK miners' strike
- 1979 - Winter of discontent
- 1984 to 1985 - UK miners' strike
Download this chart Figure 3: Working days lost in the UK
Image .csv .xlsTable 2 presents labour disputes figures for the period 1998 to 2017, while Figures 4 and 5 illustrate working days lost and the number of stoppages respectively. Figures 4 and 5 show that there are a number of spikes in the time series in years when a particularly large strike took place, showing the impact individual strikes can have on the statistics. The high number of days lost in 2011, for example, was due to two large public sector strikes, while the 2002 figure was due to one very large stoppage in the transport and storage industry. A longer time series showing stoppages and working days lost can be found within Dataset Table 1.
Table 2: Number of working days lost and stoppages in the UK, 1998 to 2017
| Year | Working days lost (thousands) | Working days lost per 1,000 employees 2 | Workers involved (thousands) | Stoppages 3 | Stoppages involving the loss of 100,000 working days or more |
|---|---|---|---|---|---|
| 1998 | 282 | 11 | 93 | 166 | - |
| 1999 | 242 | 9 | 141 | 205 | - |
| 2000 | 499 | 19 | 183 | 212 | 1 |
| 2001 | 525 | 20 | 180 | 194 | 1 |
| 2002 | 1,323 | 49 | 943 | 146 | 2 |
| 2003 | 499 | 18 | 151 | 133 | - |
| 2004 | 905 | 33 | 293 | 130 | 3 |
| 2005 | 157 | 6 | 93 | 116 | - |
| 2006 | 755 | 27 | 713 | 158 | 1 |
| 2007 | 1,039 | 37 | 745 | 142 | 4 |
| 2008 | 759 | 27 | 511 | 144 | 2 |
| 2009 | 455 | 16 | 209 | 98 | 1 |
| 2010 | 365 | 13 | 133 | 92 | 1 |
| 2011 | 1,390 | 51 | 1,530 | 149 | 3 |
| 2012 | 249 | 9 | 237 | 131 | 1 |
| 2013 | 444 | 16 | 395 | 114 | 2 |
| 2014 | 788 | 27 | 733 | 155 | 2 |
| 2015 | 170 | 6 | 81 | 106 | - |
| 2016 | 322 | 11 | 154 | 101 | 1 |
| 2017 | 276 | 9 | 33 | 79 | 1 |
| Source: Office for National Statistics | |||||
| Notes: | |||||
| 1.Cells containing a hyphen (-) represent zero. | |||||
| 2. Based on the estimates of employee jobs from Workforce Jobs (ONS). | |||||
| 3.Stoppages in progress during year. Prior to 2015 a dispute was counted as a new stoppage if there was a gap of more than one month between instances of industrial action. From 2015 disputes with a gap of more than one month between instances of industrial action are counted as a single stoppage. | |||||
Download this table Table 2: Number of working days lost and stoppages in the UK, 1998 to 2017
.xls (32.8 kB)
Figure 4: Working days lost in the UK
1998 to 2017
Source: Labour Disputes Inquiry, Office for National Statistics
Download this chart Figure 4: Working days lost in the UK
Image .csv .xls
Figure 5: Stoppages in the UK
1998 to 2017
Source: Labour Disputes Inquiry, Office for National Statistics
Download this chart Figure 5: Stoppages in the UK
Image .csv .xlsFigure 5 shows that there has been a decline in the number of strikes since 1998. Though volatile, the number of working days lost has remained broadly the same over this period. This shows that although the number of stoppages has fallen, large-scale stoppages have become more common.
The second column of Table 2 shows working days lost per 1,000 employees for each year from 1998 to 2017. This converts working days lost into a strike rate, taking into account the size of the labour force. This also enables comparisons to be made across industries and regions that differ in size, as well as adjusting for employment changes in industries and regions over time.
The level of employee jobs has generally risen over time. The strike rate in the last 10 years is generally lower than in previous decades. This rise in employment explains strike rates that differ between years when there are no discernible changes in working days lost. The 276,000 working days lost in 2017 is equivalent to nine working days lost per 1,000 employees, which is lower than the average over the last 20 years (21 working days).
Nôl i'r tabl cynnwys5. Industrial analyses
Historically, certain industries have been more prone to strike action than others and breaking the labour disputes statistics down into separate industries can reveal some interesting patterns and shifts over time. However, it should be noted that comparisons between industries can also be affected by the methodology that is used for compiling the figures. For example, because very small stoppages are excluded from the figures (see Section 12 Technical note for more details), it is more likely that industry groups with large firms will have disputes included in the statistics. In addition to this, caution must be exercised while carrying out time series analysis due to changes in industrial classifications over time.
Table 3 shows labour disputes statistics for 2017 broken down into 13 industry groups (classified according to the Standard Industrial Classification: SIC 2007). The largest sector, in terms of working days lost, workers involved and the number of stoppages was transport and storage; the strikes within this sector occurred mainly within public transport.
For 2017, the transport and storage sector accounted for around 68% of all working days lost in the UK (187,000 out of a total of 276,000) and 34% of all strikes (27 out of 79) occurred in that sector.
Table 3: Number of working days lost and stoppages by industry in the UK in 2017
| Industry group (SIC 2007) | SIC class | Working days lost (thousands) | Working days lost per 1,000 employees | Workers involved (thouands) | Stoppages* |
|---|---|---|---|---|---|
| All industries and services | 276.4 | 9 | 32.6 | 79 | |
| Agriculture forestry and fishing | 01,02,03 | - | - | - | - |
| Mining, quarrying and Electricity, gas, air conditioning | 5 to 9, 35 | - | - | - | - |
| Manufacturing | 10 to 33 | 25.2 | 10 | 4.1 | 5 |
| Sewerage, Waste Management and Remediation Activities and Water Supply | 36 to 39 | 2.3 | 12 | 0.2 | 1 |
| Construction | 41 to 43 | - | - | - | 1 |
| Wholesale and retail trade; repair of motor vehicles, and Accommodation and Food Services | 45 to 47, 55 to 56 | - | - | - | 1 |
| Transport and storage | 49 to 53 | 187.0 | 123 | 15.1 | 27 |
| Information and Communication | 58 to 63 | 6.3 | 5 | 0.5 | 2 |
| Financial and Insurance, Real estate, Professional, Scientific, Technical and Admin Activities | 64 to 82 | 19.4 | 3 | 2.3 | 12 |
| Public administration and defence; compulsory social security | 84 | 2.3 | 2 | 0.9 | 7 |
| Education | 85 | 27.3 | 10 | 8.7 | 17 |
| Human Health and social work | 86 to 88 | 6.4 | 2 | 0.5 | 5 |
| Other | 90 to 99 | 0.1 | - | - | 1 |
| Source: Office for National Statistics | |||||
| Notes: | |||||
| 1. The figures for working days lost and workers have been rounded and consequently the sums of constituent items may not agree precisely with the totals. | |||||
| 2. Some stoppages involved workers in more than one of the above industry groups, but have each been counted as only one stoppage in the totals for all industries and services. | |||||
| 3. Cells containing a hyphen (-) represent a zero or less than 50. | |||||
| 4. *Stoppages in progress during year | |||||
Download this table Table 3: Number of working days lost and stoppages by industry in the UK in 2017
.xls (34.8 kB)Figure 6 shows working days lost per 1,000 employees for the public administration and defence, education, and transport and storage sectors over a 10-year period. It shows how the strike rates for these sectors compare with the total strike rate for the economy as a whole.
Figure 6: Working days lost per 1,000 employees by sector in the UK
2008 to 2017
Source: Labour Disputes Inquiry, Office for National Statistics
Download this chart Figure 6: Working days lost per 1,000 employees by sector in the UK
Image .csv .xlsAs shown in Table 3 and Figure 6, disputes in 2017 were dominated by the transport and storage sector, which showed 123 working days lost per 1,000 employees, the highest strike rate for this sector since 2009.
Nôl i'r tabl cynnwys6. Regional analysis
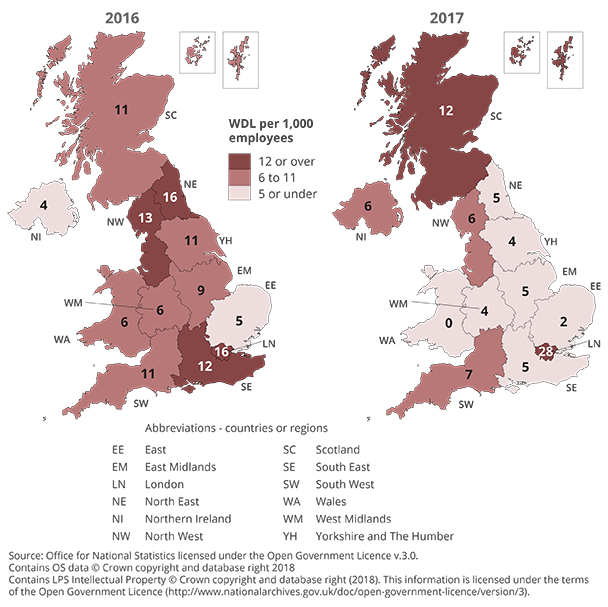
Dataset Table 2 shows regional strike rates between 2008 and 2017, with a further breakdown of the figures for 2017 by industrial grouping. When interpreting these figures, it is important to bear in mind that the industrial composition of employment in a region is a major influencing factor on the scale of labour disputes it experiences. The region with the highest strike rate in 2017 was London (28 working days lost per 1,000 employees). All of the regions except London, Scotland and Northern Ireland showed a decrease compared with 2016.
Looking at the figures over the 10-year period from 2008 to 2017, the North East has shown the highest strike rate (26 working days lost per 1,000 employees) and East of England has shown the lowest strike rate (seven working days lost per 1,000 employees).
Figure 7 compares working days lost per 1,000 employees between 2016 and 2017. Most regions showed a decrease in strike action over this period. London had the largest strike rate in 2017 (28 working days lost per 1,000 employees). Wales had the lowest strike rate in 2017; with only 500 working days lost over the year the strike rate for Wales, rounded to the nearest whole number, was zero working days lost per 1,000 employees.
Figure 7: Working days lost per 1,000 employees by country or region in the UK
2016 and 2017
Source: Labour Disputes Inquiry, Office for National Statistics
Download this image Figure 7: Working days lost per 1,000 employees by country or region in the UK
.png (198.4 kB) .xls (34.8 kB)
7. Cause of disputes
Dataset Table 3 shows stoppages in 2017 by principal cause and industry grouping. Disputes over pay also include stoppages over feared or alleged reductions in earnings, as well as disputes over the size of pay increases. Disputes over pension provisions are also classified as disputes over pay.
In 2017, around half of the stoppages (39 out of a total of 79) were due to wages disputes. Stoppages due to wages disputes accounted for 205,000 working days lost (around 74% of all working days lost in 2017) and 21,000 workers involved (around 64% of all workers involved).
Figure 8 and Dataset Table 4 give information on working days lost by cause of dispute in each year since 2008. The figures are often dominated by one or two very large strikes, which can make comparisons over time difficult.
Figure 8: Working days lost by principal cause of dispute in the UK
2008 to 2017
Source: Labour Disputes Inquiry, Office for National Statistics
Download this chart Figure 8: Working days lost by principal cause of dispute in the UK
Image .csv .xlsAs shown in Figure 8, pay has been the main cause of disputes in all years since 2008 except for 2009, 2010 and 2016. For 2009 and 2010, following the economic downturn, redundancies were the main cause of disputes. In 2016, the main cause was duration and pattern of hours worked (shown within the “Other” category in Figure 8) due mainly to a dispute involving junior doctors in the National Health Service in England.
Nôl i'r tabl cynnwys8. Disputes by duration
Labour disputes statistics cover the number of days that strike action took place, not the number of days the parties involved in the dispute were in disagreement.
Table 4 and Figure 9 show the duration of the 79 stoppages in progress in 2017. These show that 15 out of the 79 stoppages in 2017 lasted for one day only. While these one-day stoppages accounted for 19% of all stoppages and 9.5% of all workers involved, they only accounted for 1.0% of all working days lost in 2017.
There were only two stoppages that lasted for more than 50 days in 2017. However, these two stoppages accounted for 127,000 working days lost (45.9% of all working days lost in 2017).
Figure 9: Stoppages in progress by duration of dispute in the UK
2017
Source: Labour Disputes Inquiry, Office for National Statistics
Download this chart Figure 9: Stoppages in progress by duration of dispute in the UK
Image .csv .xls9. Disputes by size
Table 5 shows disputes in 2017 by size. Of the 79 stoppages in 2017, over half (43) had less than 500 days lost; these stoppages lasting less than 500 days accounted for only 2.3% of all working days lost in 2017. The largest stoppage in 2017 accounted for 43.6% of all working days lost in 2017. This shows the impact that large strikes can have on the figures.
Table 5: Stoppages in progress by size of dispute in the UK in 2017
| Working days lost in each dispute | Working days lost (thousands) | Proportion of all working days lost (%) | Workers involved (thousands) | Proportion of all workers (%) | Stoppages in progress | Proportion of all stoppages (%) |
|---|---|---|---|---|---|---|
| Under 250 days | 2.6 | 1.0 | 1.8 | 5.6 | 31 | 39.2 |
| 250 and under 500 | 3.7 | 1.3 | 1.1 | 3.4 | 12 | 15.2 |
| 500 and under 1,000 | 4.0 | 1.4 | 1.5 | 4.5 | 7 | 8.9 |
| 1,000 and under 5,000 | 29.1 | 10.5 | 13.0 | 40.0 | 16 | 20.3 |
| 5,000 and under 25,000 | 116.6 | 42.2 | 13.6 | 41.7 | 12 | 15.2 |
| 25,000 days and over | 120.5 | 43.6 | 1.6 | 4.8 | 1 | 1.3 |
| All stoppages | 276.4 | 100.0 | 32.6 | 100.0 | 79 | 100.0 |
| Source: Office for National Statistics | ||||||
| Notes: | ||||||
| 1. The figures for working days lost and workers involved have been rounded and consequently the sum of the constituent items may not agree with the totals. | ||||||
Download this table Table 5: Stoppages in progress by size of dispute in the UK in 2017
.xls (31.7 kB)Figure 10 shows how the 79 stoppages recorded for 2017 break down by working days lost.
Figure 10: Number of stoppages in progress by working days lost in the UK
2017
Source: Labour Disputes Inquiry, Office for National Statistics
Download this chart Figure 10: Number of stoppages in progress by working days lost in the UK
Image .csv .xls10. Disputes by public and private sector
While records for working days lost go back to 1891, the figures can only be broken down between the public and private sectors since 1996. Figure 11 shows the number of working days lost for the public and private sectors for every year since records began in 1996.
As shown in Figure 11, for each year between 2000 and 2016, there were more working days lost in the public sector than in the private sector even though the private sector is much larger. In 2017, for the first time since 1999, there were more working days lost in the private sector (232,000) than in the public sector (44,000).
The number of working days lost in the private sector in 2017 (232,000) was the largest since 1996 and the number of working days lost in the public sector in 2017 (44,000) was the lowest figure on record.
Figure 11: Working days lost by public and private sector in the UK
1996 to 2017
Source: Labour Disputes Inquiry, Office for National Statistics
Download this chart Figure 11: Working days lost by public and private sector in the UK
Image .csv .xlsTable 6 shows working days lost and number of stoppages for the private and public sectors for the last 10 years.
Table 6: Number of working days lost and stoppages by public and private sector in the UK, 2008 to 2017
| Working days lost (thousands) | Stoppages1 | Working days lost per 1000 employees2 | ||||
|---|---|---|---|---|---|---|
| Year | Public | Private | Public | Private | Public | Private |
| 2008 | 711 | 48 | 75 | 69 | 116 | 2 |
| 2009 | 368 | 88 | 49 | 49 | 57 | 4 |
| 2010 | 313 | 52 | 47 | 45 | 49 | 2 |
| 2011 | 1,276 | 113 | 87 | 62 | 205 | 5 |
| 2012 | 198 | 51 | 62 | 69 | 33 | 2 |
| 2013 | 363 | 81 | 50 | 64 | 63 | 3 |
| 2014 | 716 | 72 | 68 | 87 | 129 | 3 |
| 2015 | 90 | 79 | 53 | 53 | 16 | 3 |
| 2016 | 243 | 79 | 41 | 60 | 44 | 3 |
| 2017 | 44 | 232 | 30 | 49 | 8 | 9 |
| Source: Office for National Statistics | ||||||
| 1. Stoppages in progress during year | ||||||
| 2. Based on the latest estimates of public and private sector employment (ONS). | ||||||
Download this table Table 6: Number of working days lost and stoppages by public and private sector in the UK, 2008 to 2017
.xls (31.7 kB)11. Quality and methodology
The Labour disputes Quality and Methodology Information report contains important information on:
the strengths and limitations of the data and how it compares with related data
uses and users
how the output was created
the quality of the output including the accuracy of the data
12. Technical note
Coverage
Information regarding labour disputes within the UK is collected by Office for National Statistics (ONS) from a variety of sources. The information is collected directly from the employer or trade union involved after we have identified disputes from press reports. We publish figures on labour disputes each month in the Labour market statistical bulletin.
Definition of stoppages
The statistics cover stoppages of work in progress in the UK during a year caused by labour disputes between employers and workers, or between workers and other workers, connected with terms and conditions of employment. A distinction can be drawn between stoppages that started in the current year and those that started in earlier years.
A stoppage in progress is defined as a dispute that has continued from a previously recorded dispute by the same organisation and for the same cause. Prior to 2015, a dispute was counted as a new stoppage if there was a gap of more than one month between instances of industrial action. From 2015, disputes with a gap of more than one month between instances of industrial action are counted as a single stoppage.
The statistics exclude disputes that do not result in a stoppage of work, for example, work-to-rules and go-slows; this is because their effects are not quantifiable to any degree of certainty. Stoppages involving fewer than 10 workers or lasting less than one day are also excluded unless the total number of working days lost in the dispute is 100 or more.
Stoppages over issues not directly linked to terms and conditions between workers and employers are omitted, although in most years this is not significant. For example, in 1986 one stoppage was considered to be political (a protest in the coal industry against the visit of an MP) and it was excluded from the figures. The total working days lost amounted to less than 1,000. The next known dispute to be excluded was in 1991. This involved a boycott by self-employed market traders who, after increased rent and changes to the market rules, kept their stalls closed for about 20 weeks.
The statistics include “lock-outs”, that is, where an employer prevents their employees from working by refusing entry to the place of work and “unlawful”, that is, unlawfully-organised strikes. However, no distinction is made between a “strike” and a “lock-out” or between “lawful” and “unlawful” stoppages. This is principally because of the practical difficulty in deciding in which category a particular stoppage falls. It was for similar reasons that a distinction between “official” and “unofficial” disputes was no longer made after 1981.
Working days lost
Working days lost are defined as the number of days not worked by people as a result of their involvement in a dispute at their place of work. In measuring the number of working days lost, account is taken only of the time lost in the basic working week. Overtime work is excluded, as is weekend working where it is not a regular practice.
Where an establishment is open every day and runs two or more shifts, the statistics will record the number of working days lost for each shift. In recording the number of days lost, allowance is made for public and known annual holidays, such as factory fortnights, occurring within the strike's duration. No allowance is made for absence from work for such reasons as sickness and unauthorised leave.
Where strikes last less than the basic working day, the hours lost are converted to full-day equivalents. Similarly, days lost by part-time workers are converted to full-day equivalents. The number of working days lost in a stoppage reflects the actual number of workers involved at each point in the stoppage. This is generally less than the total derived by multiplying the duration of the stoppage by the total number of workers involved at any time during the stoppage, because some workers would not have been involved throughout.
In disputes where employers dismiss their employees and subsequently reinstate them, the working days lost figure includes those days lost by workers during the period of dismissal.
For disputes where employers dismiss their employees and replace them with another workforce, the statistics cannot assume that working days lost by the sacked workers continue indefinitely. In such cases, the statistics measure the number of days lost in terms of the size of the replacement workforce. For example, where an employer initially recruits 100 workers and wishes to build up to 300, the number of working days lost on the first day will be 200 and will then progressively reduce on subsequent days, eventually to zero when the new workforce reaches the target of 300.
Figures given for working days lost per 1,000 employees use employee jobs for each year taken from our most recent estimates of workforce jobs.
Number of stoppages
There are difficulties in ensuring complete recording of stoppages, in particular for short disputes lasting only a day or so, or involving only a few workers. Because of this recording difficulty and the cut-off applied, the number of working days lost is considered to be a better indicator of the impact of labour disputes than the number of recorded stoppages.
Workers involved
We aim to record the number of workers that are involved at any time in the stoppage. For example, consider a three-day strike where there were 200 workers involved on the first day; 300 on the second day, of whom 100 were involved for the first time; and 200 on the third day, of whom 50 were involved for the first time. The total number of workers involved in the dispute is 350 – the sum of all those involved on the first day and those joining for the first time on subsequent days.
However, the number of workers taking strike action for the first time during a dispute cannot always be easily ascertained. In such cases, the statistics record the highest number involved at any one time (300 in this example).
Take another example, where there are 200 workers involved in a stoppage on each of days one, two and three. It may be necessary to assume that there were a total of 200 workers involved, although it is possible, but unlikely, that as many as 600 workers could have been involved. For this reason, the statistics may under-estimate the number of workers involved in a dispute. However, the estimate of the number of working days lost is unaffected by this consideration.
Nôl i'r tabl cynnwys