1. Main points
The Professional, Scientific and Technical Activities industry section in London generated £40,832 million of Gross Value Added (GVA) in 2014, which was 11.2% of London’s total GVA, and 2.5% of the UK’s total GVA.
Professional, Scientific and Technical Activities was the largest sector in London in 2015 by both numbers of jobs, 765,000 or 13.7% of London employment, and numbers of workplaces, 108,960 or 21.8% of London’s workplaces.
Head offices and management consultancies have seen job levels increase in London by 266.2% (up 189,000 jobs) between 1996 and 2015, which accounted for over 1 in 9 (11.8%) of the increase in all jobs across London.
Average (median) hourly real earnings (excluding overtime) in Professional, Scientific and Technical Activities in London decreased by £2.63 per hour (down 11.6%) between 2008 and 2015, compared to a decrease of £1.72 per hour (down 9.8%) for London employees in general. This was calculated using national Consumer Prices Index figures, as data are not available at the London level.
Nôl i'r tabl cynnwys2. Introduction
The Professional, Scientific and Technical Activities industry section is a microcosm of London’s overall economy. The economic success of this section mirrors that of the city itself, the growth in jobs leading London’s overall job growth, and the section represents London’s highly qualified workforce. Professional, Scientific and Technical businesses are spread across the capital but are highly concentrated in the centre. Gross Value Added (GVA) figures indicate that in 2014, this industry section in London provided £40,832m of GVA, which was 11.2% of London’s total GVA, and 2.5% of the UK’s total GVA.
The industrial sectors analysed in this article are based upon1 the UK Standard Industrial Classification (SIC) 2007. Professional, Scientific and Technical Activities include a range of high-skilled and specialised activities, made up of the following industrial divisions:
legal and accounting activities
activities of head offices; management consultancy activities
architectural and engineering activities; technical testing and analysis
scientific research and development
advertising and market research
other Professional, Scientific and Technical Activities
veterinary activities
This analysis is part of a series of articles entitled Earning, Learning and Business Churning: revealing London's industrial economy, which analyse patterns of activity in industries in London. Data used in this analysis has been used to create the Economic Evidence Base by the Greater London Authority, which forms the economic basis of the Mayor of London’s London Plan. This article gives detail about a particular industrial sector, whereas the Economic Evidence Base provides a more comprehensive understanding of London’s economy.
Notes for Introduction
- To analyse London’s economy, we group industrial sections A, B, D and E to create the group “Primary and Utilities”, split section G into two parts: “Wholesale and motor trades”, which is the combination of industrial divisions 45 and 46, and “Retail”, which is division 47, and exclude sections T and U as they are too small to be analysed effectively.
3. Jobs in 2015
Professional, Scientific and Technical Activities represented the largest industrial sector in London in 2015, according to estimates from Workforce Jobs, as shown in Figure 1. The sector comprised 765,000 jobs, or 13.7% of all employment in the capital. The Professional, Scientific and Technical Activities sector has gone from strength to strength over the past 2 decades, where between 1996 and 2015 the number of jobs almost doubled from 399,000 to 765,000 jobs. This represents the highest percentage increase in jobs of any sector in London.
Figure 1: London jobs by industrial sector, 2015
Source: Workforce Jobs, Office for National Statistics
Notes:
- The industrial sectors presented are based upon the UK Standard Industrial Classification (SIC) 2007, except sections A, B, D and E have been combined to create new classification "Primary and Utilities".
Download this chart Figure 1: London jobs by industrial sector, 2015
Image .csv .xlsFigure 2 helps to colour this picture further. In 2009, Professional, Scientific and Technical Activities overtook the Wholesale, Retail and Motor Trades sector, and in doing so became the largest industry sector in London measured by number of jobs. Of additional note is the sector’s apparent resilience to the global financial crisis from 2008 onwards, with no strong decline in jobs in the years that followed.
Figure 2: London jobs in Professional, Scientific and Technical, and Wholesale, Retail and Motor Trades industry sectors, 1996 to 2015
Source: Workforce Jobs, Office for National Statistics
Download this chart Figure 2: London jobs in Professional, Scientific and Technical, and Wholesale, Retail and Motor Trades industry sectors, 1996 to 2015
Image .csv .xls4. Earnings
Jobs in Professional, Scientific and Technical Activities have clearly grown rapidly over the past 20 years. Data from the Annual Survey of Hours and Earnings (ASHE) enable us to see how well jobs in the sector in London pay.
Figure 3: Earnings in Professional, Scientific and Technical activities in London, 2015
Source: Annual Survey of Hours and Earnings (2015, provisional)
Notes:
- To aid in interpretation of this chart, the 50th percentile is the point below which 50% of workers in the income distribution lie, and represents average (median) earnings. The 90th percentile represents the top 10% earners, and the 10th percentile represents the lowest 10%.
Download this chart Figure 3: Earnings in Professional, Scientific and Technical activities in London, 2015
Image .csv .xlsAverage (median) hourly employee earnings (excluding overtime) in the section in London in 2015 were £20.15, compared to £15.74 for all industries across London (28% higher). This can be seen in Figure 3. Moreover, earnings in the sector are higher than the London average for all income percentiles; as such, jobs in the section are comparatively well paid. In fact, only 5.6% of employees in Professional, Scientific and Technical Activities in 2015 were earning below the London Living Wage1, which was £9.15 at the time ASHE was collected. However, it must be noted that data for 2015 are provisional, and are subject to revision.
The picture of earnings over time is less positive than that of a snapshot of earnings in 2015, with real earnings in the sector in decline. Average (median) hourly real earnings (excluding overtime) in Professional, Scientific and Technical Activities in London decreased by £2.63 per hour (down 11.6%) between 2008 and 2015, compared to a decrease of £1.72 per hour (down 9.8%) for London employees in general, as shown in Figure 4. National Consumer Prices Index figures have been used to adjust for inflation, as data are not available at the London level, although the impact of inflation may differ in the London region compared to national figures. After taking national price levels into account, earnings in the sector – and for London’s employees in general – have in fact been falling.
Figure 4: Real earnings in Professional, Scientific and Technical activities in London, 2008 to 2015
Source: Annual Survey of Hours and Earnings (2008-2014 revised, 2015 provisional), Consumer Prices Index
Notes:
- Earnings have been adjusted for inflation using national-level Consumer Prices Index figures, as no regional-level figures are available. This adjustment accounts for changes in prices over time, assuming London workers experience similar levels of inflation to the national level.
- To aid in interpretation of the chart, the 50th percentile is the point below which 50% of workers in the income distribution lie, and represents average (median) earnings. The 75th percentile represents the top 25% of earners, and the 25th percentile represents the lowest 25% of earners.
Download this chart Figure 4: Real earnings in Professional, Scientific and Technical activities in London, 2008 to 2015
Image .csv .xlsWe can see in Figure 5 that between 2008 and 2015, the hourly real earnings (excluding overtime) of women in Professional, Scientific and Technical Activities in London have declined by £1.77 per hour, or 9.0%, but not as much as the same figures for men in the section in London, which fell by £5.67 per hour, or 20.3%. As such, the gross difference in male and female earnings in this sector in London has been shrinking over time.
Figure 5: Differences in real pay between men and women in Professional, Scientific and Technical Activities, London, 2008 to 2015
Source: Annual Survey of Hours and Earnings (2008-2014 revised, 2015 provisional)
Notes:
- Earnings have been adjusted for inflation using national-level Consumer Price Index figures, as no regional-level figures are available. This adjustment accounts for changes in prices over time, assuming London workers experience similar levels of inflation to the national level.
- The lines show earnings by sex, and the bars at the bottom show the gross difference between male and female earnings.
Download this chart Figure 5: Differences in real pay between men and women in Professional, Scientific and Technical Activities, London, 2008 to 2015
Image .csv .xlsWe can also look at the gender pay gap2 in Figure 6. There is no single measure that adequately deals with the complex issue of the differences between men’s and women’s pay, issues including differences in occupations, working patterns and age distributions. We have calculated the gender pay gap using the same methodology as explained in Annual Survey of Hours and Earnings: 2015 Provisional Results, using median hourly earnings (excluding overtime), and it should be noted that the figures do not show differences in rates of pay for comparable jobs.
Figure 6: Gender pay gap in London and the UK, with a breakdown of Professional, Scientific and Technical activities, 2008 to 2015
Source: Annual Survey of Hours and Earnings (2008-2014 revised, 2015 provisional)
Notes:
- The gender pay gap refers to the percentage difference between male and female hourly earnings, using the calculation: 100 – (female hourly pay / male hourly pay) x 100. This is a basic comparison and does not show differences in rates of pay for comparable jobs.
Download this chart Figure 6: Gender pay gap in London and the UK, with a breakdown of Professional, Scientific and Technical activities, 2008 to 2015
Image .csv .xlsThe gender pay gap in Professional, Scientific and Technical Activities in London has been declining faster than the overall pay gap in London and the UK more widely, as shown in Figure 6. For the section in London, the gender pay gap has shrunk by 10.0 percentage points between 2008 and 2015; the UK gender pay gap shrank by 3.3 percentage points, and the London gender pay gap shrank by 3.0 percentage points. The provisional data for 2015 indicate that male earnings have increased relative to female earnings, and this may have resulted in the gender pay gap increasing; however, it must be stressed that data for 2015 are provisional only, and are subject to revision.
Notes for Earnings
Estimates of proportions of employees earning below minimum wage rates are calculated using the methodology recommended calculating estimates of low pay.
The gender pay gap refers to the percentage difference between male and female hourly earnings. The calculation is: 100 – (female hourly pay / male hourly pay) x 100.
5. Locating London’s Professional, Scientific and Technical jobs
Figure 7 maps out employees in the Professional, Scientific and Technical Activities industry using data from the Inter-Departmental Business Register. Data were available for the whole section excluding head office and management consultancy activities, and then for head office and management consultancy activities separately.
The section excluding head office and management consultancies is reflective of London, with jobs clustering around the centre. It should however be noted that there are pockets of jobs dispersed across the capital too; for example, there are areas with 1,000 to 24,000 employees per square kilometre in Harrow, Croydon and Richmond upon Thames.
Figure 7: Number of employees (per square kilometre) in Professional, Scientific and Technical Activities (excluding head office and management consultancy activities) in London MSOAs, 2015

Source: Inter-Departmental Business Register
Notes:
MSOA denotes Middle-layer Super Output Area, a geography used for the analysis of small area statistics. Areas of the lightest colour have been suppressed to protect confidentiality.
Contains National Statistics data © Crown copyright and database right 2016.
Contains Ordnance Survey data © Crown copyright and database right 2016.
Download this image Figure 7: Number of employees (per square kilometre) in Professional, Scientific and Technical Activities (excluding head office and management consultancy activities) in London MSOAs, 2015
.png (126.3 kB)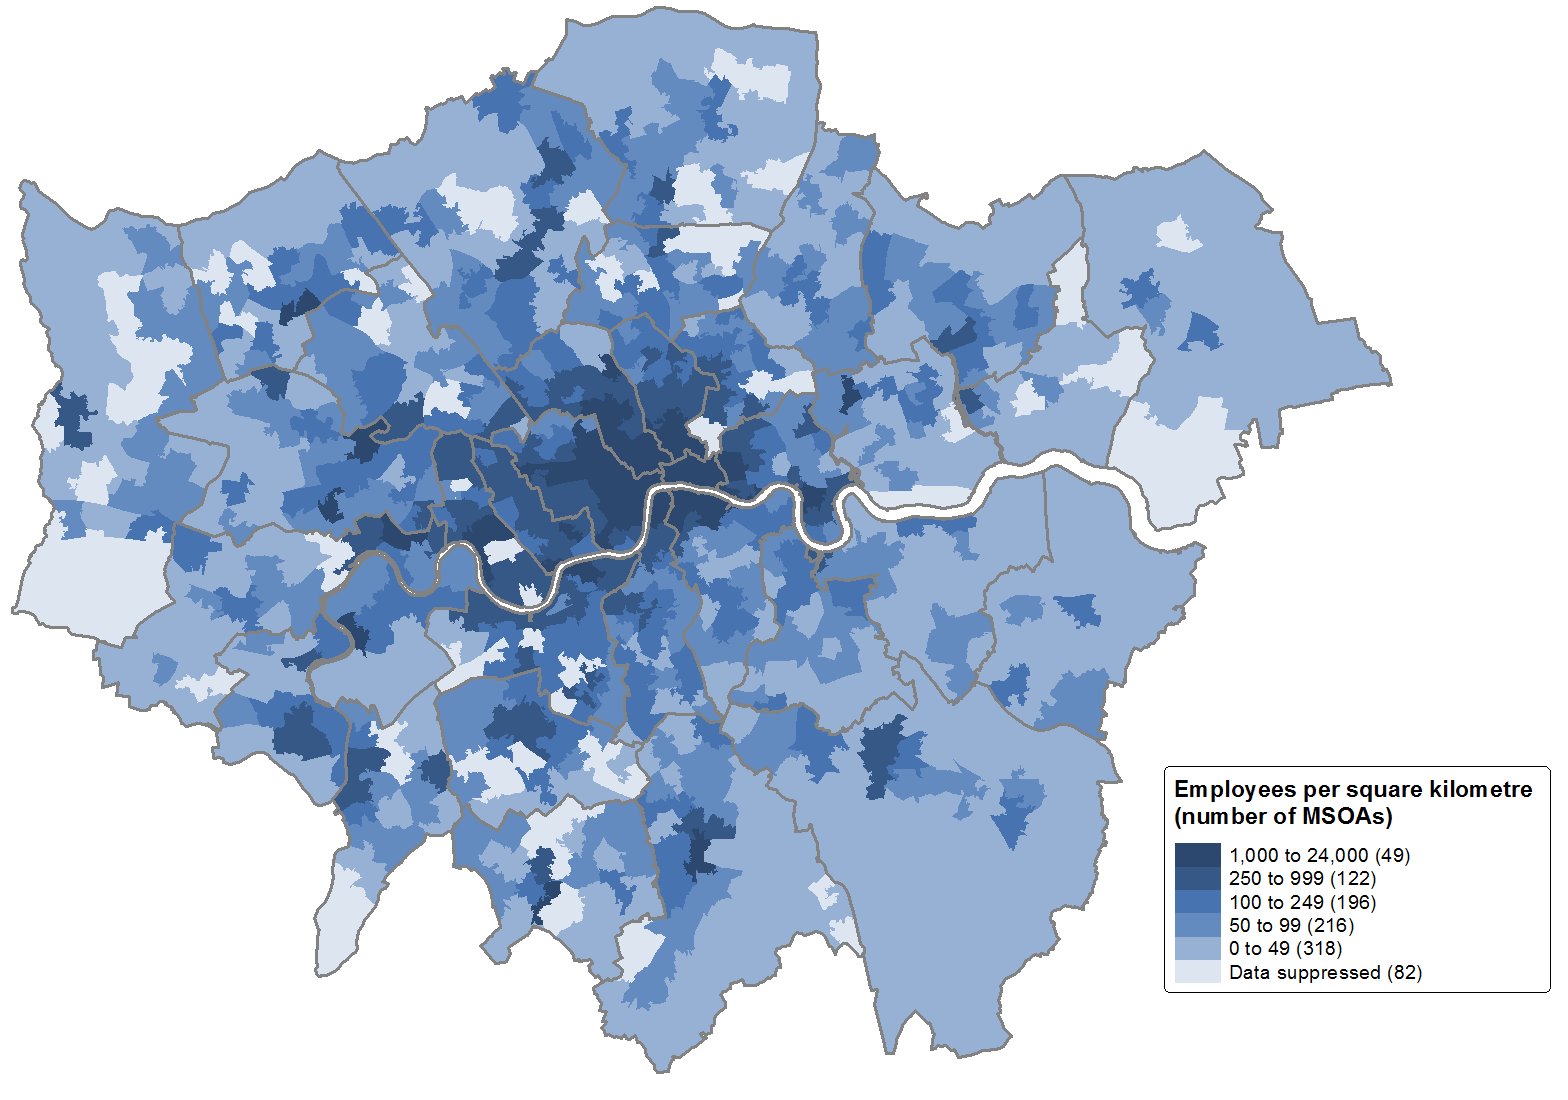
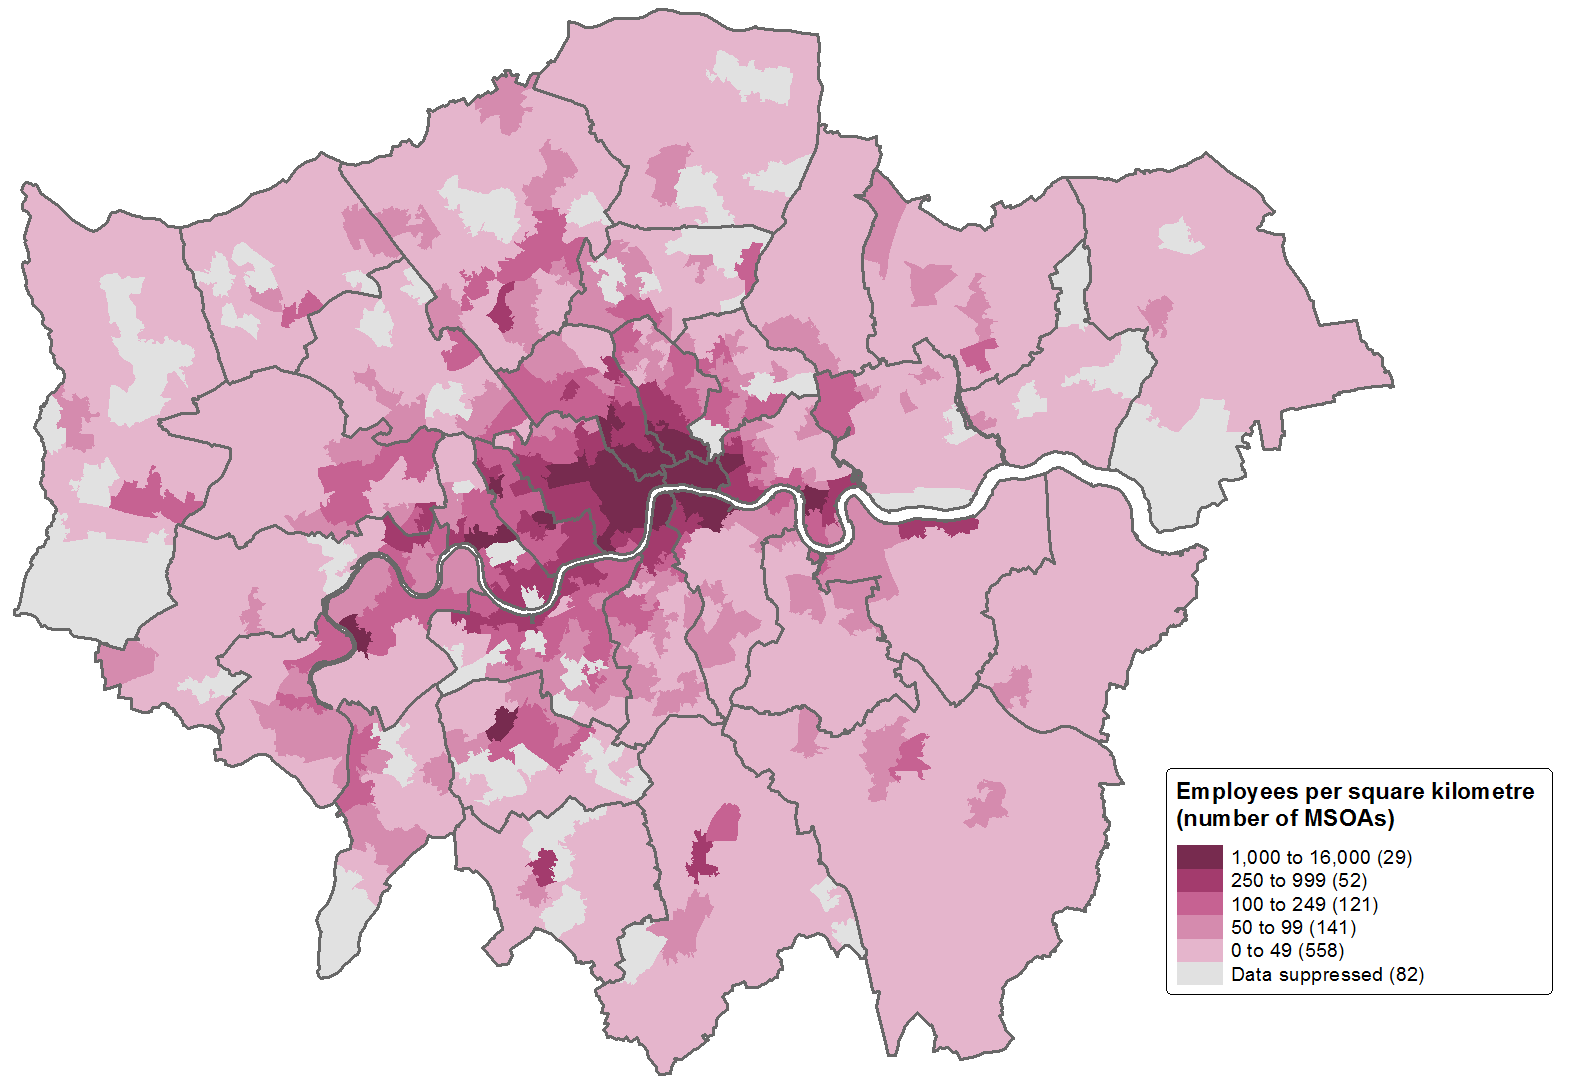
Figure 8 maps head office and management consultancy activities to paint a slightly different picture, with high concentration in the centre. This makes intuitive sense, given that the broader Professional, Scientific and Technical sector contains accounting and legal activities, many of which one would expect to be located in high streets outside of the centre. Head offices, on the other hand, will tend to want to be in the centre, with optimal access to commuter routes, the prestige of central London and the potential benefits of agglomerating amongst other businesses.
Figure 8: Number of employees (per square kilometre) in head office and management consultancy activities in London MSOAs, 2015
Source: Inter-Departmental Business Register
Notes:
MSOA denotes Middle-layer Super Output Area, a geography used for the analysis of small area statistics. Areas of the lightest colour have been suppressed to protect confidentiality.
Contains National Statistics data © Crown copyright and database right 2016.
Contains Ordnance Survey data © Crown copyright and database right 2016.
Download this image Figure 8: Number of employees (per square kilometre) in head office and management consultancy activities in London MSOAs, 2015
.png (107.6 kB)
6. Workplaces and who works in them
The current strength of Professional, Scientific and Technical Activities in London is evidenced by its very high number of workplaces1, as shown again in the Inter-Departmental Business Register data in Figure 9. As of 2015, the section featured 108,960 workplaces across the capital, comprising just over 1 in 5 (21.8%) of all workplaces in the city.
Figure 9: Number of workplaces in London by industry sector, 2015
Source: Inter-Departmental Business Register
Notes:
The industrial sectors presented are based upon the UK Standard Industrial Classification (SIC) 2007, except sections A, B, D and E have been combined to create new classification "Primary and Utilities", and section G has been split as: divisions 45 and 46 combined to become “Wholesale and motor trades” and division 47 forms “Retail”.
In 2015, the IDBR extended the coverage of businesses to include a population of solely PAYE-based businesses that were previously excluded because of a risk of duplication. At UK level, 105,000 businesses have been added in 2015. A more detailed note explaining these changes can be found on our website.
Download this chart Figure 9: Number of workplaces in London by industry sector, 2015
Image .csv .xlsAs we saw with the number of jobs in the section, the number of workplaces has also grown rapidly over the past 15 years. This is shown in Figure 10. Between 2001 and 2015, the number of Professional, Scientific and Technical workplaces nearly doubled, from 55,530 to 108,960. Of particular note is that 94.3% of this change is accounted for by change in small enterprises – those with 0 to 9 employees – which saw its numbers of workplaces in London increase from 49,715 to 100,095.
Figure 10: Number of workplaces in London in selected industry sections, 2001 to 2015
Source: Inter-Departmental Business Register
Notes:
- Information and Communication is shown as it is the second largest industry section in London terms of workplaces in 2015.
- An increase in numbers of workplaces (and employees) between 2011 and 2012 should be treated with caution. At UK level, nearly half of the increase (31,000 of 68,000 enterprises) was attributable to improvements to HM Revenue and Customs computer systems leading to previously excluded businesses being added to the IDBR.
- In 2015, the IDBR extended the coverage of businesses to include a population of solely PAYE-based businesses that were previously excluded because of a risk of duplication. At UK level, 105,000 businesses have been added in 2015. A more detailed note explaining these changes can be found on our website.
Download this chart Figure 10: Number of workplaces in London in selected industry sections, 2001 to 2015
Image .csv .xlsData from the Annual Population Survey provide us with insight on workforce characteristics, as shown in Figure 11. The Professional, Scientific and Technical workforce represents London’s economic strengths in terms of its skill levels; just less than three-quarters (73.4%) of jobs in the section in 2015 were held by those who are degree-educated, compared to just short of half (47.8%) for all other industries in London.
Figure 11: Professional, Scientific and Technical jobs by highest qualification of job-holder, London 2015
Source: Annual Population Survey
Notes:
- The highest educational qualifications follow the standard ONS categories, except the top category "Degree or equivalent" has been split to show "Higher degree" and "Ordinary degree or equivalent" separately. Further information on these categories is available in the Labour Force Survey (LFS) User Guide.
Download this chart Figure 11: Professional, Scientific and Technical jobs by highest qualification of job-holder, London 2015
Image .csv .xlsNotes for Workplaces and who works in them
- Workplaces are referred to as “local units” in the Inter-Departmental Business Register.
7. Taking a closer look
This article has so far considered the Professional, Scientific and Technical section as a whole; the remainder of the article will investigate its constituent divisions:
legal and accounting activities
activities of head offices; management consultancy activities
architectural and engineering activities; technical testing and analysis
scientific research and development
advertising and market research
other Professional, Scientific and Technical Activities
veterinary activities
Workforce Jobs data in Figure 12 show that the division that performed particularly strongly between 1996 and 2015 is that of head offices and management consultancies, seeing job levels increase by a striking percentage of 266.2% (189,000 jobs), compared to increases for the section as a whole of 91.7% (366,000 jobs). Indeed, as of 2015, jobs in head office and management consultancies accounted for just over one third (34.0%) of all jobs in its section. The increase in jobs in head office and management consultancies over this period accounted for just over half (51.6%) of in the increase in jobs in Professional, Scientific and Technical Activities, and over 1 in 9 (11.8%) of the increase in all jobs across London.
Legal and accounting activities have also seen strong growth, accounting for 20.0% of the increase in jobs in its parent section between 1996 and 2015, and just over 4.5% of the increase in jobs in London as a whole. This is shown in Figure 12.
Figure 12: Jobs in London by Professional, Scientific and Technical divisions, 1996 to 2015
Source: Workforce Jobs, Office for National Statistics
Notes:
- Industrial divisions Veterinary activities and Other Professional, Scientific and Technical Activities have been combined to enable statistical analysis for London.
Download this chart Figure 12: Jobs in London by Professional, Scientific and Technical divisions, 1996 to 2015
Image .csv .xlsAnnual Population Survey data looking at the workforce in each division can also be quite telling; for example, the gender balance in terms of employment exhibits much variation between divisions, even though the section as a whole bears close resemblance to London’s workforce in general. Figure 13 depicts this information, with only 30.8% of jobs in the “architecture and engineering; technical testing and analysis” division held by women.
Figure 13: Jobs in divisions of Professional, Scientific and Technical Activities by sex of job-holder, London, 2015
Source: Annual Population Survey
Notes:
- Industrial divisions Scientific research and development; Veterinary activities; and Other Professional, Scientific and Technical Activities have been combined to enable statistical analysis for London.
Download this chart Figure 13: Jobs in divisions of Professional, Scientific and Technical Activities by sex of job-holder, London, 2015
Image .csv .xlsThere is also much variation between divisions in levels of self-employment, as can be seen in Figure 14. The percentage of self-employed jobs in the Professional, Scientific and Technical Activities section as a whole is 26.5%, compared to 18.0% for London overall. However, there is marked divisional variation, with 42.5% of jobs being self-employed in the combination of divisions scientific research and development; veterinary activities; and other Professional, Scientific and Technical Activities.
Figure 14: Self-employed jobs as a percentage of all jobs in Professional, Scientific and Technical Activities in London, 2015
Source: Annual Population Survey
Notes:
Industrial divisions Scientific research and development; Veterinary activities; and Other Professional, Scientific and Technical Activities have been combined to enable statistical analysis for London.