1. Main points
The Accommodation and Food Service Activities industry grew rapidly in London between 1996 and 2015 – by 163,000 jobs (79%). This section had the third highest percentage growth of all industry sectors in London over this period.
Food and Beverage Service Activities accounted for 82% of the 163,000 section-level increase in jobs in London between 1996 and 2015. Moreover, the Food and Beverage Service Activities division has consistently been larger than the Accommodation division in London, comprising 4 in 5 jobs in the section in any year over the period 1996 to 2015.
69.5% of jobs in Accommodation and Food Service Activities in London were held by job-holders born outside of the UK or British Overseas Territories in 2015. For Accommodation the figure is 79.8% and for Food and Beverage Service Activities it is 67.0%.
One-quarter of those employed in Accommodation and Food Service Activities in London in 2015 held a degree or higher degree and a further quarter held either foreign or vocational qualifications.
The average (median) hourly wage (excluding overtime) in Food and Beverage Service Activities was £1.41 less than the £9.15 London Living Wage in place at the time of survey in 2015. For Accommodation, the average hourly wage was 14 pence less than the London Living Wage. In Accommodation and Food Service Activities as a whole, more than two-thirds (67.5%) of employee jobs in were earning below the London Living Wage in 2015.
Nôl i'r tabl cynnwys2. Introduction
This article examines the characteristics of the Accommodation and Food Service Activities industry section in London. Gross Value Added (GVA) data indicate that this section in London was worth £10,952 million in 2014, which was 3.0% of London’s GVA and 0.7% of the UK’s GVA. This article paints a picture of an industry section that has performed reasonably well in relation to others in London and which features a workforce that stands out in a number of ways, most notably in its low levels of pay.
The industrial sectors analysed in this article are based upon the UK Standard Industrial Classification (SIC) 2007 and the Accommodation and Food Service Activities section can be broken down as follows:
Accommodation
- Hotels and similar accommodation
- Holiday and other short-stay accommodation
- Camping grounds, recreational vehicle parks and trailer parks
- Other accommodation
Food and Beverage Service Activities
- Restaurants and mobile food service activities
- Event catering and other food service activities
- Beverage serving activities
This industry section includes the provision of short-term accommodation for tourists and the provision of meals and drinks fit for immediate consumption, but excludes long-term accommodation (covered under Real Estate) and the preparation of food and drink not fit for immediate consumption (covered by Manufacturing). Because of the structure of London’s economy we group industrial sections A, B, D and E to create the group “Primary and Utilities” and split section G into 2 parts: “Wholesale and motor trades”, which is the combination of industrial divisions 45 and 46 and “Retail”, which is division 47. We typically exclude sections T and U from the analysis as they are too small in London to analyse effectively.
This analysis is part of a series of articles entitled Earning, Learning and Business Churning: revealing London's industrial economy, which analyse patterns of activity in industries in London. Data used in this analysis has been used to create the Economic Evidence Base by the Greater London Authority, which forms the economic basis of the Mayor of London’s London Plan. This article gives detail about a particular industrial sector, whereas the Economic Evidence Base provides a more comprehensive understanding of London’s economy.
Nôl i'r tabl cynnwys3. Who works in Accommodation and Food Services?
Based upon estimates from Workforce Jobs data, there were 369,000 jobs in Accommodation and Food Service Activities in London in 2015, which comprised 7% of London’s total employment. The section grew rapidly in London between 1996 and 2015 – by 163,000 jobs – as shown in Figure 1. In terms of percentage change in jobs, Accommodation and Food Service Activities was the third strongest performing sector1 in London over this period, with numbers of jobs increasing by 79%.
Figure 1: Number of jobs in Accommodation and Food Service Activities and selected industry sections in London, 1996 to 2015
Source: Office for National Statistics – Workforce Jobs estimates
Notes:
- The sectors of highest growth (Professional, Scientific and Technical Activities) and lowest growth (Manufacturing) in London are also shown to give context.
Download this chart Figure 1: Number of jobs in Accommodation and Food Service Activities and selected industry sections in London, 1996 to 2015
Image .csv .xls
Figure 2: Number of jobs in Accommodation, and Food and Beverage Service Activities, in London, 1996 to 2015
Source: Office for National Statistics – Workforce Jobs estimates
Download this chart Figure 2: Number of jobs in Accommodation, and Food and Beverage Service Activities, in London, 1996 to 2015
Image .csv .xlsBreaking the section down to its Accommodation and Food and Beverage Service Activities divisions can add detail, as illustrated in Figure 2. The Food and Beverage Service Activities division has seen higher jobs growth than Accommodation, whereby Food and Beverage Service Activities accounted for 82% of the 163,000 section-level positive change in jobs in London between 1996 and 2015. Moreover, Food and Beverage Service Activities have consistently been by far the larger of the 2 divisions in London, comprising no fewer than 4 in 5 jobs in the section in any year over the period 1996 to 2015.
Figure 3: Working patterns in Accommodation and Food Service Activities in London, 2015
Total jobs: 369,000
Source: Office for National Statistics – Workforce Jobs and Annual Population Survey
Download this chart Figure 3: Working patterns in Accommodation and Food Service Activities in London, 2015
Image .csv .xlsAnnual Population Survey data help to highlight the various ways in which the Accommodation and Food Service Activities workforce stands out in relation to other industries in London. A relatively large proportion of jobs in Accommodation and Food Service Activities were part-time in 2015, standing at 35.5% of employment in the section in London. This compares with 24.4% for all industries across London. A more nuanced look at the data reveals that it is the Food and Beverage Service Activities division of the section, rather than the Accommodation division, behind this difference. Of the jobs in Food and Beverage Service Activities, 40.2% were part-time, compared with only 15.8% in Accommodation, in London in 2015. This can be seen in Figure 4.
Figure 4: Working patterns in the divisions of Accommodation and Food Service Activities in London, 2015
Source: Office for National Statistics – Annual Population Survey
Download this chart Figure 4: Working patterns in the divisions of Accommodation and Food Service Activities in London, 2015
Image .csv .xlsAge is another way in which the section stands out in relation to other industries in London, especially in Food and Beverage Service Activities. Almost a quarter (23.8%) of jobs in this division were held by workers aged 16 to 24 in London in 2015, as shown in Figure 5. The workforce is generally younger than that of Accommodation and other industries. For the section as a whole, more than 1 in 5 jobs (21.4%) were held by workers aged 16 to 24.
Figure 5: Accommodation and Food Service Activities jobs in London by age of job-holder, 2015
Source: Office for National Statistics – Annual Population Survey
Download this chart Figure 5: Accommodation and Food Service Activities jobs in London by age of job-holder, 2015
Image .csv .xlsFigure 6 shows that 69.5% of the jobs in Accommodation and Food Service Activities in London in 2015 were held by job-holders born outside of the UK or British Overseas Territories2. For Accommodation the figure is 79.8% and for Food and Beverage Service Activities it is 67.0%. This compares with a figure for all industries in London of 38.7%.
Figure 6: Accommodation and Food Service Activities jobs by country of birth of job-holder, London 2015
Source: Office for National Statistics – Annual Population Survey
Notes:
- The British Overseas Territories include: Anguilla, Bermuda, the British Indian Ocean Territory, the British Virgin Islands, the Cayman Islands, the Falkland Islands, South Georgia, Gibraltar, Montserrat, the Pitcairn Islands, Saint Helena, the South Sandwich Islands and the Turks and Caicos Islands.
- The European Economic Area (EEA) includes: Austria, Belgium, Bulgaria, Cyprus, the Czech Republic, Denmark, Estonia, Finland, France, Germany, Greece, Hungary, Iceland, the Republic of Ireland, Italy, Latvia, Liechtenstein, Lithuania, Luxembourg, Malta, the Netherlands, Norway, Poland, Portugal, Romania, Slovakia, Slovenia, Spain, Sweden and the UK. The EEA specifically excludes: Andorra, Monaco, San Marino and Vatican City. Although Iceland, Liechtenstein and Norway are not members of the European Union (EU), their citizens have the same rights as EU citizens to enter, live in and work in the UK
Download this chart Figure 6: Accommodation and Food Service Activities jobs by country of birth of job-holder, London 2015
Image .csv .xlsHalf of the jobs in the section were classified as elementary occupations, according to the Standard Occupational Classification 2010. These occupations involve mainly routine tasks that rarely require formal educational training. As such, we would expect the workforce to hold fewer qualifications than other industries. This is, to some extent, true, as Figure 7 shows. However, the difference is not as stark as we might expect; one-quarter of those employed in the section held a degree or higher degree. In addition, one-quarter of those employed in the section hold “other qualifications”, which includes foreign and vocational qualifications.
Figure 7: Accommodation and Food Service Activities jobs in London by highest qualification of job-holder, 2015
Source: Office for National Statistics – Annual Population Survey
Notes:
- The highest educational qualifications follow the standard ONS categories, except the top category "Degree or equivalent" has been split to show "Higher degree" and "Ordinary degree or equivalent" separately. Further information on these categories is available in the Labour Force Survey User Guide.
Download this chart Figure 7: Accommodation and Food Service Activities jobs in London by highest qualification of job-holder, 2015
Image .csv .xlsOverall, Annual Population Survey data indicate that in 2015 the Accommodation and Food Service Activities workforce in London was younger, more likely to be working part-time and more likely to have been born overseas, compared to other industries in London. It is difficult to say why a sizeable proportion of workers in this section are quite well-educated, but several theories include:
- a large proportion of jobs are held by young people with qualifications, who are working in the sector temporarily before moving on to roles that require higher qualifications
- a large proportion of jobs are held by immigrants with qualifications that are not recognised in the UK; there is some evidence for this given that a quarter of jobs are held by those with “other qualifications”
- London generally attracts high-skilled individuals and there is increased competition for highly qualified jobs
These ideas are not mutually exclusive and there may of course be other theories which explain why there are many individuals working in the section that are well-educated. However, it should be stressed that these are just theories, and would need to be tested more rigorously.
Notes for Who works in Accommodation and Food Services?
As explained in the introduction, industrial sections A, B, D and E are combined into one industrial grouping, section G is split into 2 sectors, and sections T and U are excluded, meaning we typically analyse 17 industrial sectors of London’s economy.
The British Overseas Territories include: Anguilla, Bermuda, the British Indian Ocean Territory, the British Virgin Islands, the Cayman Islands, the Falkland Islands, South Georgia, Gibraltar, Montserrat, the Pitcairn Islands, Saint Helena, the South Sandwich Islands and the Turks and Caicos Islands.
4. Earning a living
Data from the Annual Survey of Hours and Earnings (ASHE) enable us to look at the earnings of the section in London. As shown in Figure 8, average (median) hourly earnings (excluding overtime) in London in 2015 were £9.01 per hour for Accommodation and £7.74 for Food and Beverage Service Activities. This compares to an average of £15.74 for all industries in London. Average pay for Accommodation was therefore 57% of the average for all industries in London. In Food and Beverage Service Activities, average pay was just under half (49%) of the overall average in London. It must be noted that data for 2015 are provisional and are subject to revision.
Figure 8: Average (median) nominal earnings in Accommodation and Food Service Activities, and all industries, London, 2009 to 2015
Source: Office for National Statistics – Annual Survey of Hours and Earnings (2009-2014 revised, 2015 provisional) and Living Wage Foundation
Notes:
- Figures shown are nominal earnings, and thus do not take into account changes in prices over time.
- Further information on the London Living Wage
Download this chart Figure 8: Average (median) nominal earnings in Accommodation and Food Service Activities, and all industries, London, 2009 to 2015
Image .csv .xlsThe average (median) wage in Food and Beverage Service Activities is consistently less than the London Living Wage across the period 2009 to 2015; the gap between the 2 grew from 68 pence in 2009 to £1.41 in 2015. To be clear, the London Living Wage is an hourly rate of pay calculated by the Greater London Authority which “gives the wage rate needed to give a worker in London enough to provide their family with the essentials of life, including a cushion against unforeseen events”1. For Accommodation, average (median) earnings have hovered around the London Living Wage for the period and as of 2015, was 14 pence less than it. In 2015, more than two-thirds (67.5%) of employee jobs in Accommodation and Food Service Activities were earning below the London Living Wage2, which was £9.15 at the time ASHE was collected. This sector had the highest percentage of employees earning below the London Living Wage of all sectors in London in both 2014 and 2015. Once again, it must be stressed that data for 2015 are provisional, and are subject to revision.
Figure 9 breaks the aforementioned earnings data down by sex, looking at the gender pay gap3. There is no single measure that adequately deals with the complex issue of the differences between men’s and women’s pay, issues including differences in occupations, working patterns and age distributions. We have calculated the gender pay gap using the same methodology as explained in Annual Survey of Hours and Earnings: 2015 Provisional Results, using median hourly earnings (excluding overtime) and it should be noted that the figures do not show differences in rates of pay for comparable jobs.
There is a gender pay gap in the industry section in London, which is larger in Accommodation than for Food and Beverage Service Activities; however, for both, the gap appears to be gradually shrinking. From 2011 onwards, the gender pay gap has been smaller in both divisions in London than the average of all London industries.
Figure 9: Gender pay gap in Accommodation and Food Service Activities in London, 2009 to 2015
Source: Office for National Statistics – Annual Survey of Hours and Earnings (2009 to 2014 revised, 2015 provisional)
Notes:
- The gender pay gap refers to the percentage difference between male and female hourly earnings, using the calculation: 100 – (female hourly pay / male hourly pay) x 100. This is a basic comparison and does not show differences in rates of pay for comparable jobs.
Download this chart Figure 9: Gender pay gap in Accommodation and Food Service Activities in London, 2009 to 2015
Image .csv .xlsNotes for Earning a living
Quote from London living wage.
Estimates of proportions of employees earning below minimum wage rates are calculated using the methodology recommended calculating estimates of low pay.
The gender pay gap refers to the percentage difference between male and female hourly earnings. The calculation is: 100 – (female hourly pay / male hourly pay) x 100.
5. Locating employees in Accommodation and Food Services
Finally, we look at the distribution of employees across London with data from the Inter-Departmental Business Register, as shown in Figure 10. Employment in this industry tends to cluster in the centre of London, although there are pockets of jobs all over the capital, including a large cluster of jobs around the Heathrow area on the western edge of the map.
Figure 10: Number of employees (per square kilometre) in Accommodation and Food Service Activities in London MSOAs, 2015
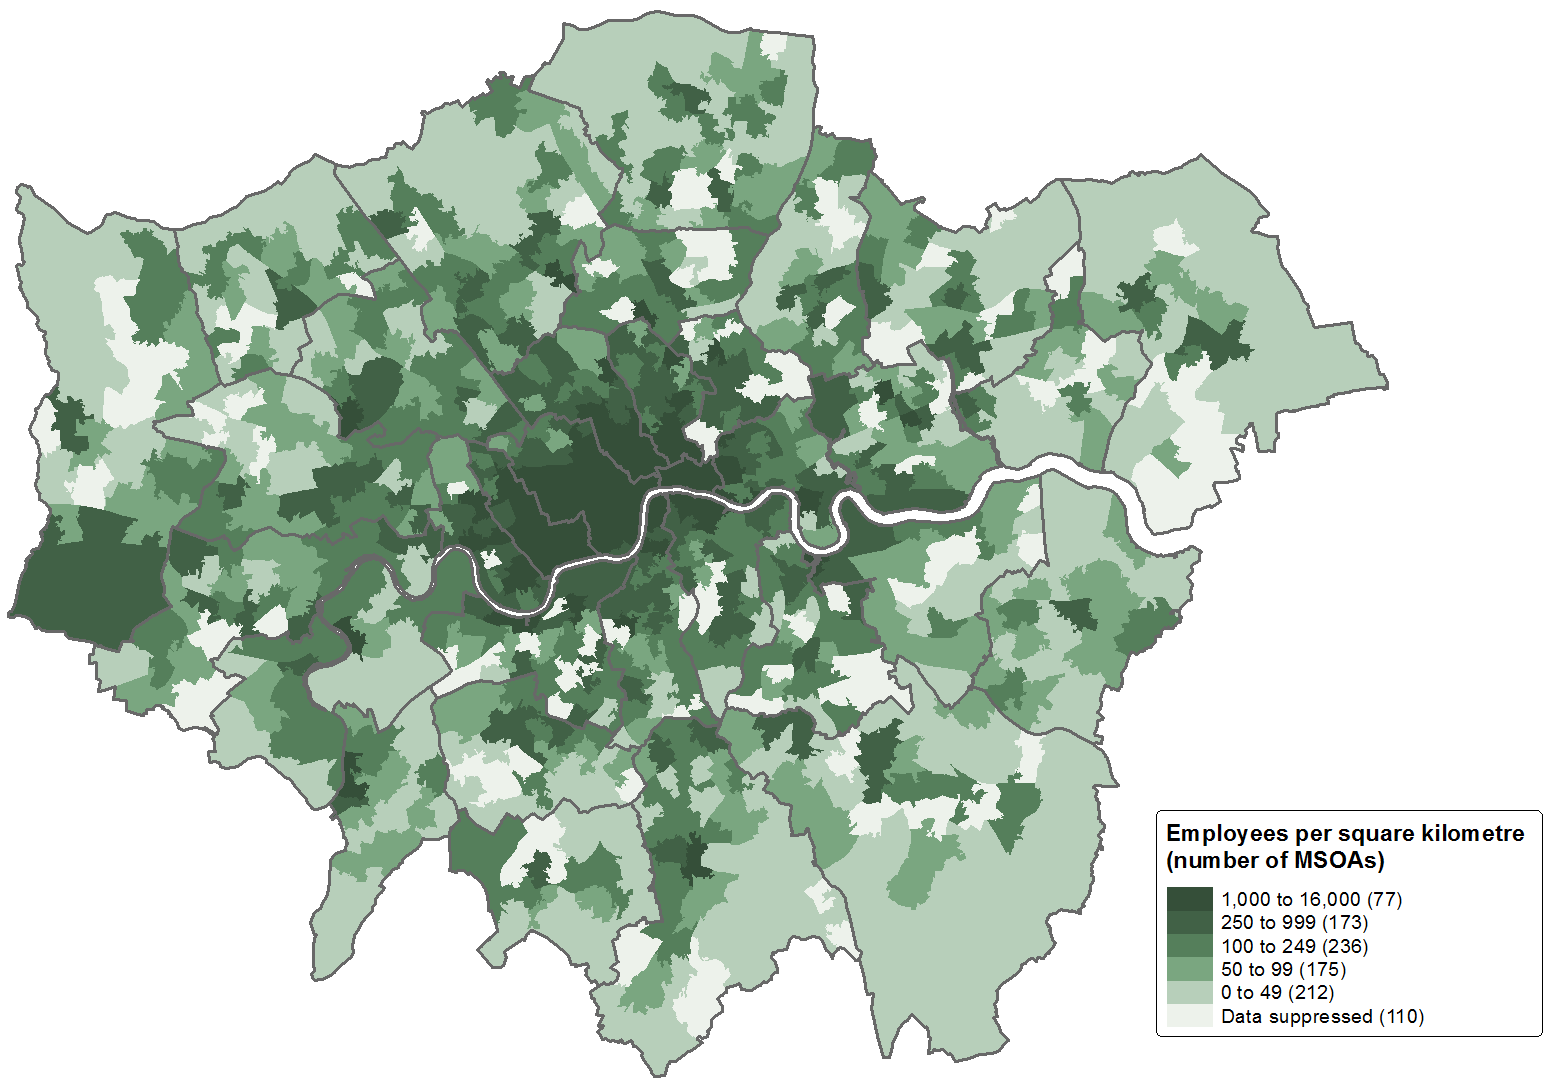
Source: Office for National Statistics – Inter-Departmental Business Register (IDBR)
Notes:
- MSOA denotes Middle-layer Super Output Area, a geography used for the analysis of small area statistics.
- Contains National Statistics data © Crown copyright and database right 2016
- Contains Ordnance Survey data © Crown copyright and database right 2016