1. Other pages in this release
2. Main points for October to December 2020
October to December 2020 estimates show the unemployment rate continued to increase, while the employment rate continued to fall.
Although total hours worked continued to increase from the low levels in the previous quarter, this increase slowed in the latest quarter.
The UK employment rate was estimated at 75.0%, 1.5 percentage points lower than a year earlier and 0.3 percentage points lower than the previous quarter.
The UK unemployment rate was estimated at 5.1%, 1.3 percentage points higher than a year earlier and 0.4 percentage points higher than the previous quarter.
The UK economic inactivity rate was estimated at 20.9%, 0.4 percentage points higher than a year earlier but largely unchanged compared with the previous quarter.
The total number of weekly hours worked was 978.7 million, down 71.4 million hours on the same period the previous year but up 53.7 million hours compared with the previous quarter.
The redundancy rate for the latest quarter was estimated at 12.3 people per thousand employees.
4. Employment
Figure 1: The employment rate for all people decreased by 1.5 percentage points on the year, and decreased by 0.3 percentage points on the quarter, to 75.0%
UK employment rates (aged 16 to 64 years), seasonally adjusted, between January to March 1971 and October to December 2020
Source: Office for National Statistics – Labour Force Survey
Download this chart Figure 1: The employment rate for all people decreased by 1.5 percentage points on the year, and decreased by 0.3 percentage points on the quarter, to 75.0%
Image .csv .xlsEmployment measures the number of people aged 16 years and over in paid work and those who had a job that they were temporarily away from. The employment rate is the proportion of people aged between 16 and 64 years who are in employment.
The International Labour Organization (ILO) definition of employment includes those who worked in a job for at least one hour and those temporarily absent from a job. Workers furloughed under the Coronavirus Job Retention Scheme or who are self-employed but temporarily not in work have a reasonable expectation of returning to their jobs after a temporary period of absence. Therefore, they are classified as employed under the ILO definition.
The estimated employment rate for people aged between 16 and 64 years had generally been increasing since early 2012, largely driven by an increase in the employment rate for women. However, there has been a decrease since December 2019 to February 2020, coinciding with the start of the coronavirus (COVID-19) pandemic (Figure 1).
For people aged between 16 and 64 years, for October to December 2020:
the estimated employment rate for all people was 75.0%; this is 1.5 percentage points down on the same period the previous year and 0.3 percentage points down compared with the previous quarter (July to September 2020)
the estimated employment rate for men was 78.2%; this is 2.4 percentage points down on the same period the previous year and 0.4 percentage points down on the quarter
the estimated employment rate for women was 71.8%; this is 0.6 percentage points down on the same period the previous year and 0.1 percentage points down on the quarter
The annual decrease in the employment rate was the largest since January to March 2010, with the rate dropping to its lowest level since July to September 2017.
The single-month and weekly estimates of the employment rate suggest that the rate was lower towards the end of the three-month period.
The increase in the employment rate for women in recent years is partly a result of changes to the State Pension age for women, resulting in fewer women retiring between the ages of 60 and 65 years. However, since the equalisation of the State Pension age, the employment rate for women had continued to rise, though it has now decreased because of the impact of the coronavirus (COVID-19) pandemic.
Imputation used for the Labour Force Survey (LFS) was not designed to deal with the changes experienced in the labour market in recent months. Experimental work with adjusted methodology suggests the use of the existing methodology has little impact on the employment rate (less than 0.2 percentage points). Further information can be found in the section on Measuring the data.
Estimates for October to December 2020 show 32.39 million people aged 16 years and over in employment, 541,000 fewer than a year earlier. This was the largest annual decrease since May to July 2009 and was mainly driven by men. However, there was also an annual decrease for women; only the second since January to March 2012.
More about economy, business and jobs
- All ONS analysis, summarised in our economy, business and jobs roundup.
- Explore the latest trends in employment, prices and trade in our economic dashboard.
- View all economic data.
Age group
Figure 2: There has been a large decrease in employment for people aged 16 to 24 years over the last year
UK employment rate by age (16 years and over), seasonally adjusted, cumulative growth from October to December 2019, for each period up to October to December 2020
Source: Office for National Statistics – Labour Force Survey
Download this chart Figure 2: There has been a large decrease in employment for people aged 16 to 24 years over the last year
Image .csv .xlsLooking more closely at the change in employment over the quarter by age group (Figure 2), the employment rate for those aged 16 to 24 years decreased by 3.8 percentage points on the year and 0.1 percentage points on the quarter to 14.4%. Meanwhile, the rate for those aged 35 to 49 years also decreased by 1.0 percentage points on the year and 0.3 percentage points on the quarter to 84.8%. This was the largest annual decrease for this age group since February to April 2010. Additionally, the rate for those aged 50 to 64 years decreased by a record 1.6 percentage points on the year and 0.4 percentage points on the quarter to 71.1%.
Full-time and part-time employees and self-employed
Looking more closely at the quarterly decrease in employment, this was driven by decreases in the number of full-time self-employed people and part-time employees. The decrease in full-time self-employed people was driven by men, but full-time self-employed women also saw a record quarterly decrease. Meanwhile, the decrease in part-time employees was driven more by women, although male part-time employees also saw a quarterly decrease. The quarterly decrease was partly offset by an increase in full-time employees, which was mainly driven by women.
Employment status on the LFS is self-reported, with people classifying themselves as being either an employee or self-employed. Labour market flows estimates show that the recent increases in the number of employees and decreases in the number of self-employed people have been driven, in part, by a movement of people from self-employed to employee status. Of those who move from self-employed to employee status, the number who had changed jobs has only increased slightly from normal levels. Consequently, some of the fall in self-employment since January to March 2020 comes from an increase in the number of people who have changed to classifying themselves as an employee, even though they have not changed jobs.
Temporarily away from job
Figure 3: The total number of people temporarily away from work increased slightly in November and December 2020
Total number of people temporarily away from paid work, including their time away and amount of wage receiving if away for three months or more (16 years and over), seasonally adjusted, between January 2020 and December 2020
Source: Office for National Statistics – Labour Force Survey
Notes:
- Time respondent has been temporarily away from paid work was asked to all in employment who were temporarily away from paid work in the reference period.
- Amount of wage received was asked to all in employment who were temporarily away from paid work for three months or more in the reference period.
- Estimates will not sum to totals because of missing responses and limited constraining in the seasonal adjustment.
Download this chart Figure 3: The total number of people temporarily away from work increased slightly in November and December 2020
Image .csv .xlsFrom the way the Labour Force Survey (LFS) data are collected, it is possible to separate out responses relating to individual weeks during the survey period. We have developed a method for weighting the weekly LFS data to produce UK aggregates. The sample for any week is not representative, and the results are more volatile than the quarterly or monthly estimates. As such, their use is to show any large impact of a sudden change in labour market conditions and should not be used as a leading indicator.
The LFS collects information on those temporarily away from paid work that they expect to return to. Of those temporarily away from paid work we gather a range of data, including whether they are temporarily away from work short-term (less than three months) or long-term (three months or more) and whether those away long-term are earning more or less than half their usual salary.
These experimental weekly Labour Force Survey (LFS) estimates show that before lockdown the estimated number of people temporarily away from work was approximately 2.5 million. These people could be away for a variety of reasons including sickness, maternity or paternity leave, holidays or economic reasons.
There was a large increase in both March and April 2020 in those stating that they were temporarily away from paid work (Figure 3), with nearly 9 million away from work in the final week of April 2020. The number of people temporarily away from work has fallen since its peak in April and May 2020, although it increased slightly in November and December.
In April 2020, several questions were added to the LFS questionnaire to gather additional information on the situation in the labour market during the coronavirus (COVID-19) pandemic. One question asks whether an employee is still being paid while their job is on hold and/or affected by the coronavirus pandemic; everyone answering this question will be defined as in employment.
Experimental weekly Labour Force Survey (LFS) estimates show approximately half a million employees received no pay while their job was on hold and/or affected by the coronavirus pandemic in April and May 2020. This decreased and had remained largely flat at around 200,000 since July 2020; however, it has increased over the last quarter to an average of around 307,000 in December 2020.
Figure 4: The proportion of people in employment on zero-hours contracts was largely unchanged on the year, at 3.0%
Proportion of people in employment who are on zero-hours contracts¹ in their main job (aged 16 years and over), UK, not seasonally adjusted, between October to December 2013 and October to December 2020
Source: Office for National Statistics – Labour Force Survey
Notes:
- There is a break in the series between October to December 2019 and January to March 2020 because of a change in methodology. More information can be found in this article.
Download this chart Figure 4: The proportion of people in employment on zero-hours contracts was largely unchanged on the year, at 3.0%
Image .csv .xlsHours worked
Since estimates began in 1971, up until the introduction of the coronavirus (COVID-19) lockdown measures, total hours worked by women had generally increased, reflecting increases in both the employment rate for women and the UK population. In contrast, total hours worked by men had been relatively stable because of falls in the employment rate for men, and increases in the share of part-time working, roughly offset by population increases.
Workers temporarily absent from a job as a result of the coronavirus pandemic would still be classed as employed, however, they would be employed working no hours. This directly impacted the total actual hours worked in October to December 2020. Since the average actual weekly hours are the average of all in employment, those temporarily absent from a job also impacted on those estimates. Even though lockdown restrictions were reintroduced during the October to December 2020 period, the estimates show an increase for hours worked in comparison with the previous quarter, although the increase has slowed and the level is still well below pre-coronavirus levels.
Between July to September 2020 and October to December 2020, total actual weekly hours worked in the UK saw an increase of 53.7 million, or 5.8%, to 978.7 million hours (Figure 5). Total hours worked for men saw an increase of 28.5 million, or 5.2%, to 572.5 million hours, and total hours worked for women saw an increase of 25.2 million, or 6.6%, to 406.2 million hours.
Average actual weekly hours worked saw an increase of 1.8 hours on the quarter to 30.2 hours. The average weekly hours worked by men saw an increase of 1.8 hours to 33.9 hours, while women's hours saw an increase of 1.7 hours to 26.2 hours.
Figure 5: Total hours continues to show signs of recovery, but increases have slowed
UK total actual weekly hours worked (people aged 16 years and over), seasonally adjusted, between October to December 2005 and October to December 2020
Source: Office for National Statistics – Labour Force Survey
Download this chart Figure 5: Total hours continues to show signs of recovery, but increases have slowed
Image .csv .xlsImputation used for the Labour Force Survey was not designed to deal with the changes experienced in the labour market in recent months. Experimental work with adjusted methodology suggests that during the early stages of lockdown we were understating the full extent of the reduction in total hours. However, the latest estimates suggest the use of the existing methodology has little impact on total hours, with the experimental methodology now suggesting the actual number of hours is approximately 0.1% higher than stated.
Experimental weekly Labour Force Survey (LFS) estimates show a decrease in hours for both employees and the self-employed in March 2020, with the largest decrease seen for those identifying as self-employed. Since May 2020, we have seen hours for both groups start to increase slowly; by the end of December 2020 the average actual hours worked by employees were almost back in line with the levels seen before the coronavirus pandemic. Self-employed hours have been more volatile than employee hours throughout the lockdown period and, although they have increased since May, in December 2020 they were, on average, still well below the levels seen pre-lockdown.
Nôl i'r tabl cynnwys5. Unemployment
Figure 6: The unemployment rate for all people increased by 1.3 percentage points on the year, and increased by 0.4 percentage points on the quarter, to 5.1%
UK unemployment rates (aged 16 years and over), seasonally adjusted, between January to March 1971 and October to December 2020
Source: Office for National Statistics – Labour Force Survey
Download this chart Figure 6: The unemployment rate for all people increased by 1.3 percentage points on the year, and increased by 0.4 percentage points on the quarter, to 5.1%
Image .csv .xlsUnemployment measures people without a job who have been actively seeking work within the last four weeks and are available to start work within the next two weeks. The unemployment rate is not the proportion of the total population who are unemployed. It is the proportion of the economically active population (those in work plus those seeking and available to work) who are unemployed.
Estimated unemployment rates for both men and women aged 16 years and over had generally been falling since late 2013 but have increased over recent periods (Figure 6).
For people aged 16 years and over, for October to December 2020:
the estimated UK unemployment rate for all people was 5.1%; this is 1.3 percentage points higher than a year earlier and 0.4 percentage points higher than the previous quarter
the estimated UK unemployment rate for men was 5.4%; this is 1.4 percentage points higher than a year earlier and 0.2 percentage points higher than the previous quarter
the estimated UK unemployment rate for women was 4.8%; this is 1.2 percentage points higher than a year earlier and 0.6 percentage points higher than the previous quarter
The annual increase in the unemployment rate was the largest since October to December 2009, with the rate at its highest level since January to March 2016.
The single-month and weekly estimates of the unemployment rate suggest that the rate was largely flat through the October to December 2020 period.
Imputation used for the Labour Force Survey (LFS) was not designed to deal with the changes experienced in the labour market in recent months. Experimental work with adjusted methodology suggests the use of the existing methodology has little impact on the unemployment rate (less than 0.2 percentage points). Further information can be found in the section on Measuring the data.
For October to December 2020, an estimated 1.74 million people were unemployed, up 454,000 on the same period the previous year and up 121,000 on the quarter. The annual increase was the largest since September to November 2009, with unemployment at its highest level since July to September 2015.
Figure 7: Unemployment increased on the year for all age groups, but the quarterly increase is driven by those aged 25 to 64 years
UK unemployment rate by age (aged 16 years and over), seasonally adjusted, cumulative growth from October to December 2019, for each period up to October to December 2020
Source: Office for National Statistics – Labour Force Survey
Download this chart Figure 7: Unemployment increased on the year for all age groups, but the quarterly increase is driven by those aged 25 to 64 years
Image .csv .xlsLooking in more detail at the increase in unemployment by age group (Figure 7):
those aged 16 to 24 years increased by 3.1 percentage points on the year, but decreased by 0.2 percentage points on the quarter, to 14.4%
those aged 25 to 49 years increased by 1.1 percentage points on the year, and 0.4 percentage points on the quarter, to 3.8%
those aged 50 to 64 years increased by 1.4 percentage points on the year, and 0.6 percentage points on the quarter, to 4.1%
Figure 8: The number of people who have been unemployed for up to six months has been steadily increasing since the start of 2020, but now shows signs of slowing
UK unemployment by duration (aged 16 years and over), seasonally adjusted, between October to December 2015 and October to December 2020
Source: Office for National Statistics – Labour Force Survey
Download this chart Figure 8: The number of people who have been unemployed for up to six months has been steadily increasing since the start of 2020, but now shows signs of slowing
Image .csv .xlsThe annual increase in unemployment is mainly driven by those unemployed for up to six months, up 294,000 on the year to 1.07 million (Figure 8). However, those unemployed for over 12 months have also increased by 72,000 on the year, and 25,000 on the quarter, to 363,000.
To estimate duration of unemployment, Labour Force Survey (LFS) respondents are asked how long they have been looking for work. Respondents are unlikely to discount short periods where they were not looking for work from this. Consequently, the quarterly increase in those unemployed for over 12 months is driven, in part, by those that briefly stopped looking for work in the earlier stages of the pandemic (and were therefore classified as economically inactive at that time) as they are likely to return to unemployment duration estimates in longer-term categories.
Looking at unemployment rates by industry of last job, between October to December 2020, there were increases for all industries. The largest increase was for those previously employed in accommodation and food service activities, up 5.3 percentage points on the year to 10.6%, the highest unemployment rate across all industries. The second-largest increase was for those previously employed in administrative and support services, up 2.8 percentage points on the year to 6.8%.
The Claimant Count (Experimental Statistics)
These Claimant Count statistics relate to 8 January 2021. Enhancements to Universal Credit as part of the UK government's response to the coronavirus mean that an increasing number of people became eligible for unemployment-related benefit support, although still employed.
Consequently, changes in the Claimant Count will not be wholly because of changes in the number of people who are unemployed. We are not able to identify to what extent people who are employed or unemployed have affected the numbers.
The Claimant Count is an Experimental Statistic that seeks to measure the number of people claiming benefit principally for the reason of being unemployed.
To achieve this, the Claimant Count has generally been a count of the appropriate benefits within the UK's current benefit regime that best meet that criteria. Currently this is a combination of claimants of Jobseeker's Allowance (JSA) and claimants of Universal Credit (UC) who fall within the UC "searching for work" conditionality.
Those claiming unemployment-related benefits (either UC or JSA) may be wholly unemployed and seeking work, or may be employed but with low income and/or low hours, that make them eligible for unemployment-related benefit support.
Under UC a broader span of claimants became eligible for unemployment-related benefit than under the previous benefit regime. During the roll-out of UC since 2013, movements in the Claimant Count have been significantly affected by this expanding eligibility, rather than labour market conditions. This impact has led to the Claimant Count being reclassified to an Experimental Statistic.
As part of the UK government's response to the coronavirus (COVID-19) pandemic, a number of enhancements and easements have been made to UC, which impact the statistics. In addition, claimants are accessing UC as a "top-up" to government support packages (such as the Coronavirus Job Retention Scheme and Self-Employment Income Support Scheme) to legitimately claim unemployment benefits whilst "furloughed". A proportion of those claimants will be employed under the International Labour Organization (ILO) definition - furloughed, or with low earnings or hours of paid work.
Consequently, while some of any movement in the Claimant Count would be because of changes in the number of people who are out of work, a certain amount of the movement will be because of changes in the number of people in work who are eligible for UC as part of the government response. We are not able to identify to what extent these two factors have affected the numbers.
The Claimant Count decreased slightly in January 2021 to 2.6 million (Figure 9). This represents a monthly decrease of 0.8% but an increase of 109.4%, or 1.4 million, since March 2020.
Figure 9: UK Claimant Count level has increased by 109.4% since March 2020
UK Claimant Count, seasonally adjusted, between January 2008 and January 2021
Source: Department for Work and Pensions
Download this chart Figure 9: UK Claimant Count level has increased by 109.4% since March 2020
Image .csv .xls6. Economic inactivity
Economic inactivity measures people without a job but who are not classed as unemployed because they have not been actively seeking work within the last four weeks and/or they are unable to start work within the next two weeks. Our headline measure of economic inactivity is for those aged between 16 and 64 years.
Since comparable records began in 1971, the economic inactivity rate for all people aged between 16 and 64 years has generally been falling (although it increased during recessions). This is because of a gradual fall in the economic inactivity rate for women. This fall reflects changes to the State Pension age, resulting in fewer women retiring between the ages of 60 and 65 years, as well as more women in younger age groups participating in the labour market. Over recent years, the economic inactivity rate for men has been relatively flat (Figure 10).
Figure 10: The economic inactivity rate for all people increased by 0.4 percentage points on the year, but was largely unchanged on the quarter, to 20.9%
UK economic inactivity rate (all people aged 16 to 64 years), seasonally adjusted, between January to March 1971 and October to December 2020
Source: Office for National Statistics – Labour Force Survey
Download this chart Figure 10: The economic inactivity rate for all people increased by 0.4 percentage points on the year, but was largely unchanged on the quarter, to 20.9%
Image .csv .xlsFor people aged between 16 and 64 years, for October to December 2020:
the estimated economic inactivity rate for all people was 20.9%; this is up by 0.4 percentage points on the same period the previous year but largely unchanged on the quarter
the estimated economic inactivity rate for men was 17.3%; this is up by 1.2 percentage points on the same period the previous year and up by 0.3 percentage points on the quarter
the estimated economic inactivity rate for women was 24.5%; this is down by 0.4 percentage points on the same period the previous year and down by 0.3 percentage points on the quarter
Imputation used for the Labour Force Survey was not designed to deal with the changes experienced in the labour market in recent months. Experimental work with adjusted imputation methodology suggests the use of the existing methodology has little impact on the economic inactivity rate (less than 0.1 percentage points). Further information can be found in the section on Measuring the data.
Estimates for October to December 2020 show 8.66 million people aged between 16 and 64 years not in the labour force (economically inactive). This was 187,000 more than a year earlier and 2,000 more than the previous quarter. The annual increase was the largest since April to June 2010 and was driven by men, who reached a record high of 3.57 million.
Figure 11: The annual increase for people who are economically inactive was largely driven by people who are inactive because of "other" reasons and by those who are long-term sick
Economically inactive people by reason in the UK (aged 16 to 64 years), seasonally adjusted, October to December 2015 to October to December 2020
Source: Office for National Statistics – Labour Force Survey
Notes:
- Discouraged workers are those who are not looking for work because they believe no jobs are available
- Other reasons for being economically inactive include those who are waiting for the results of a job application; have not yet started looking for work; do not need or want employment; have given an uncategorised reason for being economically inactive; or have not given a reason for being economically inactive
Download this chart Figure 11: The annual increase for people who are economically inactive was largely driven by people who are inactive because of "other" reasons and by those who are long-term sick
Image .csv .xlsIn terms of reasons for economic inactivity (Figure 11), the annual increase was largely driven by:
those who are long-term sick, up 128,000 on the year to 2.20 million
those who state they are inactive because they are students, up 104,000 to 2.36 million
those who are inactive because of "other" reasons, up 189,000 on the year to 1.14 million
There was also an increase of 42,000 (to 75,000) for discouraged workers (those who are not looking for work because they believe no jobs are available). The annual increase was offset somewhat by the large decrease in people who were economically inactive because of looking after family or home (down 273,000 on the year to 1.61 million).
Nôl i'r tabl cynnwys7. Redundancies
The redundancy estimates measure the number of people who were made redundant or who took voluntary redundancy in the three months before the Labour Force Survey interviews; it does not take into consideration planned redundancies. So, in this release, the latest estimates may relate to redundancies over the period from the beginning of August to the end of December 2020.
Figure 12: The redundancy rate increased by 8.4 per thousand on the year to 12.3 per thousand
UK redundancy rate¹, people aged 16 years and over (not seasonally adjusted), between October to December 2005 and October to December 2020
Source: Office for National Statistics – Labour Force Survey
Notes:
- The redundancy rate is the ratio of the redundancy level for the given quarter to the number of employees in the previous quarter, multiplied by 1,000.
Download this chart Figure 12: The redundancy rate increased by 8.4 per thousand on the year to 12.3 per thousand
Image .csv .xlsLooking at redundancy rates by different characteristics in the three months prior to October to December 2020:
the redundancy rate increased by 8.4 per thousand on the year to 12.3 per thousand
the age group with the highest redundancy rate was those aged 50 years and over, up 8.9 per thousand on the year to 14.1 per thousand
the region of residence with the highest redundancy rate was London, up 15.4 per thousand on the year to 18.8 per thousand
the industry with the highest redundancy rate was administrative and support services, up 23.4 per thousand on the year to 31.3 per thousand
Figure 13: The number of people reporting redundancy in the three months prior to interview declined through December 2020, but remains above normal levels
UK redundancies by week, people aged 16 years and over (seasonally adjusted), between January 2020 and December 2020
Source: Office for National Statistics – Labour Force Survey
Download this chart Figure 13: The number of people reporting redundancy in the three months prior to interview declined through December 2020, but remains above normal levels
Image .csv .xlsExperimental weekly Labour Force Survey (LFS) estimates show that the number of people reporting redundancy in the three months prior to interview had been increasing since June 2020 (peaking in September) and remains high, but has fallen in December 2020 (Figure 13).
Nôl i'r tabl cynnwys8. Labour Market Flows
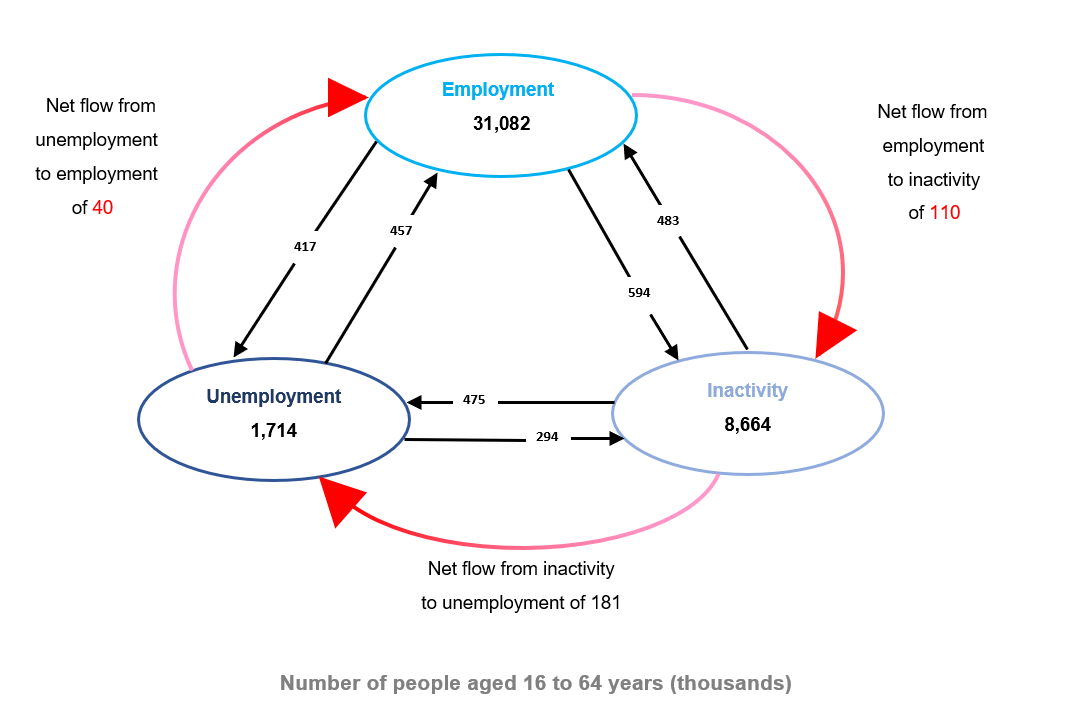
Figure 14: There was a net flow of 141,000 into unemployment
UK flows between employment, unemployment and economic inactivity (seasonally adjusted), between July to September 2020 and October to December 2020
Source: Office for National Statistics – Labour Force Survey
Notes:
- The figures in the bubbles are the total stocks in October to December 2020 (from Dataset A02)
Download this image Figure 14: There was a net flow of 141,000 into unemployment
.png (70.0 kB)
Looking at estimates of flows between employment, unemployment and economic inactivity between July to September 2020 and October to December 2020 (Figure 14), there was a net flow of:
110,000 from employment to economic inactivity
181,000 from economic inactivity to unemployment
40,000 from unemployment to employment
9. Employment in the UK data
Employment, unemployment and economic inactivity
Dataset A05 SA | Released 23 February 2021 <br< Estimates of UK employment, unemployment and economic inactivity broken down into age bands.
Full-time, part-time and temporary workers
Dataset EMP01 SA | Released 23 February 2021
Estimates of UK employment including a breakdown by sex, type of employment, and full-time and part-time working.
People in employment on zero hours contracts
Dataset EMP17 NSA | Released 23 February 2021
Estimates of UK employment on zero hours contracts, including breakdowns by sex, age, and region.
Actual weekly hours worked
Dataset HOUR01 SA | Released 23 February 2021
Estimates for the hours that people in employment work in the UK.
Unemployment by age and duration
Dataset UNEM01 SA | Released 23 February 2021
Estimates of unemployment in the UK including a breakdown by sex, age group and the length of time people are unemployed.
Economic inactivity by reason
Dataset INAC01 SA | Released 23 February 2021
Estimates of those not in the UK labour force measured by the reasons given for economic inactivity.
Labour Force Survey sampling variability
Dataset A11 | Released 23 February 2021
Labour Force Survey (LFS) sampling variability (95% confidence intervals).
Labour Force Survey single month estimates
Dataset X01 | Released 23 February 2021
Labour Force Survey (LFS) single-month estimates of employment, unemployment and economic inactivity have been published by the Office for National Statistics (ONS) since 2004. Not designated as National Statistics.
Labour Force Survey weekly estimates
Dataset X07 | Released 23 February 2021
Labour Force Survey (LFS) weekly estimates of employment, unemployment, economic inactivity and hours in the UK. All estimates are calculated from highly experimental weekly Labour Force Survey datasets.
10. Glossary
Actual and usual hours worked
Statistics for usual hours worked measure how many hours people usually work per week. Compared with actual hours worked, they are not affected by absences and so can provide a better measure of normal working patterns. For example, a person who usually works 37 hours a week but who was on holiday for a week would be recorded as working zero actual hours for that week, while usual hours would be recorded as 37 hours.
Economic inactivity
People not in the labour force (also known as economically inactive) are not in employment but do not meet the internationally accepted definition of unemployment because they have not been seeking work within the last four weeks and/or are unable to start work in the next two weeks. The economic inactivity rate is the proportion of people aged between 16 and 64 years who are not in the labour force.
Employment
Employment measures the number of people in paid work or who had a job that they were temporarily away from (for example, because they were on holiday or off sick). This differs from the number of jobs because some people have more than one job. The employment rate is the proportion of people aged between 16 and 64 years who are in employment. A more detailed explanation is available in our guide to labour market statistics.
Unemployment
Unemployment measures people without a job who have been actively seeking work within the last four weeks and are available to start work within the next two weeks. The unemployment rate is not the proportion of the total population who are unemployed. It is the proportion of the economically active population (that is, those in work plus those seeking and available to work) who are unemployed.
A more detailed glossary is available.
Nôl i'r tabl cynnwys11. Measuring the data
This bulletin relies on data collected from the Labour Force Survey (LFS), the largest household survey in the UK.
More quality and methodology information on strengths, limitations, appropriate uses, and how the data were created is available in the LFS QMI.
The LFS performance and quality monitoring reports provide data on response rates and other quality-related issues for the LFS.
Coronavirus
For more information on how labour market data sources are affected by the coronavirus (COVID-19) pandemic, see the article published on 6 May 2020, which details some of the challenges that we have faced in producing estimates at this time.
An article published on 11 December 2020 compares our labour market data sources and discusses some of the main differences.
Our latest data and analysis on the impact of the coronavirus on the UK economy and population are available on our dedicated coronavirus web page. This is the hub for all special coronavirus-related publications, drawing on all available data. In response to the developing coronavirus pandemic, we are working to ensure that we continue to publish economic statistics. For more information, please see COVID-19 and the production of statistics.
Labour Force Survey (LFS) responses are weighted to official population estimates and projections that do not currently reflect the impact of the COVID-19 pandemic. The LFS is not designed to measure changes in the levels of population or long-term international migration. We are analysing the population totals used in the weighting process and may make adjustments if appropriate. This issue does not affect rates published from the LFS; however, levels and changes in levels should be used with caution.
Impact of the coronavirus on data collection
The LFS design is based on interviewing households over five consecutive quarters. Generally, the first of these interviews, called Wave 1, takes place face-to-face, with most subsequent interviews, for Waves 2 to 5, conducted by telephone.
During March, we stopped conducting face-to-face interviews, instead switching to using telephone interviewing exclusively for all waves. This initially caused a significant drop in response.
New measures have been introduced to improve this, which have increased sample sizes, although they are still below normal LFS sample sizes
Impact of the coronavirus on survey imputation methodology
The normal imputation for non-response to the LFS relies on rolling forward previous responses. Although this method is adequate under normal circumstances, it is not designed to deal with the changes experienced in the labour market in recent months. A new experimental imputation methodology has been researched to improve the measurement of the labour market at this time.
Because of time and system constraints, it has not been possible to fully integrate this methodology into the results within this release, but early indications suggest that:
there is little impact from the use of existing methodology on the headline measures of employment, unemployment and economic inactivity (less than 0.2 percentage points)
there is little impact from the use of existing methodology on total hours, with measures relating to total hours in this release understating the increase in the actual number of hours worked by approximately 0.1%
We hope to include more information in later releases as this work develops.
Impact of the coronavirus on survey weighting methodology
Because of the impact on data collection, different weeks throughout the quarter have different achieved sample sizes. To mitigate this impact on estimates the weighting methodology was enhanced to include weekly calibration to ensure that samples from each week had roughly equal representation within the overall three-month estimate. This meant that any impacts seen from changes in the labour market in those weeks would be fully represented within the estimates.
Because of the suspension of face-to-face interviewing in March 2020, we had to make operational changes to the LFS, particularly in the way that we contact households for initial interview, which moved to a "by telephone" approach. These changes have resulted in a response where certain characteristics have not been as well represented as previously. This is evidenced in a change in the balance of type of household that we are reaching. In particular, the proportion of households where people own their homes in the sample has increased and rented accommodation households has decreased.
To mitigate the impact of this non-response bias we have introduced housing tenure into the LFS weighting methodology for periods from January to March 2020 onwards. While not providing a perfect solution, this has redressed some of the issues that had previously been noted in the survey results. More information can be found in an article Coronavirus and its impact on the Labour Force Survey.
Impact of government measures to protect businesses on the Labour Force Survey estimates
During late March, the government announced a number of measures to protect UK businesses. This included the Coronavirus Job Retention Scheme (CJRS), also referred to as furloughing, and the Self-Employment Income Support Scheme (SEISS).
The Office for National Statistics (ONS) classifies people within the labour market in line with International Labour Organization (ILO) definitions. Under the ILO definition, employment includes employed persons "at work", that is, those who worked in a job for at least one hour; and employed persons "not in work" because of temporary absence from a job, or a change to working time arrangements.
Under the current schemes it is likely that workers would have an expectation of returning to that job and would consider the absence from work as temporary. Therefore, those people absent from work under the current schemes would generally be classified as employed under ILO definitions.
In many cases, however, they would be employed but not in work. This absence would have an impact on the total hours worked. This would also be reflected in the average actual hours worked, which are based on the average hours per person employed, rather than the average hours per person at work. While actual hours would be significantly affected, there is unlikely to be any impact on usual hours, which would reflect normal working patterns.
End of EU exit transition period
As the UK enters into a new Trade and Cooperation Agreement with the EU, the UK statistical system will continue to produce and publish our wide range of economic and social statistics and analysis. We are committed to continued alignment with the highest international statistical standards, enabling comparability both over time and internationally, and ensuring the general public, statistical users and decision makers have the data they need to be informed.
As the shape of the UK's future statistical relationship with the EU becomes clearer over the coming period, the ONS is making preparations to assume responsibilities that as part of our membership of the EU, and during the transition period, were delegated to the statistical office of the EU, Eurostat. This includes responsibilities relating to international comparability of economic statistics, deciding what international statistical guidance to apply in the UK context and to provide further scrutiny of our statistics and sector classification decisions.
In applying international statistical standards and best practice to UK economic statistics, we will draw on the technical advice of experts in the UK and internationally, and our work will be underpinned by the UK's well-established and robust framework for independent official statistics, set out in the Statistics and Registration Service Act 2007. Further information on our proposals will be made available early this year.
We will continue to produce our labour market statistics in line with the UK Statistics Authority's Code of Practice for Statistics and in accordance with International Labour Organization (ILO) definitions and agreed international statistical guidance.
Nôl i'r tabl cynnwys12. Strengths and limitations
Uncertainty in these data
The estimates presented in this bulletin contain uncertainty.
The figures in this bulletin come from the Labour Force Survey (LFS), which gathers information from a sample of households across the UK rather than from the whole population. The sample is designed to be as accurate as possible given practical limitations such as time and cost constraints. Results from sample surveys are always estimates, not precise figures. This can have an impact on how changes in the estimates should be interpreted, especially for short-term comparisons.
The data in this bulletin come from the Labour Force Survey, a survey of households. It is not practical to survey every household each quarter, so these statistics are estimates based on a large sample.
As the number of people available in the sample gets smaller, the variability of the estimates that we can make from that sample size gets larger. Estimates for small groups (for example, unemployed people aged between 16 and 17 years), which are based on small subsets of the LFS sample, are less reliable and tend to be more volatile than for larger aggregated groups (for example, the total number of unemployed people).
In general, changes in the numbers (and especially the rates) reported in this bulletin between three-month periods are small and are not usually greater than the level that can be explained by sampling variability. Short-term movements in reported rates should be considered alongside longer-term patterns in the series and corresponding movements in other sources to give a fuller picture.
Comparability
The data in this bulletin follow internationally accepted definitions specified by the International Labour Organization (ILO). This ensures that the estimates for the UK are comparable with those for other countries.
An annual reconciliation report of job estimates is published every March comparing the latest workforce jobs (WFJ) estimates with the equivalent estimates of jobs from the Labour Force Survey (LFS).
The concept of employment (measured by the LFS as the number of people in work) differs from the concept of jobs, since a person can have more than one job and some jobs may be shared by more than one person. The LFS, which collects information mainly from residents of private households, is the preferred source of statistics on employment. The WFJ series, which is compiled mainly from surveys of businesses, is the preferred source of statistics on jobs by industry, since it provides a more reliable industry breakdown than the LFS. During the coronavirus (COVID-19) pandemic, the LFS and WFJ series may have additional differences because a person's perception of their attachment to a job may differ from the business's perception of that job. It is also important to note that the LFS is based on interviews throughout the coverage period, whereas the WFJ series relates to a specific date. This difference can be significant in a labour market that is experiencing rapid changes.
Further information is available in A guide to labour market statistics.
| Level | Sampling variability of level¹ | Change on quarter | Sampling variability of change on quarter¹ | Change on year | Sampling variability of change on year¹ | |
|---|---|---|---|---|---|---|
| Employment (000s, aged 16+ ) | 32,393 | ± 201 | -114 | ± 174 | -541 | ± 256 |
| Employment rate (aged 16 to 64) | 75.0 | ± 0.5 | -0.3 | ± 0.4 | -1.5 | ± 0.6 |
| Average weekly hours | 30.2 | ± 0.2 | 1.8 | ± 0.2 | -1.7 | ± 0.3 |
| Unemployment (000s, aged 16+) | 1,744 | ± 95 | 121 | ± 102 | 454 | ± 115 |
| Unemployment rate (aged 16+) | 5.1 | ± 0.3 | 0.4 | ± 0.3 | 1.3 | ± 0.3 |
| Economically active (000s, aged 16+) | 34,137 | ± 191 | 7 | ± 167 | -86 | ± 244 |
| Economic activity rate (aged 16 to 64) | 79.1 | ± 0.4 | 0.0 | ± 0.4 | -0.4 | ± 0.5 |
| Economically inactive (000s, aged 16 to 64) | 8,664 | ± 179 | 2 | ± 156 | 187 | ± 226 |
| Economic inactivity rate (aged 16 to 64) | 20.9 | ± 0.4 | 0.0 | ± 0.4 | 0.4 | ± 0.5 |
| Redundancies (000s, aged 16+) | 343 | ± 39 | 30 | ± 54 | 235 | ± 44 |