1. Background
In the Labour Force Survey (LFS) respondents are interviewed for five consecutive quarters over a 12 month period, with 20 per cent of the sample being replaced at each quarter. This allows for a longitudinal dataset to be created over a limited time interval, where respondents’ characteristics can be tracked over their time in the survey.
The ONS publishes population-weighted longitudinal datasets for each calendar quarter. These are available for each quarter since 1997 and can be used to analyse changes in labour market characteristics over two or five quarters. The datasets include "flow" variables, which estimate the size of the movements between the three main labour market statuses of employment, unemployment and economic inactivity.
Monitoring changes in the labour market status of respondents to the LFS aids the understanding of the quarterly changes in the levels of employment, unemployment and economic inactivity. These indicators are published as stocks for a given period, with changes expressed as the difference between successive quarters. These quarterly comparisons represent the net changes between the three labour market statuses. The underlying gross flows are usually considerably larger and may not correspond with those implied by the net changes. Estimates of the gross flows between the statuses can be derived from the LFS Longitudinal Datasets and are summarised in this note.
Nôl i'r tabl cynnwys2. Method
There are two types of LFS longitudinal datasets: two-quarter and five-quarter. These are weighted using the same population estimates as those used in the main quarterly LFS datasets, although the weighting methodology differs (see technical note). Consequently the estimates are broadly consistent with the published aggregates, but not entirely. Also, the datasets are limited to people aged 16-64.
Both types of dataset contain a flow variable with eleven categories, with all combinations of employment, unemployment and economic inactivity accounted for, plus two categories for those entering and leaving the 16-64 population over the quarter. For the purpose of this analysis, those entering or leaving this population are excluded from the measured sample. The stock of the employed, unemployed and inactive at each quarter can therefore be estimated by summing the corresponding flow categories.
For this analysis, the two-quarter datasets have been used in order to gain some insight into the quarterly changes in the headline published aggregates.
Nôl i'r tabl cynnwys3. The spreadsheet and charts
Estimates of flows between labour market statuses are available at data table X02 (80.5 Kb Excel sheet).
The charts in this article show the estimated gross flows, that is the total inflow or outflow for 16-64 employment, unemployment and inactivity from one calendar quarter to the next. They are seasonally adjusted. Analysis of the net flows, that is the difference between the total inflow and outflow, are also included and these are compared with the quarterly changes in the published aggregates, partly to give an indication of the robustness of the flows analysis.
Nôl i'r tabl cynnwys4. Key messages for quarter 4 2014:
The LFS Longitudinal datasets have been reweighted to take account of 2011 Census based population estimates and updated population projections. Consequently all the historical flows estimates in this release have been revised. Further details about LFS reweighting are provided in Revisions to Labour Force Survey estimates due to re-weighting to the Census 2011 population, Article - ONS
The gross flow into unemployment has continued to decrease, reflecting decreases in the flows from both employment and inactivity.
The gross flow into employment has remained above 1 million for the sixth quarter in a row and has remained significantly higher than the gross outflow. This reflects strong employment growth overall.
The gross inflows and outflows for inactivity have shown little change in recent quarters, with the inflow remaining slightly lower than the outflow.
5. Quarterly gross flows
The diagram shows the gross flow between each economic status between July - September 2014 and October - December 2014. The stocks for each status represent the latter period and are the seasonally adjusted aggregates for people aged 16-64.
Quarterly population flows - Oct-Dec 2014
United Kingdom, seasonally adjusted (thousands)
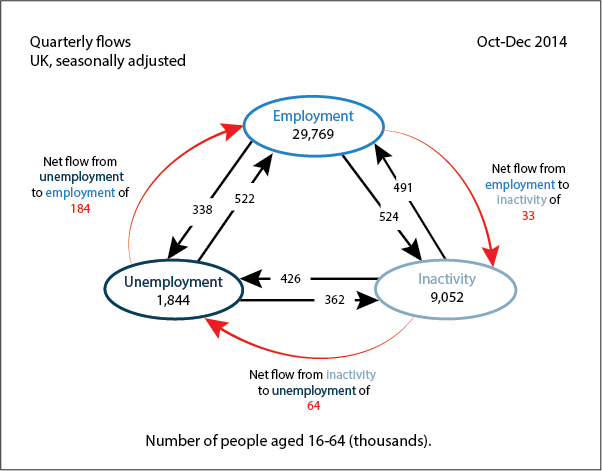
Source: Labour Force Survey
Download this image Quarterly population flows - Oct-Dec 2014
.png (41.7 kB) .xls (84.5 kB)
6. Unemployment
The inflow to unemployment (Chart 1) has continued to decrease over the last two years driven by both flows from employment and inactivity.
Chart 1: Inflow to unemployment - seasonally adjusted (16-64)
Seasonally adjusted
Source: Labour Force Survey
Download this chart Chart 1: Inflow to unemployment - seasonally adjusted (16-64)
Image .csv .xlsThe gross flow out of unemployment (Chart 2) was unchanged in the latest quarter, after having fallen for the previous three quarters. The underlying trends for unemployment outflows appear to be downward though, reflecting the decreasing stock of unemployed people.
Chart 2: Outflow from Unemployment - seasonally adjusted (16-64)
Source: Labour Force Survey
Download this chart Chart 2: Outflow from Unemployment - seasonally adjusted (16-64)
Image .csv .xlsChart 3 shows that, the net quarterly flow remained strongly negative, consistent with the quarterly change in stock.
Chart 3: 16-64 unemployment: net flow vs change in stock (seasonally adjusted)
Source: Labour Force Survey
Download this chart Chart 3: 16-64 unemployment: net flow vs change in stock (seasonally adjusted)
Image .csv .xls7. Employment
The total inflow to employment (Chart 4) was unchanged in the latest quarter and has remained above 1 million for six quarters.
Chart 4: Inflow to employment - seasonally adjusted (16-64)
Seasonally adjusted
Source: Labour Force Survey
Download this chart Chart 4: Inflow to employment - seasonally adjusted (16-64)
Image .csv .xlsThe trend in the gross outflow from employment has remained flat at just under 900,000. The outflow to inactivity has remained significantly higher than the outflow to unemployment.
Chart 5: Outflow from employment - seasonally adjusted (16-64)
Seasonally adjusted
Source: Labour Force Survey
Download this chart Chart 5: Outflow from employment - seasonally adjusted (16-64)
Image .csv .xlsChart 6 shows that the net flow and change in stock have both levelled off after decreasing for the previous 2 quarters although both remain strongly positive.
Chart 6: 16-64 employment: net flows vs change in stock (seasonally adjusted)
Source: Labour Force Survey
Download this chart Chart 6: 16-64 employment: net flows vs change in stock (seasonally adjusted)
Image .csv .xls8. Inactivity
The gross inflow to inactivity (Chart 7) has remained broadly flat over the last year and is close to the average of the previous five years. The flows from employment and inactivity also show little change over the last four periods.
Chart 7: Inflow to inactivity - seasonally adjusted (16-64)
Source: Labour Force Survey
Download this chart Chart 7: Inflow to inactivity - seasonally adjusted (16-64)
Image .csv .xlsThe gross outflow from inactivity (Chart 8) has decreased gradually over the last year, primarily caused by a decline in the flow from inactivity to unemployment which now stands at a five year low.
Chart 8: Outflow from inactivity - seasonally adjusted (16-64)
Source: Labour Force Survey
Download this chart Chart 8: Outflow from inactivity - seasonally adjusted (16-64)
Image .csv .xlsChart 9 indicates that the net flow for inactivity and the quarterly change in stock both moved closer to zero in the latest quarter.
Chart 9: 16-64 inactivity: net flow vs change in stock (seasonally adjusted)
Seasonally adjusted
Source: Labour Force Survey
Download this chart Chart 9: 16-64 inactivity: net flow vs change in stock (seasonally adjusted)
Image .csv .xls9. Technical note
There are differences between the data used for the published LFS aggregate estimates and the longitudinal data used to estimate the gross flows:
Flows are currently adjusted for non-response bias through special calibration weights in the longitudinal datasets. These aim to account for the propensity of certain types of people to drop out of the LFS between one quarter and the next. For example, housing tenure features in the weighting of the longitudinal data because, historically, households in rented accommodation have been more likely to drop out of the survey than owner-occupiers.
There is some evidence that the longitudinal datasets are affected slightly by response error which causes a slight upward bias in the estimates of the gross flows. For example, if it was erroneously reported that someone had moved from unemployment to employment then, in addition to the outflow from unemployment being overestimated, so would the inflow to employment. In the main quarterly LFS dataset, any such misreporting errors tend to cancel each other out.
The differences in the net flows for inactivity shown in Chart 9 are mainly the result of excluding the entrants to, and leavers from, the population in the flows estimates contained in this piece of analysis. This effect is normally one that increases the number of people who enter inactivity. This is because the increase in inactivity from those people turning 16 is greater than those leaving inactivity due to becoming 65.
The stocks derived from the longitudinal datasets differ from those obtained from the quarterly LFS datasets due to their being based on a subset of the main LFS sample. The restriction to measuring only those who are commonly aged 16-64 across successive quarters discounts those entering or leaving the population and also those over 64. All such people are accounted for in the headline LFS aggregates.