1. Main points
In the three months to July 2019, UK employment increased by 31,000 to reach 32.78 million.
The rates of employment, unemployment and economic inactivity remained unchanged in the three months to July 2019 compared with the previous three months.
The number of part-time workers who could not find full-time jobs reduced by 43,000 on the quarter to 890,000.
In July 2019, both real regular pay (£470) and real total pay (£502) were less than the values reached in previous peaks in 2008 by £3 and £23 respectively.
The most recent labour market flows estimates show that there has been significant movement of workers into medium- and high-skilled jobs from low-skilled jobs.
2. Overview of the labour market
The UK labour market continues to show employment increasing (31,000 in the three months to July 2019) but at a lower rate than in recent months. The level of economic inactivity is relatively low by historical standards, but it increased slightly in the three months to July. The level of unemployment remains relatively low, and it decreased over the same period. These conditions indicate further tightening of the labour market as highlighted in external surveys. The tightening labour market is putting pressure on wages to increase as indicated by total and regular pay growth rates (4% and 3.7% respectively) in the year to July 2019.
External employment surveys point to a softening of the labour market, even though the difficulty of recruiting new workers is still historically at a high level. For instance, the KPMG and REC’s August report on jobs in the UK reported the labour market as continuing to soften. The report stated that permanent placement of new staff decreased, and temporary placements remained close to a 75-month low. It suggested that labour supply is weakening because workers are not keen to change jobs in the face of current heightened uncertainty in the economy. The British Chambers of Commerce’s (BCC’s) Quarterly Recruitment Outlook for the second quarter (April to June) of 2019 reported that 30% of surveyed firms expected to increase their workforce in the third quarter (Aug to Oct) of 2019 and 7% expected to reduce their workforce.
The Chartered Institute of Personal Development’s (CIPD’s) Labour Market Outlook survey for the third quarter (Aug to Oct) of 2019 shows that many employers expect employment growth to slow in the autumn, with stronger demand for labour in the health and business services sectors. Data from the Office for National Statistics data point in a similar direction, as the number of vacancies in the three months to August 2019 declined by 23,000 on the quarter to 812,000. From the existing data, it is not possible to tell whether the fall in vacancies is a result of a freeze on recruiting or of an increase in available workers.
Recruitment difficulty in the economy eased in the three months to June 2019, according to the BCC’s quarterly recruitment outlook for the second quarter (Apr to June) of 2019. The survey reported that the proportion of firms that reported a skills shortage decreased by 9 percentage points to 64%. The survey did not explain whether the decrease was a result of a vacancy freeze or of firms managing to attract the talent they wanted. However, recruitment difficulties remained, especially for skilled manual or technical jobs, professional or managerial jobs, and semi-skilled or unskilled jobs. Firms in the hotels and catering services (74%), transport (67%), and retailing and wholesaling (58%) sectors reported facing significant recruitment difficulties.
The KPMG and REC report on jobs in the UK for July 2019 indicated that political and economic uncertainty is dampening recruitment activity. The report highlighted that permanent staff appointments fell for the fifth consecutive month in July and that skill shortages continue to push up pay. The Royal Bank of Scotland Report on Jobs in Scotland for July 2019 also reported elevated pressure for wage growth in that economy.
Nôl i'r tabl cynnwys3. Latest labour market estimates
In the three months to July 2019, the number of people in two labour market statuses (employment and economic inactivity) increased and the number in one (unemployment) declined. The rates of the three statuses remained unchanged.
Employment
The number of people in employment increased by 31,000 on the quarter to 32.78 million between May and July 2019. The employment rate of people aged 16 to 64 years remained unchanged at 76.1%. Employment growth appears to be slowing down since the second half of 2018.
Disaggregating employment by sex shows that the number of employed men reduced for a fifth consecutive rolling quarter by 29,000 on the quarter to 17.26 million. The decrease resulted in the employment rate for men reducing by 0.1 percentage points to 80.2%.
The number of employed women increased by 60,000 on the quarter to reach 15.52 million and the employment rate increased by 0.1 percentage points to a joint record high of 72.1%. The increase in the number of employed women was the eleventh consecutive increase on a rolling quarter basis. Since the period November 2018 to January 2019, more women than men joined the labour market.
The strong performance of the female labour market can be illustrated by calculating the employment rate gap between the male and female employment rates. Figure 1 shows the long-term trend of the employment rate gap.
Figure 1: The gap between male and female employment rates has been narrowing over time
Employment rate gap, seasonally adjusted, UK, March to May 1992 to May to July 2019
Source: Office for National Statistics – Labour Force Survey
Download this chart Figure 1: The gap between male and female employment rates has been narrowing over time
Image .csv .xlsFigure 1 shows that the employment rate gap narrowed from 15 percentage points in the three months to May 1992 to 8.2 percentage points in the three months to July 2019. The narrowing of the gap is driven by more women than men getting into employment. Changing gender role attitudes, improvements in childcare funding and greater flexibility in employment that allows women to seek employment may have all contributed to this.
From 2010 to 2018, there was an increase in the State Pension Age for women from 60 to 65 years, which increased labour market participation for women in this age group. A study on the economic gains from gender inclusion by the International Monetary Fund argued that countries will realise welfare gains from removing barriers that keep women out of the labour market. The Harvard Business Review stated that in the US, increasing the employment of women by 1% resulted in wages increasing by 0.5%. Wage growth feeds into household incomes, which directly affect household living standards.
Figure 2: Employment rate gaps differ across countries
Employment rate gaps, OECD, April to June 2019
Source: OECD Employment rates
Download this chart Figure 2: Employment rate gaps differ across countries
Image .csv .xlsEmployment rate gaps differ across countries as shown in Figure 2. For instance, the following countries had lower employment rate gaps than the UK in the period April to June 2019:
Sweden (2.9 percentage points)
Norway (4.3 percentage points)
Portugal (5.3 percentage points)
France (6.3 percentage points)
Countries that had higher employment rate gaps than the UK in this period were:
the Netherlands (8.2 percentage points)
Australia (8.9 percentage points)
the US (10.4 percentage points)
Spain (10.8 percentage points).
Germany had a lower gap (7.8 percentage points) than the UK (8.5 percentage points) in the first quarter (Jan to Mar) of 2019.
The structure of part-time working
The Office for National Statistics produces estimates of the number of employees and self-employed workers who work on a part-time basis. The data are categorised into four reasons for working part-time.
Those who could not find full-time jobs
The number of workers who worked part-time because they could not find full-time jobs reduced by 43,000 on the quarter to 890,000 in the three months to July 2019. They comprised 10.5% of part-time workers. The fall in the number of people wanting full-time jobs indicates that under-employment in the economy is falling. It also indicates a fall in the level of slack in the economy.
There are several reasons why people may fail to find full-time jobs. These include lacking the required qualifications and skills; the existence of (full-time) jobs in geographical areas separate from those of the people looking for the jobs (or lack of suitable (full-time) jobs in local labour markets); long distances to work; and high transportation costs to reach areas with full-time jobs.
Part-time workers who could not find full-time jobs can be disaggregated by sex as illustrated in Figure 3. This disaggregation allows us to check if the difference in proportion of part-time workers who were unable to find full-time jobs differed significantly by sex. The proportion of part-time working men who could not find full-time employment reduced from a peak of 30.6% in the period April to June 1993 to an average of 16.1% between July to September 2001 and April to June 2008.
Figure 3: The proportion of people who could not find full-time jobs has been declining since 2013
Proportions of part-time working men and women who could not find full-time jobs, UK, seasonally adjusted, March to May 1992 to May to July 2019
Source: Office for National Statistics – Labour Force Survey
Download this chart Figure 3: The proportion of people who could not find full-time jobs has been declining since 2013
Image .csv .xlsFrom April 2008, the proportion of part-time working men who could not find full-time employment increased to reach a maximum of 32.7% in the period March to May 2013. Since then, it has been on a downward trend.
The proportion of part-time working women who could not find full-time employment has always been lower than of men. Between July to September 2001 and April to June 2008, on average 6.4% of women who worked part-time could not find full-time jobs. From 1992, the proportion peaked to 13.6% in the three months to January 2012 and again in the three months to July 2013. Thereafter, the proportion has been on a downward trend.
Those who did not want full-time jobs
There were fewer women than men who could not find full-time jobs, partly because there were more women than men who did not want full-time jobs. In the three months to July 2019, the number of workers who worked part-time and did not want full-time jobs increased by 12,000 to reach 6.13 million. This group comprised 72.3% part-time workers.
Some of the reasons why people may not want full-time jobs include the need for work–life balance; desire for flexible working; commitment to lifestyle activities like leisure, family and hobbies; and easing into retirement. The last reason is more common among older workers than among younger workers. The change in state pension regulations means people are now working longer, and to protect the entitlement to full state pension, those who may feel like retiring before the statutory retirement age tend to work on a part-time basis to that age. For some workers, the cost and inadequacy of childcare facilities cause them to work part-time only.
One way of examining the numbers of part-time working people who could not find full-time jobs and those who did not want full-time jobs is to calculate a ratio of the numbers. The trend of the ratio of people who could not find full-time jobs to people who did not want full-time jobs is shown in Figure 4.
Figure 4: Since 2013, the ratio of people who could not find full-time jobs to those who did not want full-time jobs has been declining
Ratio of people who could not find or did not want full-time jobs, UK seasonally adjusted, March to May 1992 to May to July 2019
Source: Office for National Statistics – Labour Force Survey
Download this chart Figure 4: Since 2013, the ratio of people who could not find full-time jobs to those who did not want full-time jobs has been declining
Image .csv .xlsFigure 4 shows that the ratio of people working part-time who could not find full-time jobs to those who did not want full-time jobs reached a maximum of 0.281 in the period March to May 2013. The ratio has been declining since then. The fall was driven by increases in the number of people who did not want full-time jobs (from 5.22 million in the three months to May 2013 to 6.13 million in the three months to July 2019) and by decreases in the number of people who could not find full-time jobs (from 1.47 million in the three months to May 2013 to 890,000 in the three months to July 2019). People who could not find full-time jobs are part of the labour market slack that can be tapped when the labour market becomes tighter.
Those who were ill or disabled
The number of people who worked part-time because they were ill or disabled reduced by 6,000 on the quarter to 278,000 in the three months to July 2019. They constituted 3.3% of part-time workers. The number has been on an upward trend since July to September 2014. Before that, the trend was relatively flat. It is not possible to tell whether the upward trend is driven by illness or by disability (or joint occurrence of the two) or by discrimination against people with the two conditions in full-time employment.
Those who were students or at school
The number of students who worked part-time increased by 44,000 on the quarter to 1.12 million. They constituted 13.2% of part-time workers in the three months to July 2019. The number had a rather flat trend since 2006. Students may work on a part-time basis because they want to earn money and/or because they want to gain work experience and new skills.
Unemployment
The number of people aged 16 years and older who were unemployed reduced by 11,000 on the quarter to 1.29 million in the three months to July 2019. The unemployment rate remained unchanged at 3.8%.
The numbers of unemployed men and women reduced by 8,000 (to 710,000) and 2,000 (to 583,000) respectively over the same period. Although more men than women left unemployment, both male unemployment (4%) and female unemployment (3.6%) rates remained unchanged.
Economic inactivity
The level of economic inactivity among people aged 16 to 64 years increased by 6,000 to 8.59 million in the three months to July 2019. The inactivity rate remained unchanged at 20.8%.
Disaggregating economic inactivity by sex shows that the number of economically inactive men increased by 23,000 to 3.36 million (giving an economic inactivity rate of 16.4%) and the number of economically inactive women reduced by 17,000 to 5.22 million (giving an economic inactivity rate of 25.2%). Analysis of the gap between the male and female economic inactivity rates shows that the gap has been declining over time, as illustrated in Figure 5.
Figure 5: The gap between male and female economic inactivity rates have been falling
Economic inactivity rate gap, UK seasonally adjusted, March to May 1992 to May to July 2019
Source: Office for National Statistics – Labour Force Survey
Download this chart Figure 5: The gap between male and female economic inactivity rates have been falling
Image .csv .xlsThe economic inactivity rate gap amounted to 20 percentage points in the period March to May 1992. The gap narrowed to 9 percentage points in the period May to July 2019. The narrowing inactivity rate gap was driven by more women than men leaving economic inactivity and by a growing number of men becoming economically inactive.
Nôl i'r tabl cynnwys4. Average weekly earnings
Total average weekly pay increased by 4% on the year to reach £542 in July 2019
In the three months to July 2019, average weekly earnings showed robust growth. Total pay, which includes bonuses, increased by 4% on the year to reach £542. Total pay increased by a larger percentage (4.1%) in the private sector (to reach £541) than in the public sector (3.7%) even though public sector pay was higher (£546).
Comparing total pay growth by sector shows that the average pay growth in the construction sector (6.2%) was the highest, followed by that in the finance and business services sector (5.3%) and the total services sector (4.2%). The lowest total pay growth (2.4%) was recorded in the manufacturing sector, 0.4 percentage points behind the growth in the wholesaling, retailing, hotels and restaurants sector.
The finance and business services sector earned the highest amount (£697), followed by the construction (£652) and manufacturing (£614) sectors. The wholesaling, retailing, hotels and restaurants sector was paid the least (£364). This sector employs nearly a fifth of all workers in the economy. The performance of the sector is adversely affected by the decline in retail sales. The British Retail Consortium’s (BRC’s) retail sales monitor for August 2019 found that like-for-like sales fell by 0.5% in the year to August 2019 and total sales remained unchanged over the same period. Non-food like-for-like sales also declined by 3% in the year to August 2019. The BRC attributed the flattening in total sales to economic and political uncertainty in the country.
Regular average weekly pay increased by 3.8% to £507 in the year to July 2019
Regular average weekly pay, which excludes bonuses, increased by 3.8% on the year to reach £507. Regular pay in the private sector grew by 3.9% on the year to £499. In the public sector, regular pay grew by 3.5% on the year to £542.
In terms of regular pay, the construction sector was the highest-paid sector (£621), followed by the finance and business services sector (£612) and the manufacturing sector (£588). The reversal of the highest-paying position between total and regular pay shows the effect that bonus payments have on pay in the finance and business services sector. As with total pay, the least-paid sector was the wholesaling, retailing, hotels and restaurants sector (£342).
Despite the growth in both regular and total pay, the real terms values (that is, real regular pay and real total pay) that have been deflated with the Consumer Prices Index including owner occupiers’ housing costs (2015=100) still fall below the highest levels they reached in 2008. The real regular pay value of £470 in July 2019 was £3 less than the value reached in the period February to April 2008 (£473), as shown in Figure 6.
Figure 6: Real regular pay in July 2019 was still below the level reached in the first half of 2008
Real regular pay, Great Britain, January 2006 to July 2019
Source: Office for National Statistics – Monthly Wages and Salaries Survey
Download this chart Figure 6: Real regular pay in July 2019 was still below the level reached in the first half of 2008
Image .csv .xlsThe real total pay value of £502 was £23 less than the value reached in February 2008 (£525). Real regular pay growth was robust from April 2017 onwards. The growth in pay coupled with low inflation contributed to the growth in real pay. The growth in real pay may be the result of a tightening labour market. For instance, the strong pay performance of the construction sector may be linked to the shortage of workers in that sector. In the three months to July 2019, there were 24,000 vacancies in the construction sector.
Nôl i'r tabl cynnwys5. The flow of labour between labour market statuses
The Office for National Statistics publishes labour market flows four times a year. The flows data show how people shift between labour market statuses of employment, unemployment and economic inactivity. Labour flows provide insight into the churning that drives the changes in the headline labour market figures in the reference period.
People in employment can be classified as employees or as self-employed. Such disaggregation makes it possible to examine what has been driving the growth in being self-employed in the economy, as shown in Figure 7.
Figure 7 summarises the quarterly flows between the first (Jan to Mar) and second (April to June) quarters of 2019. The straight arrows show the direction of flows between labour market statuses. The curved arrows show the direction of net flows. The numbers of employed, economically inactive, self-employed and unemployed people indicate the number of people in each labour market status who did not change labour market status in the first two quarters of 2019.
Figure 7: Self-employed was a net destination of worker flows from other labour market statuses
Net flows into self-employed status, thousands, UK, January to March to April to June 2019

Source: Office for National Statistics – Labour Force Survey
Download this image Figure 7: Self-employed was a net destination of worker flows from other labour market statuses
.png (38.0 kB)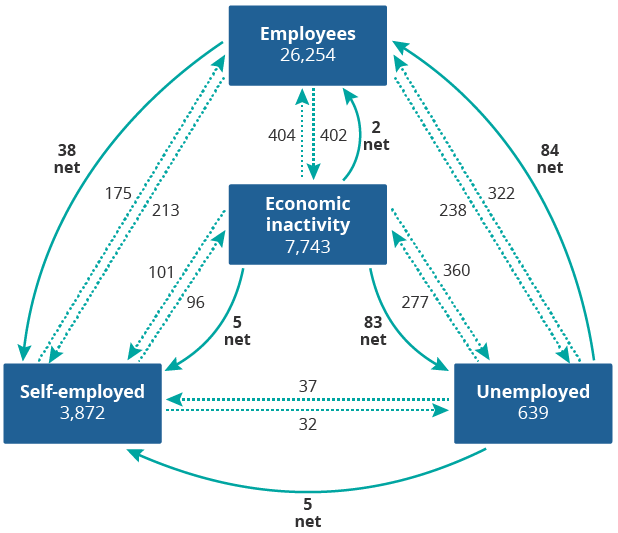
Between the first and second quarters of 2019, approximately 2.66 million people changed labour market status. This was an increase of 106,000 moves over the previous year. The largest outflow was from economic inactivity (865,000), followed by that from employee status (853,000). The statuses that had the largest inflows were the employee status (901,000) and the economic inactivity status (776,000). The two statuses also had the largest flows (inflows and outflows) between each other.
In the three months to June 2019, there was a net outflow from unemployment into employment, with more people joining employee status (84,000) than self-employed status (5,000). The employee and self-employed statuses had net inflows of 48,000 each during the same period.
In the three months to June 2019, 213,000 workers changed employment status from employee to self-employed. Over the same period, 101,000 workers left economic inactivity and 37,000 left unemployment for self-employed status.
Considering source and destination statuses, we observe that 47% of the workers who left the employee status became economically inactive. The second main source of people who became economically inactive was those who were unemployed (43%). Most of the people who left the self-employed status (58%) became employees. The same applied to those who left the unemployed (51%) and economically inactive (47%) statuses.
Figure 7 shows that the self-employed status was a net destination of workers from the employee (38,000), economically inactive (5,000) and unemployed (5,000) statuses. The net inflow into self-employed was equivalent to that into the employee category (48,000).
There were net flows into self-employed from the period April to June 2013 onwards (except for the period October 2018 to March 2019) as shown in Figure 8. This is partly the reason why the self-employed status has been growing in the economy.
Figure 8: Self-employment was a net destination of worker flows from other labour market statuses
Net flows into self-employment, UK, July to September 2005 to April to June 2019
Source: Office for National Statistics – Labour Force Survey
Notes:
- Please note: 11 September 2019: the chart title was changed to reflect the data more accurately.
Download this chart Figure 8: Self-employment was a net destination of worker flows from other labour market statuses
Image .csv .xlsIn the three months to July 2019, self-employed status accounted for 15% of total employment. The number of self-employed workers increased by 15,000 on the quarter to 4.9 million. The number of self-employed men reduced by 14,000 on the quarter to 3.3 million, and that of women increased by 28,000 to 1.7 million over the same period.
There are many reasons why workers become self-employed, as discussed in our labour market economic commentary for May 2019. During the economic downturn, overall employment declined but self-employment increased. The fall in the number of vacancies during the downturn may have acted as a drive for people to become self-employed.
The analysis of economic inactivity shows that 90,000 people left economic inactivity for other labour market statuses. This means more people joined than left the labour force. In the three months to June 2019, the largest economic inactivity net flow was from economic inactivity to unemployed (83,000), followed by the net flow into self-employed (5,000) and into employee (2,000) statuses. Figure 9 shows economic inactivity net flows for the second quarters of each year since 2006. It shows that the largest net outflow from economic inactivity was recorded in 2012.
Figure 9: Economic inactivity has been reducing every second quarter of the year (April to June) since 2010
Economic inactivity net flows, April to June, 2006 to 2019
Source: Office for National Statistics – Labour Force Survey
Notes:
- Please note: 11 September 2019: the chart title was changed to reflect the data more accurately.
Download this chart Figure 9: Economic inactivity has been reducing every second quarter of the year (April to June) since 2010
Image .csv .xlsThe stock of economic inactivity has been declining since 2010. The stock consisted of people who were economically inactive from one quarter to another. In the three months to June 2019, that stock of economic inactivity declined by 84,000 to 7.74 million.
From Figure 9 we can see that economic inactivity had net outflows of workers since the second quarter of 2010. Disaggregating the outflows by destination of the workers to show the statuses they went into, we see that between 2008 and 2016, more people left economic inactivity into unemployed than into any other status (Figure 10). Thereafter, most people left economic inactivity to become employees. There was a steady and gradually increasing trend of people leaving economic inactivity for self-employed status.
Figure 10: Large numbers of workers left economic inactivity for unemployed and employee statuses
Destinations of net flows from economic inactivity, UK, April to June 2006 to April to June 2019
Source: Office for National Statistics – Labour Force Survey
Download this chart Figure 10: Large numbers of workers left economic inactivity for unemployed and employee statuses
Image .csv .xlsThere have been outflows from low- to medium- and high-skilled jobs
The Office for National Statistics’s analysis of low and high pay in the UK in 2018 showed that from 2013 onwards, the percentage of low-paid employee jobs by hourly earnings was on a downward trend. The decline was partly a result of the movement of workers from low- to medium- and high-skilled jobs. The most recent estimates of labour market flows data show that between 2010 and the first quarter (Jan to Mar) of 2019, there were net inflows into high- and medium-skilled jobs. Over the same period, there were net outflows from low-skilled jobs, as shown in Table 1. The net flows (for example, +17,000 high-skilled jobs in 2007) represent the difference between inflows and outflows in the three months to June compared with the previous quarter (Jan to Mar) in each year.
| Year | Quarterly Inflows | Quarterly Outflows | Quarterly Net flows | |
|---|---|---|---|---|
| High-skilled jobs | 2007 | 239,000 | 222,000 | 17,000 |
| 2010 | 198,000 | 175,000 | 23,000 | |
| 2015 | 238,000 | 237,000 | 1,000 | |
| 2019 | 290,000 | 298,000 | -8,000 | |
| Medium-skilled jobs | 2007 | 244,000 | 215,000 | 29,000 |
| 2010 | 144,000 | 140,000 | 4,000 | |
| 2015 | 214,000 | 181,000 | 33,000 | |
| 2019 | 236,000 | 189,000 | 48,000 | |
| Low-skilled jobs | 2007 | 224,000 | 263,000 | -39,000 |
| 2010 | 131,000 | 153,000 | -22,000 | |
| 2015 | 220,000 | 242,000 | -22,000 | |
| 2019 | 209,000 | 241,000 | -32,000 |
Download this table Table 1: There were net flows into medium- and high-skilled jobs and net outflows from low-skilled jobs
.xls .csvThe table shows that all flows increased over time for all skill levels. The dynamism has been pushing the economy towards medium- and high-skilled jobs. These changes have important implications for career choices and education and training in the country. Despite the structural skills change, there remain skills shortages distributed across the whole skills spectrum. For instance, the construction sector has been reporting facing skills shortages. The Department for Education’s Employer Perspectives Survey 2016 report discussed the skills challenges faced by UK employers within their workforces and when recruiting. The Edge Foundation’s April 2019 Bulletin discussed skills shortages in the UK economy. The analysis focused on the hospitality industry and found that the industry routinely has more than 100,000 unfilled vacancies. It is also characterised by a high number of hard-to-fill vacancies.
Given the high correlation between skill level and remuneration, these changes are expected to have reduced the number of people on low pay. In fact, the churning movements contributed to the decrease in the number of low-hourly paid jobs.
Nôl i'r tabl cynnwys