1. Main points
The employment rate in the UK reached a record high of 75.6% between January and March 2018.
The UK unemployment rate stood at 4.2% in the three months to March 2018. This is 0.2 percentage points below the October to December 2017 figure.
The youth unemployment rate declined; it was higher for men than for women, but the difference between the rates has been narrowing.
Between the last quarter of 2017 and the first quarter of 2018, there was a net inflow into employment, a net outflow from unemployment and a net outflow from inactivity.
The number of people changing jobs declined by 254,000 in the first quarter of 2018.
2. Employment
The latest estimates from the Labour Force Survey show that the number of people in employment increased by 197,000 to a record high of 32.34 million in the three months to March 2018. Consequently, the employment rate increased by 0.4 percentage points when compared with the three months to December 2017, and by 0.8 percentage points when compared with the same period a year ago.
Figure 1: Unemployment and employment rate
UK, seasonally adjusted, January to March 2006 to January to March 2018
Source: Office for National Statistics, Labour Force Survey
Download this chart Figure 1: Unemployment and employment rate
Image .csv .xlsFigure 1 shows that quarter-on-quarter, the employment rate continues to increase, while the unemployment rate continues to decline.
Breaking down the employment data by sex shows that the employment of men increased by 90,000 to reach a record high of 17.1 million in the three months to March 2018. During the same period, the employment of women increased by 108,000 to reach a record high of 15.2 million.
The employment level for all age groups increased in the first quarter of 2018. The increase in employment was mainly driven by the age groups 35 to 49 years and 50 to 64 years, which experienced increases of 65,000 and 76,000 respectively when compared with the fourth quarter of 2017.
The number of people working part-time increased by 64,000 to 8.6 million in the first quarter of 2018. Similarly, the number of people working full-time increased by 133,000 on the quarter to 23.75 million. The number of employees increased by 271,000 quarter-on-quarter to a record high of 27.43 million.
In the March edition of the labour market commentary we observed that the overall number of self-employed started to fall after a period of prolonged growth. This trend continued in the first quarter of 2018: the number of self-employed fell by 33,000 to 4.75 million. Breaking down the decrease in total self-employment shows that the number of full-time self-employed fell while the number of part-time self-employed increased.
Nôl i'r tabl cynnwys3. Unemployment and inactivity
As employment increased, the level of unemployment declined. The unemployment rate stood at 4.2% in the three months to March 2018, down 0.2 percentage points from the previous quarter. The number of unemployed people fell by 46,000 to 1.43 million.
The rate of inactivity reached a record low of 21% in the three months to March 2018. The level of inactivity among women fell by more than that of men, with the overall effect being a fall of 115,000 on the previous quarter.
The record low rate of inactivity was driven by the fall in inactivity among non-UK nationals in recent years. Within this group, inactivity among the EU27 nationals fell by 49,000 while that of non-EU workers fell by 65,000 when compared with the same period in 2017. The level of inactivity among UK nationals fell by 68,000 during the same time period.
Nôl i'r tabl cynnwys4. Youth unemployment
One interesting trend in the labour market is that of youth unemployment. The youth unemployment rate, as defined by the Organisation for Economic Co-operation and Development (OECD), captures the proportion of unemployed people in the labour force aged 15 to 24 years . In the UK, entry into the labour market starts at 16 years old. Figure 2 shows that the youth unemployment rate is consistently lower for women than it is for men. Much of the unemployed youth are aged between 18 and 24 years. In the three months to March 2018, the number of unemployed people in the 16- to 17-year-old age group was 124,000, and that of those in the 18- to 24-year-old age group was 407,000. What we see in the latest period is a narrowing of the gap between the youth unemployment rates of men and women. For instance, the youth unemployment rate of men was 7 percentage points higher than that of women in the period December to February 2012. The gap narrowed to 2 percentage points in the first quarter of 2018.
Figure 2: The trend of youth unemployment
UK, seasonally adjusted, January to March 2006 to January to March 2018
Source: Labour Force Survey, Office for National Statistics
Download this chart Figure 2: The trend of youth unemployment
Image .csv .xlsThe youth unemployment rates of women and men averaged 12.4% and 15.9% respectively between January to March 2006 and January to March 2008. The unemployment rates fell to 11% and 14.2% respectively in the two most recent years between January to March 2016 and January to March 2018, and they are now below their pre-downturn levels.
One possible observation in the labour market is that there appears to be considerable slack in the youth labour market in the UK. For instance, in the January labour market commentary, we saw that employers were not finding it particularly difficult to fill vacancies. As well as this, the UK has a higher youth unemployment rate when compared with countries like Japan, the US and Germany. Furthermore, in the three months to March 2018, the UK youth unemployment rate was much higher than the unemployment rates for older age groups. The 35 to 49 years age group experienced an unemployment rate of 2.7% compared with a rate of 12.1% for the 16 to 24 years age group. Despite this, the UK has lower youth unemployment than some European countries like Poland (14.8%), France (22.3%) and Italy (34.8%).
Notes for: Youth unemployment
- Entry into the labour force starts at 16 in the UK, therefore only those aged between 16 and 24 years old have been included.
5. Labour market flows
One important feature of the labour market flows is the indication of changing skills composition of employment. The trend since the first quarter of 2006 is that the net quarterly flow of low-skilled jobs has been positive in only five quarters, otherwise the low-skilled jobs were declining. The net quarterly flow of high-skilled jobs declined in only six quarters, while that of medium-skilled jobs declined in nine quarters during the same period.
In 2017, there was a net positive average growth in medium- and high-skilled jobs. This was accompanied by a net decline in low-skilled jobs. These changes indicate increasing movement from low-skill into high-skill jobs. Low-skilled jobs declined by a net figure of 6,000 jobs in the first quarter of 2018. In the same period, high-skilled jobs increased by a net figure of 11,000 and medium-skilled jobs declined by a net figure of 5,000 jobs. The changes in job skills indicate that there is expansion of high-skill jobs and contraction of low-skill jobs. In fact, since the third quarter of 2016, the number of low-skill jobs declined in every quarter.
Net flows between labour market statuses
Another dimension of labour market dynamics is the churning of people between the three labour market statuses (employment, unemployment and inactivity (or non-participation)). The study of labour market flows is important because aggregate labour market indicators are driven by the behaviour of the flows. For instance, job separation and engagement rates explain the variations in employment and unemployment.
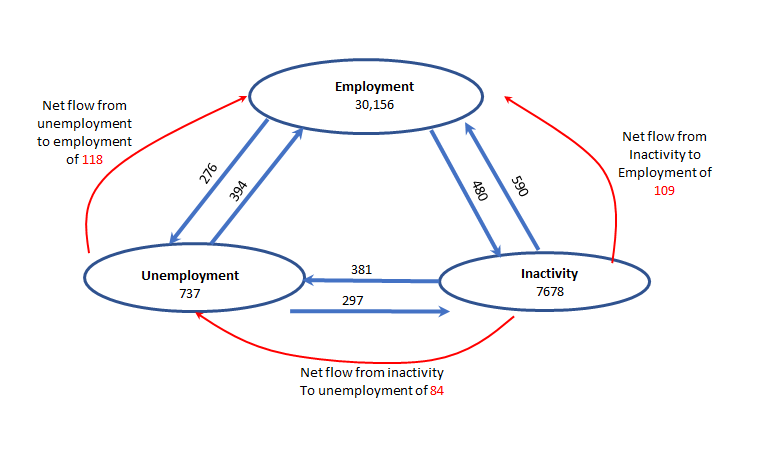
This section examines the size of the flows between the statuses. Figure 3 shows a summary of the flow rates between the fourth quarter of 2017 and the first quarter of 2018. The arrows point the direction of the flows. The curved arrows show the direction of the net flow.
Figure 3: Labour market flows
UK, seasonally adjusted, thousands, age 16 to 64 years, October to December 2017 to January to March 2018
Source: Office for National Statistics
Notes:
- The figures may not add up due to rounding.
Download this image Figure 3: Labour market flows
.png (35.4 kB) .png (35.4 kB)
The figure shows the average quarterly gross labour flows between the fourth quarter of 2017 and the first quarter of 2018. The employment, unemployment and inactivity figures indicate the number of people who did not change their labour market statuses between the two quarters. For instance, 30.156 million people who were in employment in the fourth quarter of 2017 remained in employment in the first quarter of 2018.
The arrows indicate the flows into and out of the different labour market statuses. For instance, 276,000 people that were in employment in the fourth quarter of 2017 became unemployed in the first quarter of 2018; and 480,000 people that were in employment in the fourth quarter of 2017 joined inactivity in the first quarter of 2018.
The differences between the corresponding arrow totals give the net flows between any two labour market statuses. Figure 4 shows the trend of employment net flows between 2006 and the first quarter of 2018.
Figure 4: Net employment flows
UK, seasonally adjusted, October to December 2006 to January to March 2018
Source: Office for National Statistics
Download this chart Figure 4: Net employment flows
Image .csv .xlsBetween the fourth quarter of 2017 and the first quarter of 2018, there was a positive net flow into employment of 228,000 people. This was driven by a net flow from inactivity of 109,000, and a net flow from unemployment of 118,000. Of all the people who were in employment in the last quarter of 2017, 0.9% changed status into unemployment, and 1.6% changed status into inactivity. The small change in employment between the last quarter of 2017 and the first quarter of 2018 indicates a high degree of employment persistence.
The changes to employment and unemployment statistics are in part explained by the rate of disengagement from work. People leave their jobs for various reasons. The flows data show that the main reasons for people leaving employment were resignations, dismissals and redundancies, retirement or giving up work, and “other reasons”. Figure 5 and Figure 6 show these reasons on a quarter-by-quarter basis.
Figure 5 shows that there was a decrease in the number of people who moved jobs, from 888,000 in the fourth quarter of 2017 to 634,000 in the first quarter of 2018. The largest number of people left their jobs for “other reasons” (319,000), followed by resignations (256,000). The number of resignations increased throughout 2017, but they declined in the first quarter of 2018.
Figure 5: People changing jobs
UK, not seasonally adjusted, Quarter 3 (July to Sept) 2013 to Quarter 1 (Jan to Mar) 2018
Source: Office for National Statistics
Download this chart Figure 5: People changing jobs
Image .csv .xlsFigure 6 shows that the number of people retiring or giving up work decreased from 21,000 in the fourth quarter of 2017 to 20,000 in the first quarter of 2018. During the same period, the number of dismissals decreased from 49,000 to 40,000. Overall, the number of people that changed jobs decreased by 254,000 on the quarter.
Figure 6: People moving out of employment
UK, not seasonally adjusted, Quarter 3 (July to Sept) 2013 to Quarter 1 (Jan to Mar) 2018
Source: Office for National Statistics
Download this chart Figure 6: People moving out of employment
Image .csv .xlsSome of the people who moved out of employment joined unemployment. Of the people who were unemployed in the last quarter of 2017, 50.9% remained unemployed in the first quarter of 2018. The rest were churned into employment and into inactivity. Figure 7 shows the trend and net flows into unemployment between 2006 and the first quarter of 2018. There was a net outflow of 35,000 from unemployment in the first quarter of 2018.
Figure 7: Net unemployment flows
UK, seasonally adjusted, October to December 2006 to January to March 2018
Source: Office for National Statistics
Download this chart Figure 7: Net unemployment flows
Image .csv .xlsOf the people who were unemployed in the last quarter of 2017, 691,000 changed status, with movement into employment (394,000) and into inactivity (297,000). More people moved from unemployment to employment than to inactivity. Overall, the decrease in unemployment was smaller than the decrease in inactivity.
There was a net outflow from inactivity of 193,000 between the fourth quarter of 2017 and the first quarter of 2018. More people left inactivity into employment (590,000) than left employment into inactivity (480,000). The same applied to flows between inactivity and unemployment. Figure 8 shows the trend of inactivity flows between 2007 and the first quarter of 2018.
Figure 8: Net inactivity flows
UK, seasonally adjusted, January to March 2007 to January to March 2018
Source: Office for National Statistics
Download this chart Figure 8: Net inactivity flows
Image .csv .xlsFor every 100 people that were inactive in the last quarter of 2017, on average, seven could expect to become employed, while four could expect to become unemployed in the first quarter of 2018. There was also high persistence of inactivity between the quarters.
The number of people who remained in Inactivity was at its highest in July to September 2011 when 8.5 million people remained in inactivity. From the existing data, it is not possible to establish the reasons why people have increasingly been joining the labour market from inactivity.
Nôl i'r tabl cynnwys