1. Main points
The unemployment rate rose by 0.1 percentage points on the previous quarter to 4.4% in the three months to December 2017.
The number of people in employment rose by 88 thousand to 32.15 million in October to December 2017, when compared with the previous quarter.
In contrast to 2016, the annual net change in the number of people in work in 2017 was driven by an increase in UK-born workers and UK nationals.
Between 2015 and 2017, the growth in employment was most pronounced in higher-skilled occupations such as associate professional, professional and managerial occupations.
Higher-skilled occupations also exhibited relatively high growth in part-time employment, in contrast to most other occupation groups.
2. Unemployment
Latest estimates from the Labour Force Survey show that following a period of a continuous decline, the number of unemployed people increased by 46,000 to 1.47 million in the three months to December 2017 when compared with July to September 2017. As a result, the unemployment rate rose by 0.1 percentage points to 4.4% in the three months to December 2017, compared with the three months to September 2017.
Approximately two-thirds of the net increase in unemployment can be attributed to the people in the younger age groups, namely 16 to 17 and 18- to 24-year-olds. On the one hand, these age groups exhibit higher volatility. On the other, the direction of the change was consistent across all age groups, which raises a question of whether unemployment reached its minimum and will either grow or remain at a broadly stable level in 2018. It is worth remembering that the unemployment rate is still 0.4 percentage points lower than in the three months to December 2016.
Figure 1: Quarterly changes in unemployment
UK, seasonally adjusted, October to December 2006 to October to December 2017
Source: Office for National Statistics, Labour Force Survey
Download this chart Figure 1: Quarterly changes in unemployment
Image .csv .xls3. Employment
Despite the slight rise in unemployment, employment continued to grow. In the three months to December 2017, there were 32.15 million people in work, which was 321,000 more than for the same period a year earlier and 88,000 more than the previous quarter. This increase was driven by full-time employees, whose number rose by 136,000 to 20.20 million in the three months to December 2017, when compared with the previous quarter. In contrast with the overall growth in employment, the number of employees working part-time fell by 51,000 during the same period. The decreasing part-time employment was concentrated in specific groups of occupations rather than felt by the entire labour market. A more detailed analysis can be found in section 7.
While employment increased, the total number of self-employed workers continued to fall. The net fall of 31,000 compared with the previous quarter includes a 41,000 decrease in the number of full-time self-employed, and a positive change in part-time self-employment. In other words, the working patterns among the self-employed exhibit the opposite trend to that seen among the employees. Overall, the number of people in self-employment was 18,000 lower compared with the same period a year earlier. It may be early to speculate whether this indicates the end of a period of prolonged growth in self-employment, as it is not uncommon for self-employment to be lower in some quarters before continuing to grow.
Figure 2: Employment and unemployment rate
UK, seasonally adjusted, October to December 2001 to October to December 2017
Source: Office for National Statistics, Labour Force Survey
Download this chart Figure 2: Employment and unemployment rate
Image .csv .xls4. Employment by nationality and country of birth
A rather expected development in the labour market over the course of 2017 was a slowdown in the growth of the number of the EU workers. At this point it is worth stressing that these data do not show recent migration. Nor do they show new jobs. Rather, the figures show the net effect of people entering employment less the people leaving employment, in each of the categories by nationality. The number of people entering or leaving employment is much larger than the net changes.
There are two established ways to identify workers in the workforce – by nationality and by country of birth. Both have limitations and the choice of either metric depends on the purpose of the analysis. For instance, the population of UK nationals include those who, having initially migrated to the UK, acquired UK citizenship. By contrast, the population of non-UK workers by country of birth includes UK citizens born abroad. Additionally, non-EU nationals were more likely to acquire the UK citizenship during their stay in the country than workers from EU countries, whose citizenship entitles them to living and working in the UK.
Figure 3: Changes in employment by nationality (annual average)
UK and Europe, non-seasonally adjusted, 2006 to 2017
Source: Office for National Statistics, Labour Force Survey
Notes:
The total series includes people who do not state their nationality.
EU14 Includes Austria, Belgium, Denmark, Finland, France, Germany, Greece, Ireland, Italy, Luxembourg, Netherlands, Portugal, Spain and Sweden.
EU8 includes Czech Republic, Estonia, Hungary, Latvia, Lithuania, Poland, Slovak Republic and Slovenia.
EU2 includes Romania and Bulgaria.
EU other consists of Cyprus, Croatia and Malta.
The estimates shown in this table relate to the number of people in employment and should not be used as a proxy for flows of foreign migrants into the UK.
Download this chart Figure 3: Changes in employment by nationality (annual average)
Image .csv .xlsIn the three months to December 2017, the number of workers in the EU8 countries by nationality fell slightly compared with the same three months in 2016, from 1.015 million to 961 thousand (1.033 million to 995 thousand respectively by country of birth). The number of workers in EU14 continued increasing, albeit at a slower pace than before. Figure 3 shows the average annual change in the number of workers (quarterly estimates are subject to seasonality). The most interesting observation is that in 2017, just around a quarter of the net increase in employment came from the workers born in the EU. Just a year earlier, the share of EU-born workers exceeded 54%.
There tend to be wage differentials between domestic workers and the workers moving from other countries. It is often the case that workers from the countries with lower income levels could be willing to accept lower wages for the same skill content of a job than domestic workers. In that sense, the relatively higher net increase in the number of UK employees (by nationality and country of birth) accompanied by a slowdown in growth of the number of employees from the lower-income countries seen in the data might eventually push the median wage higher. Yet the real situation is significantly more complicated. Our earlier analysis showed that there exist significant differences between the skills, age profile, and occupations of UK and non-UK nationals in the workforce. In this context, it is also important to consider the wider characteristics of both the jobs being created, and the people occupying those positions – in other words, the composition effects.
Nôl i'r tabl cynnwys5. Employment by occupation
The observed failure of the long period of low unemployment (despite the rise in October to December 2017, it remains very low) to be transmitted into higher wage growth raised the question about the possible role of the composition effects. The structure of the economy matters. When the growth in the number of jobs is concentrated in the industries that are generally associated with lower wages, one could expect the pressure on the average wage to be downward, despite fewer people looking for jobs. In the Labour Market Economic Commentary: November 2017, we explored the relationship between wages and employment across a number of industries. The analysis showed that between June 2016 and June 2017, most jobs have been created in the sectors with relatively weakly performing median wages.
Wages tend to respond to the situation in the wider labour market with a noticeable time lag. It is also important to understand that the structural changes themselves may be accumulating gradually and are unlikely to cause sudden shocks to headline statistics. For this reason, one needs to consider changes in the composition of the labour market at least several quarters before the period of interest. Finally, some of the data presented in this commentary are not seasonally adjusted, meaning that the influx of seasonal workers into the groups associated with predominantly lower wages, such as agricultural workers, makes quarter-on-quarter comparisons far less informative than an assessment of the longer-term dynamics.
This month’s commentary supplements the earlier industrial analysis by encompassing personal characteristics of those in employment as well as the type of job. Unlike the industrial classification, occupational classification accounts for skill level and skill content of the job, so that each major occupational group is associated with a certain general level of qualifications, training and experience. The advantage of using the occupational classification is that over time, technological changes may rebalance the composition of the labour force within a given industry. For instance, a higher skill level may be required to operate the new machinery or IT systems; or indeed, the opposite may also be true whereby automation could reduce the need for specialist skills.
Figure 4: Employees by occupation
UK, Non-seasonally adjusted, January to March 2006 to October to December 2017
Source: Office for National Statistics, Labour Force Survey
Download this chart Figure 4: Employees by occupation
Image .csv .xlsFigure 4 shows the total number of employees in each major occupation group from January to March 2006. The number of employees associated with the lower skill levels has not risen above the pre-downturn level, despite the overall growth in the number of employees. A similar observation can be made in the shorter term, given that the more recent periods would be more informative in the context of wage growth. Still, the data corresponding to 2015, 2016 and 2017 do not support the hypothesis that the overall growth in the number of employees was dominated by lower-skill occupations. On the contrary, the growth in employment appears to have been more pronounced among associate professional and professional, and managerial occupations, which exhibited overall growth of 6.62% across the three categories combined, between 2015 and the end of 2017. These occupations tend to be associated with higher wages but not necessarily higher growth in wages.
Figure 5: Average annual change in gross earnings of full-time employees per occupation
UK, 2015 to 2017
Source: Office for National Statistics, Monthly Wages and Salaries Survey
Download this chart Figure 5: Average annual change in gross earnings of full-time employees per occupation
Image .csv .xlsFigure 5 confirms that the average gross weekly earnings for skilled trades, associate professional and professional occupations over the three-year period grew at a slower pace than on average for all employees. On the other hand, those in elementary occupations; process, plant and machine operatives; sales and customer services, and caring, leisure and other services saw a proportionately higher average wage increase between January 2015 and December 2017. This can be partly explained by a larger proportion of people who benefitted from the rise of the National Minimum Wage and the introduction of the National Living Wage in these occupations.
So, rather than the growth in the number jobs being skewed towards lower skill occupations, the increase in gross wages was weaker among the faster growing, higher skilled occupational groups. This observation is consistent with the distributional analysis of the annual survey of household earnings (ASHE), which has been conducted on individual level data.
Nôl i'r tabl cynnwys6. Employment by socio-economic characteristics
A similar picture emerges when people in employment are categorised according to their socio-economic status. While the occupational classification presented in section 5 focuses on skill level of individual and skill content of the job, the socio-economic classification seeks to measure employment relations and conditions of occupations.
Figure 6: People in employment by socio-economic characteristics
UK, non-seasonally adjusted, July to September 2011 to October
Source: Office for National Statistics, Labour Force Survey
Download this chart Figure 6: People in employment by socio-economic characteristics
Image .csv .xlsThe relative position of the socio-economic statuses on the chart should not be viewed as a hierarchy. However, looking broadly at the groups of similar socio-economic characteristics from January to March 2015, the chart does not support an idea of sustained rise in the proportion of people generally associated with lower statuses. Consistent with Figure 4, an increase, although very slight, is noticeable among individuals holding managerial and professional status, whose share in total employment increased from 41.9% to 42.6% between January to March 2015, and October to December 2017.
Nôl i'r tabl cynnwys7. Employment by working pattern
Finally, it is useful to look beyond the headline statistics for the working pattern in each major occupation group. Of course, part-time workers are far more prevalent in some occupations than others. For example, there are proportionally more part-time workers in elementary occupations, which include many agricultural workers, than there are among managers, directors and senior officials (in fact, the part-time pattern is the least common among process, plant and machine operatives). So rather than the prevalence as such, it is useful to consider the change in the number of part-time employees, relative to total change in employment, within each occupational group.
Figure 7: Average yearly change in part-time and full-time employees by occupation
UK, non-seasonally adjusted, January to March 2015 to October to December 2017

Source: Office for National Statistics, Labour Force Survey
Download this image Figure 7: Average yearly change in part-time and full-time employees by occupation
.png (23.7 kB) .xls (24.6 kB)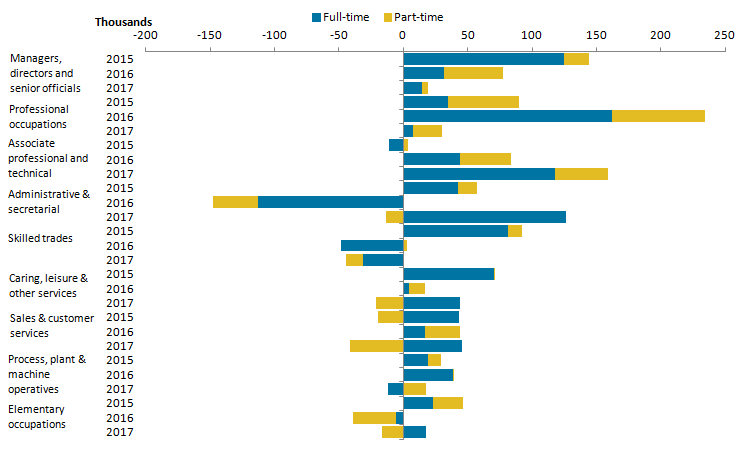
Quite interestingly, the occupations characterised by a relatively higher growth in part-time employment (compared to the change in total employment) are also found among the higher skill end of the spectrum. Furthermore, in 2017, when the number of part-time employees declined across a broad range of occupations, it nonetheless kept steady or even increasing in professional and associate professional occupations. This observation is consistent with the change in earnings shown in figure 5, whereby the same occupation groups exhibited relatively slow wage growth. It would of course be incorrect to attribute that to changes in the working pattern alone – as explained earlier, the groups characterised by higher skill are also less sensitive to the change in the National Minimum Wage and the National Living Wage and would have multiple other structural differences, which are explored in the distributional analysis of the Annual Survey of Hours and Earnings and the Analysis of factors affecting earnings using Annual Survey of Hours and Earnings articles.
Nôl i'r tabl cynnwys