1. Main points
The level of employment increased by 79,000 on the quarter to a record high of 32.48 million in the three months to October 2018.
The level of unemployment increased by 20,000 to 1.38 million; this was a second quarterly increase since the period November to January 2018.
Economic inactivity decreased by 95,000 to 8.66 million; this was the first quarterly decrease since the period March to May 2018.
Regular average weekly earnings increased by 3.3% on the year to reach £495 in October 2018.
The ratio of private to public sector average weekly earnings has been increasing, which indicates that the gap between private and public sector earnings is narrowing.
2. Employment
The latest Labour Force Survey (LFS) shows that the number of employed people increased by 79,000 in the three months to October 2018 to reach a total of 32.48 million. The number of employed people increased by 396,000 in the year to October 2018.
In the three months to October 2018, the employment rate increased by 0.2 percentage points to 75.7%.
More men than women joined employment, and the number of employees reached a record high
Classifying people in employment by sex shows that the number of employed men increased by 70,000 to a record high of 17.24 million in the three months to October 2018. The number of employed women increased by 9,000 to 15.24 million over the same period. The employment rates for both men and women increased by 0.2 percentage points apiece to 80.3% and 71.2% respectively.
People in employment (excluding unpaid family workers and people on government-supported training and employment programmes) can be categorised as employees or self-employed. The latest estimates show that the number of employees in the UK increased by 115,000 to reach a record high of 27.54 million in the three months to October 2018. The number of self-employed people fell by 29,000 to 4.77 million over the same period.
More men than women joined full-time employment, and the number of women in part-time employment reduced
People in employment can be classified as working on a full-time or part-time basis. The number of full-time workers increased by 110,000 on the quarter to reach a record high of 23.97 million in the three months to October 2018. Disaggregating the number of full-time workers by sex shows that the number of men working on a full-time basis increased by 63,000 to 14.94 million, and that of women increased by 47,000 to 9.03 million.
The number of part-time workers declined by 31,000 to 8.51 million over the same period. The decline was driven by a 38,000 fall in the number of women in part-time employment to 6.22 million. However, the number of men in part-time employment increased by 7,000 to 2.29 million. Figure 1 shows the trends of full-time and part-time workers in the economy.
Figure 1: Full-time and part-time employment
UK, seasonally adjusted, January to March 2006 to August to October 2018
Source: Office for National Statistics, Labour Force Survey
Download this chart Figure 1: Full-time and part-time employment
Image .csv .xlsFigure 1 shows that the number of people who worked on a full-time basis increased from the period February to April 2010 onwards. Although part-time employment increased throughout the downturn period, it plateaued off from the period June to August 2016 onwards.
Nôl i'r tabl cynnwys3. Unemployment
The latest unemployment data in the UK show that the number of unemployed people aged 16 years and older increased by 20,000 to 1.38 million in the three months to October 2018.
The number of unemployed men increased and the number of unemployed women decreased
Disaggregating the unemployment data by sex shows that the number of unemployed men increased by 27,000 to 747,000 in the three months to October 2018. The number of unemployed women fell by 8,000 to 633,000 over the same period. These changes did not have a substantial impact on the overall unemployment rate, which remained unchanged at 4.1%. Figure 2 shows the levels of unemployment among men and women.
Figure 2: Unemployment level by men and women
UK, seasonally adjusted, January to March 2006 to August to October 2018
Source: Office for National Statistics, Labour Force Survey
Download this chart Figure 2: Unemployment level by men and women
Image .csv .xlsFigure 2 shows that over the whole period, more men than women were unemployed. It also shows that men have been leaving unemployment at a faster rate than women, and that there was an uptick in the number of unemployed men from May to July 2018 onwards.
Nôl i'r tabl cynnwys4. Inactivity
The level of economic inactivity in the UK fell by 95,000 to 8.66 million in the three months to October 2018. The decrease in the number of economically inactive people was driven by a 73,000 fall in the number of people who were in long-term sickness to 1.97 million. The decrease in the number of economically inactive people resulted in the inactivity rate falling by 0.2 percentage points to 21.0%.
The economically inactive people can be categorised by sex. The number of women classified as economically inactive fell by 28,000 to 5.35 million in the three months to October 2018. The number of economically inactive men decreased by 67,000 to 3.31 million over the same period.
Nôl i'r tabl cynnwys5. Average weekly earnings
Earnings from employment are an important variable in labour market analysis. They constitute the main source of income for many households. There are many factors that determine employment earnings, including level of education and experience. In some cases, the government intervenes in the labour market by setting minimum wages. For instance, the UK government introduced a mandatory national living wage for workers aged 25 years and older from April 2016.
The analysis of earnings helps us to understand the reasons behind the persistence of the gender pay gap. Gaps in earnings may be associated with other factors like ethnicity, age, sexual orientation and disability status.
Our employment earnings analysis is based on average weekly earnings (AWE) paid to workers in Great Britain. The average weekly earnings measure the amount of money paid to each worker per job per week, excluding benefits in kind, unearned income and arrears of pay. The estimates exclude earnings of people who are self-employed, and are calculated before tax and other deductions. Average weekly earnings can either be regular pay (which excludes bonus income) or total pay (which includes bonus income). We focus our analysis on regular pay.
Regular average weekly earnings increased in the year to October 2018
The average weekly earnings are published monthly. The percentage increase of average earnings is calculated as a three-month average figure of the increases in the average seasonally adjusted values for the three months ending with the relevant month compared with the same period a year earlier. Regular average weekly earnings increased by 3.3% on the year to reach £495 in October 2018.
We can analyse regular average weekly earnings in the private and public sectors separately. The private sector regular average weekly earnings increased from £471 in October 2017 to £488 in October 2018. The public sector regular average weekly earnings increased from £514 in October 2017 to £528 in October 2018.
Public sector regular average earnings have been higher than private sector earnings since records began. One of the reasons for this difference is that the public sector has a higher proportion of high-skilled workers than the private sector. Also, the private sector has a higher proportion of low-skilled workers than the public sector. Our analysis of the Annual Survey of Hours and Earnings (ASHE) data provides a deeper examination of the differences between the private and public sectors.
Private sector average weekly earnings are catching up on public sector average weekly earnings
The difference between public and private sector earnings changed from 2010 onwards after the government introduced limits on public sector pay growth. Since July 2013, private sector earnings growth outstripped that of public sector earnings, as shown in Figure 3.
Figure 3: Average wage growth in the public and private sectors
UK, seasonally adjusted, January to March 2006 to August to October 2018

Source: Office for National Statistics, Labour Force Survey
Download this image Figure 3: Average wage growth in the public and private sectors
.png (47.3 kB) .xlsx (24.8 kB)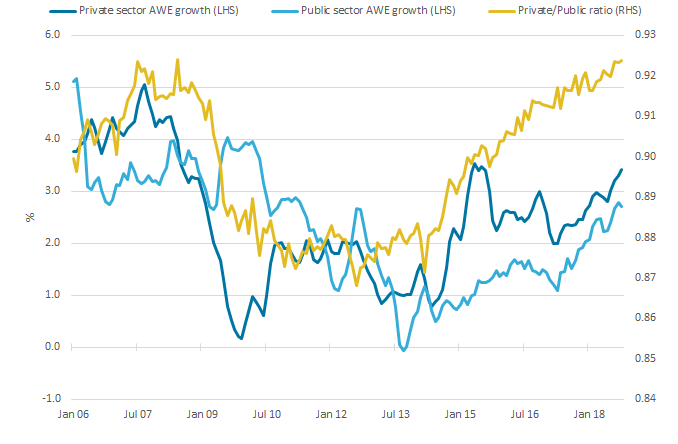
In Figure 3, the regular average weekly earnings growth rates are measured on the left-hand axis, and the ratio of private to public sector earnings is measured on the right-hand axis. The figure shows positive trends in the growth rates of the public and private sectors’ nominal average weekly earnings since 2013. During that period, private sector earnings growth was higher than public sector earnings growth. The cumulative effect of the differences in growth rates is that the ratio of private to public sector earnings increased. For example, the ratio of private to public sector average weekly earnings was 0.87 in October 2012 and increased to 0.92 in October 2018. This indicates that the gap between private and public sector earnings is narrowing. In terms of total pay, private and public sector average weekly earnings are now near parity because bonuses are higher in the private sector.
The private to public sector average weekly earnings ratio increased from August 2012 onwards. In the starting period, the difference between public and private sector earnings was at its highest (at £64). In October 2018, the difference had reduced to £40, which was lower than the average that existed during the 2008 to 2009 economic downturn (of £42).
Wage growth has been weak even though unemployment is at a historic low level
Economic theory predicts that low unemployment puts pressure on wages to increase. This is because low unemployment increases competition between firms as they try to retain their existing workers or to attract new ones. This forces them to increase wages, thus contributing to wage growth. The labour market economic commentary for November 2017 analysed the relationship between unemployment and regular pay growth using the Phillips Curve.
It is interesting that in the UK, despite historic low unemployment rate, wage growth has not been significant, as shown in Figure 4.
Figure 4: Unemployment rate and nominal wage growth
UK, seasonally adjusted, January to March 2006 to August to October 2018
Source: Office for National Statistics, Labour Force Survey
Download this chart Figure 4: Unemployment rate and nominal wage growth
Image .csv .xlsFigure 4 shows that unemployment has been on a declining trend since 2011, but earnings have not grown significantly over the same period, except for the sharp increases between June 2014 and July 2015 and between April 2017 and October 2018.
During the recovery period after the 2008 to 2009 economic downturn, the unemployment rate declined to reach its pre-downturn rate of 5.2% in the period August to October 2015, and it has been on a declining trend since then. Wage growth has been weak, and it is still below its pre-downturn rate of 4% (achieved in the October to December 2007 period).
Between October 2015 and October 2018, average weekly earnings growth averaged 2.4%. During the same period, unemployment declined from 5.2% to 4.1%. The response of average weekly earnings growth to the fall in the rate of unemployment has been weak, implying that low unemployment has not been able to stimulate significant average weekly earnings growth. This outcome may be because the unemployment rate inadequately captures the extent of slack in the labour market, and the extra slack reduces wage growth. It may also be a result of the existence of structural factors in the economy that are weighing down on wage growth. For instance, the high level of under-employment, which represents additional slack to that shown by unemployment, may be constraining wage growth.
The under-utilisation of labour is still high but is falling gradually
We can further explore the extent to which unemployment captures the level of slack in the economy by analysing the level of labour under-utilisation in the economy. Under-utilised labour consists of unemployed and under-employed labour in the economy. The Labour Force Survey defines under-employment as a situation when workers respond positively to wanting more hours and/or a new job if they work below 48 hours a week (or below 40 hours a week for people aged under 18 years). Figure 5 plots the rates of the three variables.
Figure 5: Unemployment rate, under-employment rate and under-utilisation rate
UK, seasonally adjusted, January to March 2006 to August to October 2018
Source: Office for National Statistics, Labour Force Survey
Download this chart Figure 5: Unemployment rate, under-employment rate and under-utilisation rate
Image .csv .xlsFigure 5 shows that the unemployment rate had a declining trend from the second calendar quarter of 2013 onwards. During that period, the unemployment rate declined at a faster rate than the under-employment rate. The combined effect of the changes resulted in a gradual decline of the under-utilisation rate.
The existence of additional labour market slack as measured by under-employment partly contributes to the low wage growth in the economy. In addition, the number of part-time workers has been decreasing since the beginning of 2018. The number of part-time workers who could not find full-time jobs decreased from 996,000 in the period August to October 2017 to 902,000 in the same period in 2018. This indicates that existing extra capacity is gradually being put to use.
Nôl i'r tabl cynnwys6. Labour market flows
Labour market flows data are usually published quarterly, in February, May, August and November. However, the publication of flows data for the third calendar quarter of 2018 was postponed to December 2018. It is important to note that the analysis in this section relates to the period July to September 2018.
In the first three quarters of 2018, the UK economy experienced a high employment rate, a low unemployment rate, and a stable economic inactivity rate. Under these conditions, we can enhance our understanding of what is happening in the labour market by examining the flows of workers between the different labour market statuses. The analysis of labour market flows is also important because, as mentioned above, the economy is experiencing declining slack, which impacts on movements in the labour market.
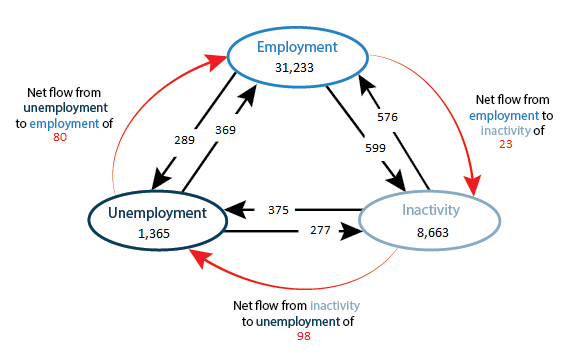
Labour market flows data are important because they make it possible to gain in-depth understanding of labour market dynamics. Figure 6 shows the flows that occurred in the third calendar quarter of 2018.
Figure 6: Quarterly flows between labour market statuses
UK, seasonally adjusted, thousands, age 16 to 64 years, April to June 2018 to July to September 2018
Source: Office for National Statistics, Labour Force Survey
Download this image Figure 6: Quarterly flows between labour market statuses
.png (32.7 kB)
The numbers in the circles represent the stocks of people in the three labour market statuses. The figure shows that there were net flows as follows:
- there was a net flow of 23,000 from employment to inactivity
- there was a net flow of 98,000 from inactivity to unemployment
- there was a net flow of 80,000 from unemployment to employment
The flows of people between the different labour market statuses depend on the stage of the business cycle. For instance, during a recession, workers tend to move from employment into the other two labour market statuses. A boom period is generally associated with net inflow into employment.
In a tight labour market, the volume of flows decreases. Instead, job-to-job moves increase because such a market situation makes it possible for workers to move between jobs with short or no periods of unemployment. A tighter labour market often strengthens workers’ bargaining for higher earnings within their current positions, or through moving into higher-paying jobs in other enterprises. Job-to-job moves will be discussed in detail later in this section.
There has been a net inflow of workers into employment since mid-2011
We can analyse labour market flows over time by plotting the gross flows associated with a labour market status. Figure 7 shows the trends of the flows into and out of employment.
Figure 7: Employment gross flows
UK, seasonally adjusted, January to March 2006 to July to September 2018
Source: Office for National Statistics, Labour Force Survey
Download this chart Figure 7: Employment gross flows
Image .csv .xlsFigure 7 shows that from the third quarter of 2011 onwards, worker flows into employment exceeded the outflows. The difference between the two flows represents the net flow into employment.
The net flow of workers into employment reached its highest level (of 256,000) since the economic downturn in the third quarter of 2015. In the third quarter of 2017, the net flow into employment was 44,000 and in the third quarter of 2018, the net flow was 57,000.
There has been a net flow of people from unemployment since the second quarter of 2012
There were flows of people into and out of unemployment. The flow into unemployment was at its highest level during the economic downturn. During that period, the net flow into unemployment peaked in the second quarter of 2009 when 207,000 people joined unemployment.
The net flow out of unemployment peaked in the second quarter of 2014 when 159,000 exited unemployment. Figure 8 plots the net flow of people into and out of unemployment.
Figure 8: Unemployment net flows
UK, seasonally adjusted, January to March 2006 to July to September 2018
Source: Office for National Statistics, Labour Force Survey
Download this chart Figure 8: Unemployment net flows
Image .csv .xlsFigure 8 shows that from the first calendar quarter of 2012 onwards, there was a net flow from unemployment in all the quarters except in the second quarter of 2015, the fourth quarter of 2017, and the third quarter of 2018. In the third calendar quarter of 2018, there was a net flow into unemployment of 18,000.
There was a net outflow of people from inactivity between 2011 and 2017
The flow of people from economic inactivity into other labour market statuses was dominant between 2011 and 2017. Figure 9 shows the flows into and out of inactivity.
Figure 9: Economic inactivity gross flows
UK, seasonally adjusted, January to March 2006 to July to September 2018
Source: Office for National Statistics, Labour Force Survey
Download this chart Figure 9: Economic inactivity gross flows
Image .csv .xlsFigure 9 shows that outflows from inactivity exceeded inflows between 2011 to 2018, except in the periods July to September 2017 and April to June 2018. In the third calendar quarter of 2018, there was a net flow out of inactivity of 76,000. The dominance of outflows over inflows resulted in economic inactivity declining over time.
Job-to-job moves continue to increase since the economic downturn
Job-to-job moves occur when workers move from one job to another. A high number of job-to-job moves indicates a significant prevalence of on-the-job search. When unemployment is high, workers are more likely to stay in their current jobs. As the labour market tightens and the number of vacancies increases, there will be more employment opportunities and workers are more likely to move jobs. Thus, a tightening labour market tends to be associated with increasing job-to-job moves. At firm level, labour turnover increases during booms and firms may be forced to pay higher wages to retain their workers.
Job-to-job moves can be measured in levels (from the left-hand side axis in Figure 10), or as a rate (from the right-hand side axis in Figure 10). The two measures give the same image of what has happened to job-to-job moves over time.
Figure 10: Job-to-job moves
UK, seasonally adjusted, January to March 2006 to July to September 2018
Source: Office for National Statistics, Labour Force Survey
Download this chart Figure 10: Job-to-job moves
Image .csv .xlsFigure 10 shows that job-to-job moves reached their lowest level in the third quarter of 2009. Since then, the number of job-to-job moves has been on an upward trend, reaching the pre-downturn level (of 735,000 in the period October to December 2007) in the third quarter of 2015. Job-to-job moves increased by 38,000 to 823,000 in the three months to September 2018.
The extent to which job-to-job moves occur is linked to internal migration dynamics. Job-to-job moves may fuel regional growth and productivity disparities. The Resolution Foundation’s research on job-to-job moves and their impact on productivity and pay shows that UK workers are less likely to migrate to different regions than non-UK workers. Non-UK workers are more likely to migrate to regions that are less attractive to UK workers. UK workers’ desire not to migrate between regions feeds into the growing proportion of job-to-job moves in some areas. This has implications for employment in regions where the labour market is dominated by, for instance, EU workers. In addition, job-to-job moves may also be affected by the availability and cost of accommodation across regions.
Nôl i'r tabl cynnwys