1. Main points
The number of people in employment increased by 42,000 on the quarter to 32.39 million in the second quarter of 2018.
Unemployment declined by 65,000 on the quarter to 1.36 million.
The level of inactivity increased by 77,000 on the quarter, resulting in the inactivity rate increasing to 21.2%.
The number of self-employed people increased by 22,000 on the quarter to 4.77 million in the second quarter of 2018.
The number of people changing jobs increased by 118,000 on the quarter to 752,000 moves in the second quarter.
2. Employment
In the second quarter (Apr to June) of 2018, the number of people in employment increased by 42,000 when compared with the previous quarter, to reach 32.39 million. The increase was insufficient to have a material impact on the employment rate, which stands at 75.6%, the same as in the previous quarter (Jan to Mar 2018).
The number of employees increased by 24,000 to reach a record high of 27.45 million in the second quarter of 2018, while the number of self-employed people increased by 22,000 to 4.77 million.
The employment of men increased by 34,000 on the quarter to a record high of 17.16 million in the second quarter of 2018. During the same period, the number of employed women increased by 8,000 to reach 15.22 million.
The employment of the youth aged 16 to 17 years and 18 to 24 years changed in different directions. When compared with the first quarter (Jan to Mar), the number of 16- to 17-year-olds in employment increased by 22,000. Those aged 18 to 24 years experienced a decline in employment of 35,000. Other groups that experienced decreases in employment on the quarter are those aged 25 to 34 years and 35 to 49 years. The age groups 50 to 64 years and 65 years and older experienced increases of 49,000 and 35,000 respectively.
Employment by nationality
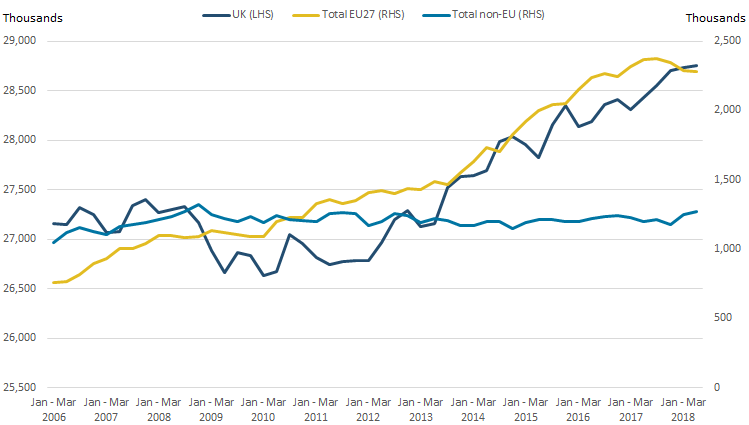
The estimates in this section relate to the number of people in employment and should not be used as proxies for migration flows into the UK. When compared with the same period a year ago, employed non-UK nationals decreased by 11,000 in the three months to June 2018. Breaking this down further shows that EU nationals (EU27) experienced a fall in employment of 86,000, while non-EU nationals experienced an increase of 74,000.
Figure 1: Employment by nationality
UK, non-seasonally adjusted, January to March 2006 to April to June 2018
Source: Office for National Statistics, Labour Force Survey
Download this image Figure 1: Employment by nationality
.png (28.5 kB) .xlsx (21.3 kB)
Employment rates data show that in the second quarter of 2018, EU27 nationals had the highest employment rate (83.1%) when compared with UK nationals (75.5%) and non-EU nationals (62.9%).
Nôl i'r tabl cynnwys3. Overemployment and underemployment
The labour market may be characterised by situations where workers want to work more hours than they currently do (underemployment), or where workers want to work fewer hours than they currently do (overemployment). The Labour Force Survey (LFS) collects data on the number of people in employment who:
want more hours in their current jobs
want replacement jobs with longer hours
want additional jobs
Of all the workers that fell in these three categories in the second quarter (Apr to June) of 2018, approximately 80% wanted more hours in their current jobs, 12% wanted replacement jobs with longer hours and 9% wanted additional jobs.
In the LFS, people who responded positively to wanting more hours and/or a new job are classified as underemployed if they work below 48 hours a week (or below 40 hours a week for people aged under 18 years). By this measurement, the number of underemployed people in the three months to June 2018 stood at 2.39 million, down 121,000 when compared with the previous quarter.
Overemployment occurs when people in employment express the desire to reduce their hours. The overemployment rate is based on people who want to work fewer hours with less pay in their current or in different jobs. The Organisation for Economic Co-operation and Development (OECD) defines overemployment as “inadequate employment related to excessive hours”. People may also feel that they work excessive hours for not enough pay. In the three months to June 2018, there were 10.24 million people who wanted to work fewer hours, of which 6.66 million did not want less pay. Figure 2 shows the trends of underemployment and overemployment.
Figure 2: Underemployment and overemployment
UK, non-seasonally adjusted, January to March 2006 to April to June 2018
Source: Office for National Statistics, Labour Force Survey
Download this chart Figure 2: Underemployment and overemployment
Image .csv .xlsFigure 2 shows that the number of underemployed workers has been declining since 2013, and that the number of overemployed workers has been increasing since 2012, but has followed a downward trend in the most recent quarter (Apr to June). Although the level of underemployment has not yet reached its pre-downturn levels, the overemployment level has surpassed its pre-downturn level. Underemployment is partly contributing to the historically low unemployment rate in the economy.
Nôl i'r tabl cynnwys4. Unemployment
The latest estimates of unemployment show that the number of unemployed people fell by 65,000 to 1.36 million in the second quarter (Apr to June) of 2018. This translates to an unemployment rate of 4.0%, which is 0.2 percentage points lower than that of the first quarter (Jan to Mar). The male and female unemployment rates declined in line with the aggregate unemployment rate. The number of unemployed men decreased by a larger figure (35,000) than that of women (30,000).
Analysis of unemployment duration (Figure 3) shows that all three measures (that is, short-term, medium-term and long-term unemployment) declined in the second quarter of 2018.
Figure 3: Unemployment by duration
UK, seasonally adjusted, January to March 2006 to April to June 2018
Source: Office for National Statistics, Labour Force Survey
Download this chart Figure 3: Unemployment by duration
Image .csv .xlsShort-term unemployment fell by 50,000 on the quarter to 795,000, medium-term unemployment fell by 13,000 on the quarter to 209,000, and long-term unemployment fell by 2,000 on the quarter to 356,000.
The number of unemployed people can be broken down by nationality. The breakdown shows that 80.0% of the unemployed are UK nationals, 5.9% are EU27 nationals, and 14.1% are non-EU nationals. UK nationals experienced the largest decrease in unemployment of 51,000 in the second quarter of 2018.
Nôl i'r tabl cynnwys5. Economic activity and inactivity
The number of economically active people fell from 33.77 million in the first quarter (Jan to Mar) of 2018 to 33.75 million in the second quarter (Apr to June). The 35 to 49 years age group had the largest number of active people (11.14 million), and the highest economic activity rate (87.5%).
Compared with the previous quarter, the 18 to 24 years age group experienced the largest decrease in economic activity. Those aged 65 years and older experienced the largest increase in economic activity, up by 30,000 on the quarter.
The number of inactive people increased by 77,000 to 8.74 million in the second quarter. The inactivity rate increased after two consecutive quarters of declining. Analysis by age group shows that inactivity among 16- to 17-year-olds decreased, but it increased among all other age groups. The largest increase in inactivity occurred in the 18 to 24 years age group, which increased by 39,000 on the quarter.
In the July labour market economic commentary we observed that the number of people in inactivity sub-categories of students, people looking after family, the temporarily sick, the discouraged and the retired decreased. In the three months to June 2018, there were decreases in inactivity among the same sub-categories, except for the long-term sick sub-category that recorded an increase of 61,000 when compared with the previous quarter.
Nôl i'r tabl cynnwys6. Labour market flows
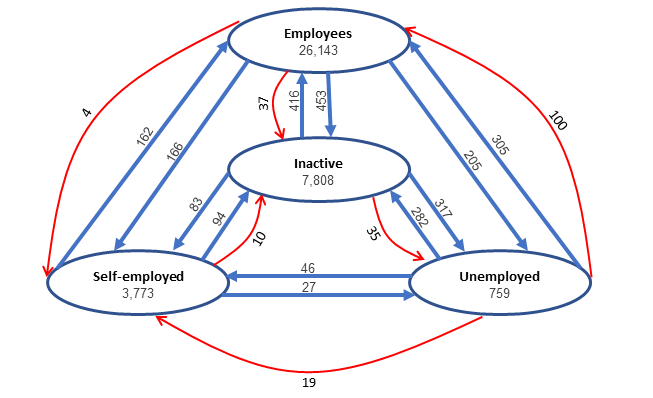
The quarterly changes featured in the headline Labour Force Survey (LFS) aggregates are driven by the behaviour of flows between labour market statuses. Figure 4 summarises the (non-seasonally adjusted) quarterly flows between the periods January to March 2018 and April to June 2018. It reports the total number of people who changed labour market status: approximately 2.56 million people moved across the labour market. Compared with a year ago, this is a fall of 125,000 people.
Straight arrows between labour market statuses represent the flows into and out of the respective economic status, while curved arrows provide information on the direction of the net flow. The employees, inactive, self-employed and unemployed figures indicate the number of people who did not change their labour market statuses in the first two quarters (Jan to Mar and Apr to June) of 2018. Labour flows into these labour market status provide useful insight into the churning that drove the changes in the headline figures in the reference period.
Figure 4: Quarterly flows between economic status
UK, non-seasonally adjusted, thousands, age 16 to 64 years, January to March 2018 to April to June 2018
Source: Office for National Statistics, Labour Force Survey
Download this image Figure 4: Quarterly flows between economic status
.png (42.3 kB)
Figure 4 shows that more people left the employee status (824,000) than any other stock. This was closely followed by inactivity, which saw 817,000 movers. Unemployment saw gross outflows of 633,000, while the self-employed status saw gross outflows of 283,000. Inactivity saw the greatest change relative to a year ago, with 79,000 fewer people moving from the stock.
Considering net flows, the unemployed status has seen the largest change this quarter, with the stock reducing by 84,000. This is mainly driven by a net outflow of 100,000 to employee status. The employee status experienced a net inflow of 60,000. Outflows from employee status included 37,000 people who moved into inactivity status, and 4,000 people who moved into the self-employed status. The self-employed status experienced a net rise of 12,000 mainly driven by movers from unemployment. Inactivity also experienced a net rise of 12,000 driven by movers from employment.
Although labour market flows capture moves over the quarter, it is possible for an individual to experience multiple transitions between and within statuses in one quarter and end the quarter in the same status. Such transitions are not captured by the current flows data, and this results in under-estimation of the level of churning in the labour market.
We can calculate the persistence of a given labour market status to illustrate the likelihood of an individual remaining in one status from one quarter to another. The persistence rate is calculated by expressing the gross flow of a status in the second quarter as a percentage of the total stock of that status in the first quarter.
In the years immediately after the economic downturn, the unemployment persistence rate reached a high of 63.3% in 2009, after which it gradually declined. This means that in 2009, an unemployed person in one period had a 63.3% chance of remaining unemployed in the following period. In the second quarter of 2018, the persistence rate stood at 54.5%, indicating the increasing probability of people leaving unemployment into other statuses. The persistence rates of employment and inactivity have remained high since recording of data began.
The July labour market economic commentary focused on the structure of employment. It highlighted that there has been a surge in self-employment over recent years.
The data suggest a positive trend for self-employment over time. As stated previously, those unemployed drove the transfers to self-employment in the most recent quarter. In previous quarters, most inflows into self-employment came from people who were employees. However, these figures fell by 26,000 on the year to 166,000 in the second quarter of 2018.
Figure 5: Net flows into self-employment
Four-quarter rolling average, UK, non-seasonally adjusted, Quarter 2 (Apr to June) 2006 to Quarter 2 (Apr to June) 2018
Source: Office for National Statistics, Labour Force Survey
Download this chart Figure 5: Net flows into self-employment
Image .csv .xlsThe former Department for Business Innovation and Skills (BIS) published a research report that explained the various reasons why individuals choose to become self-employed. The report suggested that most people consider self-employment a positive choice, whose benefits include improved flexibility, independence and higher job satisfaction. The same reasons may still be behind the rising trend in self-employment. However, it is also important to note that a minority of people consider self-employment as precarious employment because of the lack of protection offered to employees.
The flows data can be examined in terms of movements between job skills. There were 752,000 job skill moves in the second quarter of 2018. This was 118,000 more than the previous quarter. During the same period, 285,000 moved into high-skilled jobs, 214,000 moved into medium-skilled jobs and 254,000 moved into low-skilled jobs.
The movements between job skills have interesting trends, as shown in Figure 6. The figure shows that there has been an outflow from low-skilled jobs since the first quarter (Jan to Mar) of 2017. Over the same period, there have been increases in flows into high-skilled and medium-skilled jobs.
Figure 6: Net flows into jobs by skill
Four-quarter rolling average, UK, non-seasonally adjusted, Quarter 1 (Jan to Mar) 2006 to Quarter 2 (Apr to June) 2018
Source: Office for National Statistics, longitudinal Labour Force Survey
Download this chart Figure 6: Net flows into jobs by skill
Image .csv .xlsThere are many reasons why people move jobs. The Labour Force Survey (LFS) records that people move jobs because of dismissals and redundancies, resignations, retirement or to give up work, and for other reasons. Most people give “resignations” or “other reasons” as their reason for moving jobs. In the second quarter of 2018, the number of people who were dismissed or made redundant stood at 40,000, the same as in the first quarter. This is the lowest it has been since the first quarter of 2014. The number of resignations increased by 74,000 on the quarter to 330,000. The number of retirees declined by 2,000 on the quarter to 18,000. The number of people who moved jobs for reasons other than the ones above increased by 46,000 to 364,000.
Nôl i'r tabl cynnwys