1. Main points
The UK unemployment rate fell to 4.4% in the 3 months to June 2017 – the lowest it has been since 1975.
The employment rate reached a new record high of 75.1%.
Real average weekly earnings fell by 0.5% in the 3 months to June 2017, both excluding and including bonuses as consumer price inflation continued to outpace growth in wages.
The inactivity rate fell to a new record low of 21.3%.
Among the inactive women, the proportion of those who are students reached a record high of 21.1%.
2. Main labour market indicators
UK employment rate reaches a new record high
Estimates from the Labour Force Survey show that there were 32.07 million people in work in the 3 months to June 2017, which was 338,000 more than for a year earlier and 125,000 more than for January to March 2017. There was an increase in full-time employment (up 91,000) to a record high of 23.58 million and part-time employment (up 34,000) to 8.49 million compared with 3 months ago. There was an increase in the number of people in self-employment (up 21,000) since the 3 months to March 2017. By age category, there were increases in the number of employees for three age groups: 25 to 34, 35 to 49 and 50 to 64. The level of employment decreased for three age groups: 16 to 17, 18 to 24 and 65 and over. The employment rate was 75.1% in the 3 months to June 2017, the highest since comparable records began in 1971 (Figure 1).
Figure 1: Employment (16 to 64) and unemployment rate (16 and over)
UK, seasonally adjusted, Quarter 2 (April to June) 1995 to Quarter 2 (April to June) 2017
Source: Office for National Statistics, Labour Force Survey
Download this chart Figure 1: Employment (16 to 64) and unemployment rate (16 and over)
Image .csv .xlsTotal weekly hours increased since the 3 months to March 2017 by 4.4 million to a record high of 1034.2 million. Average actual weekly hours for all workers were unchanged compared with 3 months ago at 32.2 hours. Compared to 3 months ago, average hours for full-time workers increased marginally to 37.6 hours while average hours for part-time workers remained unchanged at 16.3 hours. The number of vacancies fell by 16,000 in the 3 months to July 2017 compared with the previous quarter.
Figure 2 shows rates of nominal and real wage growth over a 9-year period from June 2008. These data show that regular weekly earnings for employees (excluding and including bonuses) in Great Britain increased by 2.1% compared with a year earlier. Once adjusted for inflation (measured using the Consumer Prices Index including owner occupiers’ housing costs – CPIH), average weekly earnings fell by 0.5% (including and excluding bonuses) over the year.
Figure 2: Regular average weekly earnings growth: real and nominal
Great Britain, seasonally adjusted, 3 month on 3 month a year ago, June 2008 to June 2017
Source: Office for National Statistics, Labour Force Survey
Download this chart Figure 2: Regular average weekly earnings growth: real and nominal
Image .csv .xlsUK unemployment rate falls to its lowest since 1975
The unemployment rate declined by 0.2 percentage points in the 3 months to June 2017 compared with 3 months ago to 4.4%, its lowest since 1975 (Figure 1). The total unemployment level decreased by 57,000 compared with 3 months ago to 1.48 million. Unemployment decreased for three age groups: 16 to 17, 25 to 34 and 35 to 49, it increased for three age groups: 18 to 24, 50 to 64 and 65 and over. A fall in unemployment was accompanied by a fall in inactivity. Total inactivity level decreased by 64,000 since the 3 months to March 2017 to 8.77 million. The inactivity rate for 16 to 64 year olds decreased by 0.2 percentage points since 3 months ago to a record low of 21.3%. Inactivity decreased for three age groups: 18 to 24, 25 to 34 and 35 to 49 and increased for three age groups: 16 to 17, 50 to 64 and 65 and over. The next section analyses some longer-term trends in economic inactivity.
Nôl i'r tabl cynnwys3. Trends in economic inactivity
Headline figures have, so far, focused on the number of employed and unemployed in the labour market and less attention has been paid to those people who are economically inactive. It is, however, important to try to understand the reasons why various groups within the inactive category are not economically active. These individuals are not part of the supply of labour but are important as they are potential labour supply in the future. Changes in inactivity rates are an important part of the impact of labour supply on potential output growth.
This section of the article examines activity trends using the Labour Force Survey. It shows some trends from the mid 1990s and the characteristics of inactive people. It then looks at some of the reasons for inactivity, as well as inactivity and unemployment by countries and regions in the UK. Unless otherwise stated, analysis in this section of the article is based on inactive population aged 16 to 64.
People who are neither employed nor unemployed are classified as economically inactive. International standard definitions distinguish between the unemployed and the economically inactive by whether or not the individual is looking and available for work. The economically inactive include those who want a job but have not been seeking work in the last 4 weeks, those who want a job and are seeking work but are not available to start work and those who do not want a job.
It should be noted that economically inactive people are not in work but do not satisfy all the criteria for International Labour Organisation (ILO) unemployment (wanting a job, seeking in the last 4 weeks and available to start in the next 2 weeks). There are many reasons why an individual may be inactive, for example, they may be studying, looking after family or they may be long-term sick or disabled or be discouraged from looking for work due to being unemployed for a long period of time.
The following diagram shows that in Quarter 2 (April to June) 2017 there were 2.05 million economically inactive people who want a job. This group may well be less isolated from the labour market than the name suggests.
Hierarchy of criteria used to classify those who are unemployed (aged 16 and over) and economically inactive (aged 16 to 64)
Quarter 2 (April to June) 2017, seasonally adjusted, thousands

Source: Office for National Statistics, Labour Force Survey
Download this image Hierarchy of criteria used to classify those who are unemployed (aged 16 and over) and economically inactive (aged 16 to 64)
.png (12.9 kB)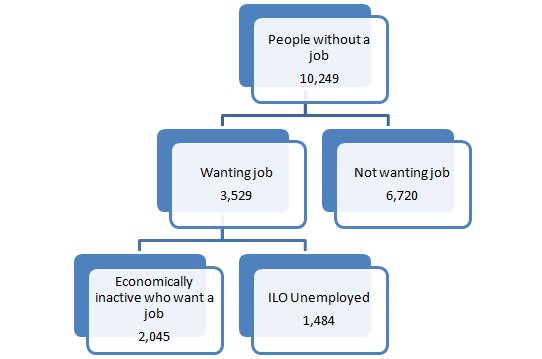
Figure 3 provides an indication of the difference in absolute size between unemployment and inactivity in the past 22 years. Figure 3 shows that the unemployment level fluctuated in line with the economic cycle. Since the early 1990s to 2001, the number of unemployed was declining, than it was relatively flat and reached the record low of 1.39 million, in the 3 months to October 2004. Following the recent economic downturn, the unemployment level rose to a peak of 2.70 million in the 3 months to November 2011. In contrast the economic inactivity rate has been relatively more constant over this time period. Since the 3 months to June 2011, the numbers of economically inactive, however, have been declining.
Figure 3: Total numbers of inactive (16 to 64) and unemployed people (16 and over)
UK, seasonally adjusted, Quarter 2 (April to June) 1995 to Quarter 2 (April to June) 2017
Source: Office for National Statistics, Labour Force Survey
Notes:
- Total numbers of unemployed include all people aged 16 and over. Total numbers of inactive include all people aged 16 to 64.
Download this chart Figure 3: Total numbers of inactive (16 to 64) and unemployed people (16 and over)
Image .csv .xls4. Characteristics of economically inactive people
Data from the Labour Force Survey back to 1995 also show that the overall inactivity rate remained fairly stable over the long period until 2011, even though there have been notable variations in the economic cycle. More recently, however, there has been a decline. The inactivity rate was 23.9% in April to June 1995 but was down to 21.3% in the same quarter in 2017 (Figure 4). Despite this relative stability over the long period, there have been some distinctive changes in the composition of the economically inactive group.
The total economic inactivity rate masks different patterns among men and women over time. For women, the rate shows a reduction from 32.7% classified as inactive in the 3 months to June 1995, to 26.3% compared with the same period in 2017, but the proportion of men who are inactive has risen from 15% in the 3 months to June 1995 to 16.3% compared with the same quarter in 2017 (Figure 4).
Figure 4: Economic inactivity rate by sex, all people aged 16 to 64
UK, seasonally adjusted, Quarter 2 (April to June) 1995 to Quarter 2 (April to June) 2017
Source: Office for National Statistics, Labour Force Survey
Download this chart Figure 4: Economic inactivity rate by sex, all people aged 16 to 64
Image .csv .xlsOver the past 20 years or so there has been an increase in the economic inactivity rates among young people. This reflects the increase in the proportion staying in full-time education and a corresponding decrease in the proportion among young people joining the labour force. These changes have had a substantial impact on the inactivity rate of people aged 16 to 17 and 18 to 24 but this trend is particularly strong among young people aged 16 to 17 (Figure 5). In contrast, the inactivity rate for people aged 50 to 64 and 65 and over has been steadily declining over the past 20 years.
Figure 5: Economic inactivity rate by age group
UK, seasonally adjusted, Quarter 2 (April to June) 1995 to Quarter 2 (April to June) 2017
Source: Office for National Statistics, Labour Force Survey
Notes:
- Inactivity rate is calculated as a proportion of all people 16 and over. Labour Force Survey headline figures use inactivity rate as a proportion of all aged 16 to 64.
Download this chart Figure 5: Economic inactivity rate by age group
Image .csv .xls5. Main reasons for economic inactivity
The Labour Force Survey asks respondents for the main reasons they are inactive using certain criteria set out by Eurostat. The main groups are people looking after family and home, long-term sick or disabled, students, temporarily sick, retired and discouraged workers. Figure 6 shows that the largest group among the economically inactive in the 3 months to June 2000 was looking after the family and home (28.5%), followed by those classified as long-term sick or disabled (26.4%) and students (16.7%). The size of the largest group (looking after family and home) has been declining in the past 2 decades as more women enter the labour market. Since the 3 months to June 2000, compared with the same quarter in 2017, there were 0.35 million women moving from inactivity and joining the labour force.
The most profound change is noted in the student group where the rate rose by 9.6 percentage points, from 16.7% in the 3 months to June 2000 to 26.3% in the same period in 2017 (Figure 6). This trend indicates that in the future there will be more people joining the labour force from this group as they may be more likely to have better employment prospects after completing further education.
Figure 6: Main reasons for economic inactivity, all people aged 16 to 64
UK, seasonally adjusted, Quarter 2 (April to June) 2000, Quarter 2 (April to June) 2008 and Quarter 2 (April to June) 2017
Source: Office for National Statistics, Labour Force Survey
Download this chart Figure 6: Main reasons for economic inactivity, all people aged 16 to 64
Image .csv .xlsThere have been some changes in the make-up of the inactive group among women. The single most important reason for inactivity among women is looking after family and home (Figure 7). However, there has been a sharp decline in the proportions looking after the family and home accompanied by increases in the proportions in the student group for women (Figure 9). The proportion of students among women has been increasing steadily from the 3 months to June 2008 to the same period in 2017 to reach a record high rate of 21.1% (Figure 7).
Figure 7: Main reasons for economic inactivity for women aged 16 to 64
UK, seasonally adjusted, Quarter 2 (April to June) 1995 to Quarter 2 (April to June) 2017
Source: Office for National Statistics, Labour Force Survey
Download this chart Figure 7: Main reasons for economic inactivity for women aged 16 to 64
Image .csv .xlsAmong men, there has been a shift in the make-up of the inactive group over the past 22 years. Long- term sick or disabled men were the largest group within the inactive but since the 3 months to October 2009, for the first time, this group was overtaken by those classified as students (Figure 8).
Figure 8: Main reasons for economic inactivity for men aged 16 to 64
Source: Office for National Statistics, Labour Force Survey
Download this chart Figure 8: Main reasons for economic inactivity for men aged 16 to 64
Image .csv .xlsFigure 9 shows that the composition in the inactive groups for men and women has changed over time. For men, there has been an increase in the proportion of those looking after family and home, and retired and for women there has been a decline in the proportion that are inactive due to looking after family or home, and retired. For both men and women, there has been an increase in the proportion who are students and a decline in the proportion who are temporarily sick, long-term sick (although this change is more pronounced for women) as well as discouraged workers.
Figure 9: Change in economic activity by reason, all people aged 16 to 64
UK, seasonally adjusted, Quarter 2 (April to June) 1995 to Quarter 2 (April to June) 2017
Source: Office for National Statistics, Labour Force Survey
Download this chart Figure 9: Change in economic activity by reason, all people aged 16 to 64
Image .csv .xls6. Economic inactivity and unemployment by region
Figures 10 and 11 show the inactivity rate and unemployment rate for countries and regions in the UK. There are a number of regional variations in economic inactivity and unemployment rates. Figures 10 and 11 indicate that higher rates of inactivity tend to exist in areas with above average unemployment rates. It should be noted that the denominators for the unemployment rate and the inactivity rate are slightly different.
The spread of inactivity rates between countries and regions in the 3 months to June 2017 in the UK was 8.7 percentage points, the South East having the lowest (at 18.2%) and Northern Ireland having the highest (at 26.9%).
Figure 10 shows that the only region in the UK that saw an increase in economic inactivity in the 3 months to June 2017 compared with the same quarter in 2000 was the East Midlands, whereas all other UK regions saw a decrease in inactivity in the same period. In the 3 months to June 2017, four UK regions had a below UK average inactivity rate. These regions were: the East of England, London, the South East and the South West, whereas in all other UK countries and regions the inactivity rate in the 3 months to June 2017 was above the UK average of 21.3%.
Figure 10: Economic inactivity rates by countries and regions in the UK, all people aged 16 to 64
UK, seasonally adjusted, Quarter 2 (April to June) 2000, Quarter 2 (April to June) 2008 and Quarter 2 (April to June) 2017
Source: Office for National Statistics, Labour Force Survey
Download this chart Figure 10: Economic inactivity rates by countries and regions in the UK, all people aged 16 to 64
Image .csv .xls
Figure 11: Unemployment rates by countries and regions in the UK, all people aged 16 to 64
UK, seasonally adjusted, Quarter 2 (April to June) 2000, Quarter 2 (April to June) 2008 and Quarter 2 (April to June) 2017
Source: Office for National Statistics, Labour Force Survey
Download this chart Figure 11: Unemployment rates by countries and regions in the UK, all people aged 16 to 64
Image .csv .xlsIt should, however, be noted that looking at these patterns on a regional level may oversimplify the picture. There is evidence to suggest that differences within regions may well be much larger than the differences between regions. Further analysis would have to be carried out to establish whether the patterns identified at the regional level hold for smaller geographical areas.
As this article has identified, there are a number of distinct groups of people in inactivity. Further analysis is planned to look in more detail at longitudinal flows data to help understand the reasons for inactivity and also the dynamics of the different groups.
Nôl i'r tabl cynnwys