1. Introduction
TTWAs became the official British definition of local labour market areas in the 1960s, although their predecessors go further back in time. Following each national census from the 1971 Census, TTWAs have been defined using commuting flow data for workers based on their area of residence and workplace.
Nôl i'r tabl cynnwys2. Concept of travel to work areas
TTWAs are defined to approximate self-contained local labour market areas, where the majority of an area’s resident workforce work, and where the majority of the workforce live. TTWAs help to make local labour market data more meaningful. In their absence, comparing data for different parts of the country risks distortion if there are mismatches between where the workforce work and where the workforce live, so that very different types of areas would then be compared. To avoid this problem, TTWAs have been defined so that relatively few commuters cross a TTWA boundary on their way to work, which makes them de facto local labour market areas.
TTWAs are non-overlapping contiguous areas covering the whole of the UK. TTWAs can cross national boundaries, although no account is taken of commuting between Northern Ireland and the Republic of Ireland.
Nôl i'r tabl cynnwys3. Definition of 2011 travel to work areas
The latest Travel to Work areas produced by Newcastle University have been created using an algorithm to identify commuting patterns from a 2011 Census matrix of commuting flow data by origin and destination for workers aged 16 and over, based on residence postcode and address of the place of work in main job.
The criteria used for defining TTWAs is that generally at least 75% of an area's resident workforce work in the area and at least 75% of the people who work in the area also live in the area. The area must also have a working population of at least 3,500. However, for areas with a working population in excess of 25,000, self-containment rates as low as 66.7% are accepted.
The resulting pattern is that although the definitive minimum working population in a TTWA is 3,500, many areas are much larger – indeed, much of London and its surrounding area forms one TTWA.
Further information about the methodology used to create TTWAs can be found in 2011 Travel to Work Areas Guidance and Information on the Travel to Work Areas webpage.
Nôl i'r tabl cynnwys4. Changes in the number of TTWAs over time
As the TTWAs have been defined in a consistent manner, it is possible to make meaningful comparisons between the number of TTWAs over time, and geographically across the UK. What has been observed is a persistent reduction in the number of TTWAs over time. With the 1991 TTWAs, there were 308 TTWAs covering the UK, with the 2001 TTWAs there were 243 TTWAs, and there has been a further reduction to 228 with the latest 2011 TTWAs.
This reduction over time in the number of TTWAs reflects an increasing proportion of workers commuting longer distances to travel to work. More people commuting further means that most areas tend to become less self-contained, leading to a decrease in the number of TTWAs and hence an increase in the average land area and population size of TTWAs. The growth of longer distance commuting may be attributable to 1 or more of a number of different factors, including:
sustained increase in car use, which allows access to more workplaces
fewer jobs in traditional employment sectors, such as manufacturing and mining, where local working was common
diffused job opportunities (such as employers de-centralising to city edges)
more jobs at professional/managerial levels with higher pay levels allowing more costly travel
more households with 2 earners who often cannot live near both workplaces
more complex working patterns (such as people working part of the week at home)
An illustration of the increase in commuting distance by workers between 2001 and 2011 as recorded by the census is shown in Figure 1, where the proportion of commuters travelling 10km or over has increased from 32.3% to 35.8%.
Figure 1: Commuting distances travelled, UK, 2001 and 2011
Source: Census - Office for National Statistics
Notes:
- Includes commuters aged 16 to 74.
Download this chart Figure 1: Commuting distances travelled, UK, 2001 and 2011
Image .csv .xlsThe distance travelled to work is linked to the main mode of transport to work. We can compare the main method of travel to work from the 2011 Census with comparable figures from the 2001 Census (Figure 2). For those in employment (aged 16 to 74), the proportion driving a car or van fell slightly (by 0.8 percentage points), although the overall growth in numbers working meant there was an increase of 1.4m people driving to work. Driving a car or van remains by far the most widely used mode of transport to work.
Figure 2: Mode of Travel to Work, UK, 2001 and 2011
Source: Census - Office for National Statistics
Download this chart Figure 2: Mode of Travel to Work, UK, 2001 and 2011
Image .csv .xlsThe proportion of workers who stated they worked mainly at or from home increased by 1.1 percentage points to 10.3%; they are included in the definitions of TTWAs alongside those who work very locally. Among those most likely to commute longer distances are those travelling by train, and the proportion of all workers using this mode has increased by 0.9 percentage points to reach 5.0% in 2011.
The fact that the modes of travel to work which grew most were associated with commuting either longer distances (rail) or no distance at all (home-working) means these changes partially cancelled each other out in their impact on average commuting distance. The effect of this modest change has been a slower decline from 2001 to 2011 in the number of TTWAs than was seen in earlier decades.
Nôl i'r tabl cynnwys5. Changes in the largest TTWAs, 2001 and 2011
In 2001 the average size of TTWAs in terms of the workplace population1 was 109,000 and by 2011 this had risen to over 131,000, an increase of over 20%. A common feature of the TTWAs continues to be their enormous range in size, with the economically active populations of 2011 TTWAs ranging from around 3,600 for the Broadford and Kyle of Lochalsh TTWA in northwest Scotland to over 4.3m in the London TTWA.
Of the 243 TTWAs created following the 2001 Census, only 31 (13%) have remained unchanged in area with the 2011 TTWAs (though some have changed in name). The 10 largest 2001 TTWAs in terms of their workplace population had, with one exception – Bristol TTWA – all increased in size by 2011 TTWAs (Table 1).
Table 1: Largest TTWAs by workplace population, UK, 2001 TTWAs and 2011 TTWAs
| Rank | Name | No. of jobs | % of total Workplace Population |
| 2001 TTWAs | |||
| 1 | London | 4,227,600 | 16.0 |
| 2 | Manchester | 845,300 | 3.2 |
| 3 | Birmingham | 687,300 | 2.6 |
| 4 | Glasgow | 517,200 | 2.0 |
| 5 | Newcastle and Durham | 459,100 | 1.7 |
| 6 | Leeds | 438,000 | 1.7 |
| 7 | Bristol | 437,800 | 1.7 |
| 8 | Liverpool | 386,000 | 1.5 |
| 9 | Belfast | 373,900 | 1.4 |
| 10 | Leicester | 360,800 | 1.4 |
| 2011 TTWAs | |||
| 1 | London | 4,408,400 | 14.7 |
| 2 | Manchester | 1,238,700 | 4.1 |
| 3 | Slough and Heathrow | 773,800 | 2.6 |
| 4 | Birmingham | 757,000 | 2.5 |
| 5 | Glasgow | 615,600 | 2.1 |
| 6 | Newcastle | 474,300 | 1.6 |
| 7 | Liverpool | 438,100 | 1.5 |
| 8 | Leicester | 434,700 | 1.5 |
| 9 | Bristol | 428,300 | 1.4 |
| 10 | Belfast | 420,900 | 1.4 |
| Source: Office for National Statistics | |||
Download this table Table 1: Largest TTWAs by workplace population, UK, 2001 TTWAs and 2011 TTWAs
.xls (33.3 kB)With the 2001 TTWAs, the top 10 TTWAs by workplace population between them included around one-third of the total UK workplace population, with around one-sixth of the total UK workplace population in the largest TTWA, London. By the same workplace population measure, the top 10 2011 TTWAs covered a similar proportion of the total UK workplace population, whilst the top 25 TTWAs together accounted for just over 50% of the total UK workplace population.
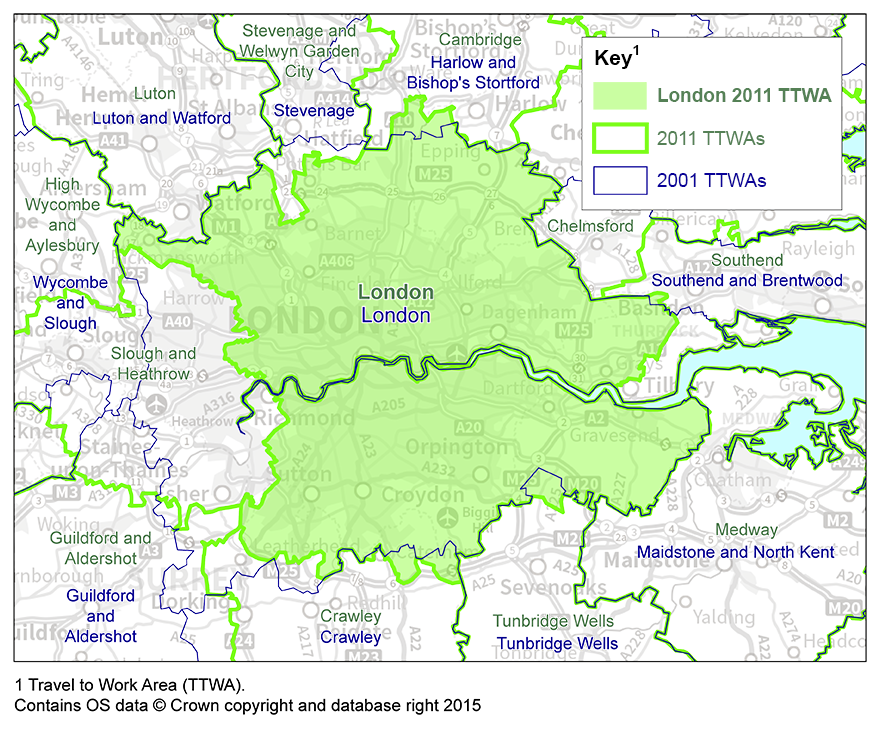
It is not simple to interpret change to individual TTWAs over time. For example, there has been widespread growth in job numbers across the London region but the percentage of the 2011 UK workplace population covered by the 2011 London TTWA is lower than the share of the 2001 UK workplace population in the 2001 London TTWA. The reason is that the 2011 TTWA boundary covers a smaller area, due to the emergence in 2011 of a separate Slough and Heathrow TTWA (although this ‘new’ TTWA is very similar to one of the 1991 TTWAs).
Comparing the 2001 and 2011 TTWAs, Manchester TTWA saw the largest increase in workplace population at 393,400 (Table 2), reflecting a large boundary enlargement with the 2011 TTWA.
Table 2: Change in workplace population of the largest TTWAs 2001 and 2011, UK
| TTWA | Change in Workplace Population | % change in Workplace Population | % change in land area |
| Manchester | 393,400 | 46.5 | 30.1 |
| London | 180,700 | 4.3 | -20.3 |
| Glasgow | 98,400 | 19.0 | 20.5 |
| Leicester | 73,900 | 20.5 | 8.9 |
| Birmingham | 69,700 | 10.1 | 3.0 |
| Liverpool | 52,100 | 13.5 | 0.3 |
| Belfast | 47,000 | 12.6 | -11.9 |
| Newcastle* | 15,200 | 3.3 | 1.1 |
| Bristol | -9,600 | -2.2 | -22.3 |
| Source: Office for National Statistics Notes: 1.* 2001 TTWA was named Newcastle and Durham. | |||
Download this table Table 2: Change in workplace population of the largest TTWAs 2001 and 2011, UK
.xls (32.3 kB)Changes to the TTWA boundaries result from the interplay of many different shifts in the complex patterns of commuter flows; it is rarely a simple case that there has been a growth or decline in jobs in one area. This is especially so in the London conurbation, where to the west there is now the separate Slough and Heathrow TTWA, and there has been contraction in a few other areas such as South Mimms in Hertfordshire and Tilbury in Essex (Map 1). Conversely the London TTWA has gained other areas including Hoddesdon in Hertfordshire. Even as a smaller TTWA than its predecessor, the 2011 London TTWA extends outside Greater London into parts of Berkshire, Essex, Hertfordshire, Kent and Surrey.
Map 1: London TTWA, 2001 and 2011
Source: Census - Office for National Statistics
Download this image Map 1: London TTWA, 2001 and 2011
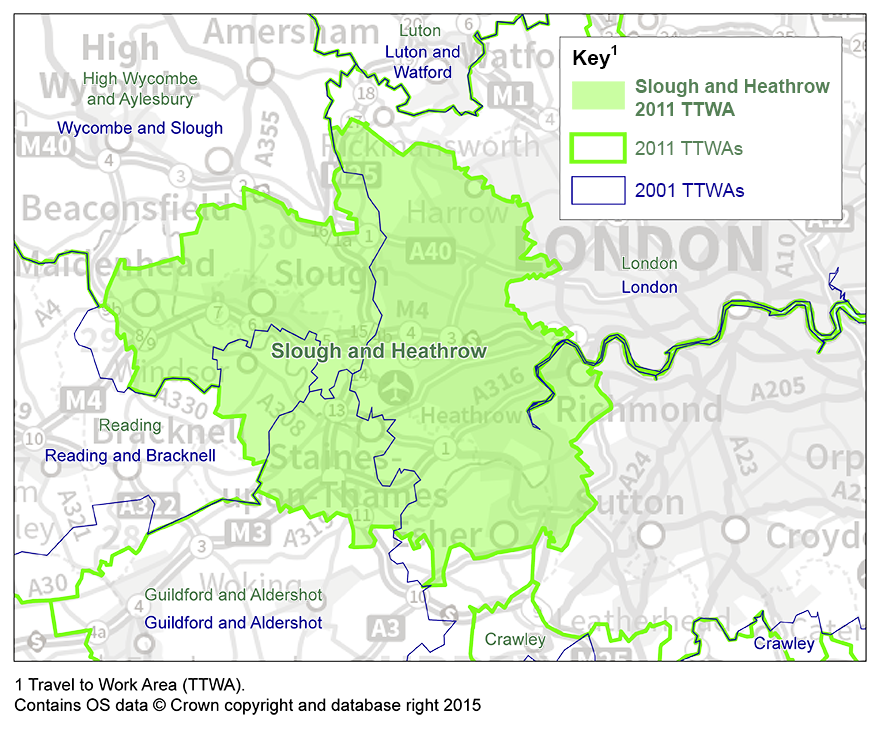
.png (762.1 kB)The creation of a new Slough and Heathrow TTWA to the west of London (Map 2), has changed the pattern of TTWAs in this part of the country. The Slough and Heathrow TTWA covers the area of part of 4 former TTWAs – Guildford and Aldershot, Reading and Bracknell, Wycombe and Slough, and London. The Slough and Heathrow TTWA includes the western part of the London region which includes Heathrow Airport, a major source of employment for residents within the TTWA, with other centres of employment including Maidenhead, Slough, Windsor (all Berkshire) and Staines (Surrey).
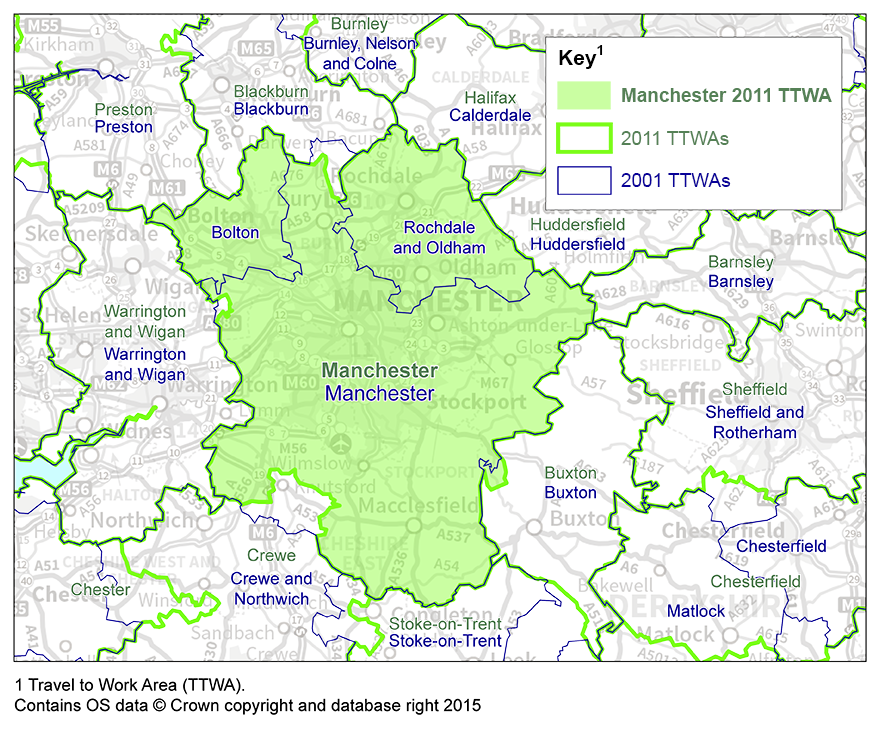
Map 2: Manchester TTWA, 2001 and 2011
Source: Census - Office for National Statistics
Download this image Map 2: Manchester TTWA, 2001 and 2011
.png (759.9 kB)For the Manchester TTWA (Map 3), there has been contraction in some areas – for example Knutsford in Cheshire to the south west of Manchester – but also a noticeable enlargement in areas to the north of Manchester. In fact both the former Bolton TTWA and Rochdale and Oldham TTWA are now wholly within the Manchester TTWA. It is the inclusion of these two former TTWAs which has resulted in a substantial increase in size, in terms of both the land area (30%) and the workplace population within the Manchester TTWA (47%).
Map 3: Slough and Heathrow TTWA 2011, and 2001 TTWAs
Source: Census - Office for National Statistics
Download this image Map 3: Slough and Heathrow TTWA 2011, and 2001 TTWAs
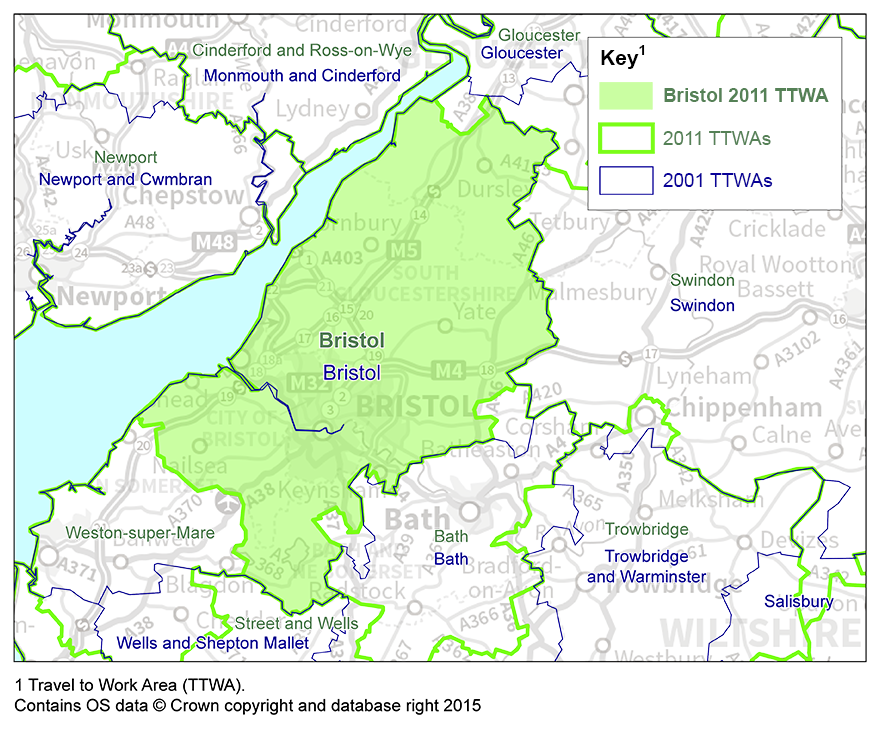
.png (602.5 kB)The land area of the 2011 Bristol TTWA is smaller by around 22% in comparison to the 2001 Bristol TTWA (Map 4). This reduction is largely attributable to the area in and around Weston-super-Mare becoming a new TTWA in its own right. The consequent reduction in the workplace population of the Bristol TTWA is much less dramatic at under 10,000 (2.2%), with the reduction of area covered largely cancelled out by strong growth in the main urban area.
Map 4: Bristol TTWA, 2001 and 2011
Source: Census - Office for National Statistics
Download this image Map 4: Bristol TTWA, 2001 and 2011
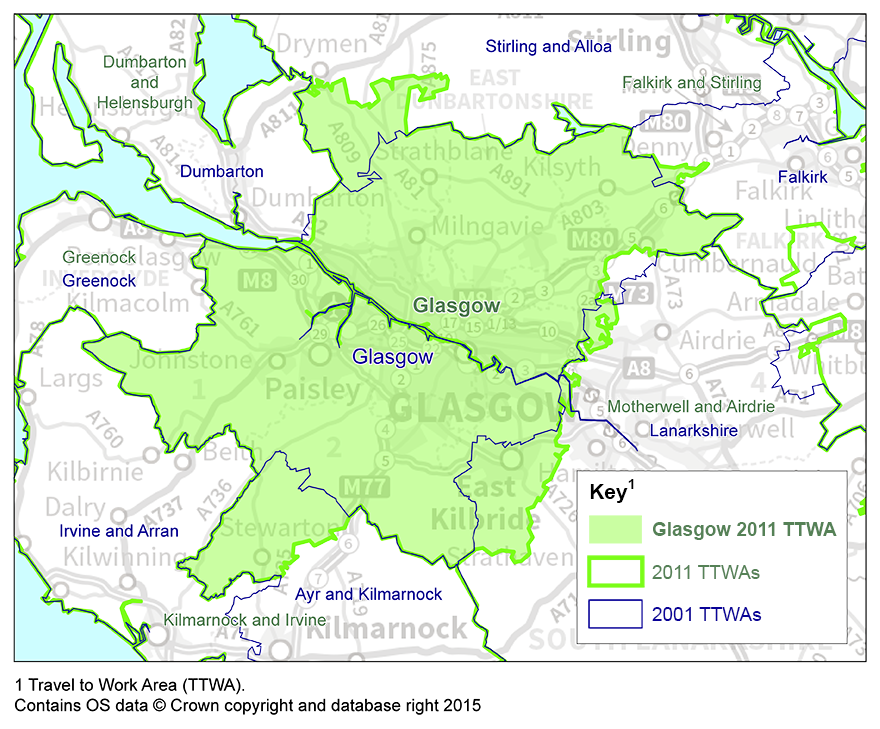
.png (594.2 kB)Another example of a TTWA with a large workplace population increase is Glasgow (Map 5), where the workplace population has increased by 19% (98,400). Although the TTWA land area has increased by 21%, much of this additional land is thinly populated (apart from East Kilbride to the south of Glasgow, previously in Lanarkshire TTWA). The workplace population growth has mostly taken place in the main urban areas, with the wider boundaries accounting for much less of this growth.
Map 5: Glasgow TTWA, 2001 and 2011
Source: Census - Office for National Statistics
Download this image Map 5: Glasgow TTWA, 2001 and 2011
.png (600.7 kB)Of the 6 other TTWAs in the top 10 in terms of workplace population (Table 2), all have had an increase in their workplace population between their 2001 TTWA boundary and their current boundary, ranging from 15,200 in the Newcastle TTWA to 73,900 in the Leicester TTWA. Only 1 of these TTWAs, Belfast, had a reduction in the area of the TTWA.
Notes for changes in the largest TTWAs, 2001 and 2011
1.The workplace population of an area is an estimate of the number of people working in the area, both residents (including both home workers and resident workers with no fixed place of work) and non-resident commuters into the area.
Nôl i'r tabl cynnwys6. Summary
With the 2011 TTWAs definitions the established trend for increased average size of TTWAs has continued, with the further reduction in their number. Almost all the largest TTWAs, covering cities including London, Manchester and Glasgow, saw growth in terms of their workplace populations, though not necessarily in their land area. In particular London TTWA saw an increase in its workplace population despite the notable decrease in land area which resulted from the creation of a new Slough and Heathrow TTWA.
More generally, it has been stressed that the interpretation of change in TTWAs boundaries is made more difficult by the variety of factors in play, with one example being the economic growth in Bristol not being reflected in the TTWA workplace population size due to the 2001 Bristol TTWA becoming split with the creation of a Weston-super-Mare TTWA.
It is hoped that the publication of the 2011 TTWAs will help policy makers in discussions around the identification of functional economic areas, and allow more meaningful area comparisons and analysis to be made.
Users wishing to access labour market statistics for the 2011 TTWAs can do so through the Nomis website.
Nôl i'r tabl cynnwys