Cynnwys
- Main points
- Things you need to know about this release
- The value of listed shares in issue by private non-financial corporations fell by their sharpest rate in over six years
- Real household disposable income increased by 0.3% in the latest quarter, while the 2017 growth rate was revised down to negative 0.5%
- Households’ saving ratio fell 0.4 percentage points to 4.1% in the latest quarter, the third-lowest on record
- What has happened to the net lending or borrowing positions of UK sectors?
- Summary of revisions to net lending borrowing positions
- National accounts articles
- Links to related statistics
- Links to related analysis
- Changes to this bulletin
- Quality and methodology
- Appendix A: Revisions to real household disposable income growth
- Appendix B: Revisions to the Household saving ratio
- Acknowledgements
1. Main points
The value of listed shares in issue by private non-financial corporations fell by their sharpest rate in over six years, in the latest quarter, as several large companies reported substantial losses prompting sell-offs, resulting in the fall in the price of shares.
Real household disposable income in 2017 was revised down from positive 0.3% growth to negative 0.5% as wages and salaries saw downward revisions following updated data sources; as a result, 2017 was the second consecutive year of negative growth as 2016 also saw downward revisions from 0.0% to negative 0.2%, for the same reason.
Real household disposable income in Quarter 1 (Jan to Mar) 2018 increased by 0.3%, quarter on previous quarter, as gross disposable household income increased at a faster rate than price rises.
This is now the second consecutive quarter of positive RHDI growth (quarter on same quarter a year ago) following five consecutive quarters of negative growth; this was due mainly to growth in total wages and salaries throughout 2017 as employment levels reached record highs.
The household saving ratio fell 0.4 percentage points to 4.1% in Quarter 1 2018 as household spending grew faster than household income; this is the third-lowest quarterly saving ratio since records began in 1963.
The record-low household saving ratio in 2017 was revised downwards from 4.9% to 4.1% as wages and salaries received by households was revised downwards following updated data sources; the saving ratio for 2017 remains the lowest on record.
Households’ net borrowing position in 2017 was revised upwards following downward revisions to wages and salaries of £10.6 billion over the course of the four quarters; this implies that the household sector’s need for financing its spending and investment decisions is greater than previously estimated.
Estimates in this bulletin are consistent with our annual national accounts publication Blue Book 2018, to be published on 31 July 2018, which introduced methodological, data source and system improvements.
2. Things you need to know about this release
National Statistics status
On 20 March 2018, the UK Statistics Authority published a letter confirming the designation of quarterly sector accounts statistics as National Statistics. National Statistics means that official statistics meet the highest standards of trustworthiness, quality and value. The letter praised the richer analysis on the households’ sector and the improvements in communicating technical concepts to a less technical audience.
We are keen to continue this type of analysis and we welcome feedback and suggestions for additional content for the bulletin or supplementary pieces.
We also maintain an email subscription list informing interested people when there are planned changes to the bulletin. If you wish to subscribe to this list, please email us at sector.accounts@ons.gov.uk with “subscribe” as the subject line.
Understanding the sector and financial accounts
This bulletin presents UK aggregate data for the main economic indicators and summary estimates from the institutional sectors of the UK economy: private non-financial corporations, public corporations, financial corporations, central and local government, households, non-profit institutions serving households (NPISH) and the rest of the world sector, that are presented in the UK Economic Accounts (UKEA) dataset.
This bulletin uses data from the UKEA and it provides detailed estimates of national product, income and expenditure, UK Sector, Non-financial and Financial Accounts and UK Balance of Payments. These accounts are the underlying data that produce a single estimate of gross domestic product (GDP) using income, production and expenditure data.
Comparability
Data in this bulletin are internationally comparable. The UK National Accounts are compiled in accordance with the European System of Accounts: ESA 2010, under EU law and in common with all other members of the European Statistical System. ESA 2010 is itself consistent with the standards set out in the United Nations System of National Accounts 2008: SNA 2008.
An explanation of the sectors and transactions described in this bulletin can be found in Chapter 2 of the European System of Accounts 2010: ESA 2010 manual.
Revisions within this release
This bulletin includes new data for the latest available quarter, Quarter 1 (Jan to Mar) 2018 and revisions to annual data from 1948 and quarterly data from Quarter 1 1955 due to improvements introduced as part of the National Accounts, The Blue Book: 2018 to be published on 31 July 2018. This is an annual publication set out to introduce methodological, source, system and other types of improvements to ensure we continue to produce the best possible estimates for our users.
The indicative impact of these changes on the sector and financial accounts are outlined in the National Accounts articles: Detailed assessment of changes to sector and financial accounts, 1997 to 2016. Significant revisions will be mentioned in each section of this bulletin, where appropriate, to ensure users are made aware of the impact improvements have had on our main indicators such as the saving ratio, growth in household income and net lending or borrowing positions.
This bulletin also follows the National Accounts Revisions Policy.
Estimates within this release
All data within this bulletin are estimated in current prices (also called nominal prices), except for real household disposable income, which is estimated in chained volume terms.
Current price series are expressed in terms of the prices during the time period being estimated. These describe the prices recorded at the time of production or consumption and include the effect of price inflation over time. Chained volume series (also known as real terms) have had the effects of inflation removed.
All figures given in this bulletin are adjusted for seasonality, unless otherwise stated. Seasonal adjustment removes seasonal or calendar effects from data to enable more meaningful comparisons over time.
The Population estimates for UK, England and Wales, Scotland and Northern Ireland used in this release are those published on 22 June 2017 and the population projections used are those published on 26 October 2017.
Real household disposable income (RHDI) explained
Household income is measured in two ways: in current prices (also called nominal prices) and in real terms, where the effect of price inflation is removed.
Gross disposable household income (GDHI) is the estimate of the total amount of income that households have available to either spend, save or invest. It includes income received from wages (and the self-employed), social benefits, pensions and net property income (earnings from interest on savings and dividends from shares) less taxes on income and wealth. These are all given in current prices.
Therefore, GDHI tells us how much income households had to spend, save or invest in the time period being measured once taxes on income and wealth had been paid.
Adjusting GDHI to remove the effects of inflation gives another measure of disposable income called real household disposable income (RHDI). This is a measure of the real purchasing power of households’ income, in terms of the physical quantity of goods and services they would be able to purchase if prices remained constant over time. Further information on this calculation can be found in our Quality and Methodology Information.
The households’ saving ratio explained
The saving ratio estimates the amount of money households have available to save (gross saving) as a percentage of their gross disposable income.
Gross saving is the difference between households’ total available resources (that is, GDHI plus pension accumulations) and household consumption (expenditure on goods and services for consumption).
The saving ratio can be volatile and is sensitive to even relatively small movements in its components, particularly on a quarterly basis. This is because gross saving is a relatively small difference between two large numbers. It is therefore often revised at successive publications when there are revisions to data.
The households’ saving ratio is seen as an indicator of household financial conditions. A low saving ratio may imply that households are spending more of their income and could be taking on more debt and acquiring fewer financial assets such as bank deposits, bonds and pensions. A higher saving ratio may imply that households are acquiring more assets and taking on less debt.
Reliability
Estimates for the most recent quarters are provisional and are subject to revision in the light of updated source information. Our revisions to economic statistics page contains articles on revisions and revisions policies.
Revisions to data provide one indication of the reliability of main indicators. Revisions triangles were published for the households and non-profit institutions serving households saving ratio. However, following the separation of the households and NPISH sectors in September 2017, we have ceased production of the revision triangles for the households and NPISH saving ratio. In due course, we will reintroduce the revision triangle for the households-only saving ratio as and when meaningful analysis on revisions can be done.
Nôl i'r tabl cynnwys3. The value of listed shares in issue by private non-financial corporations fell by their sharpest rate in over six years
The value of total shares issued by UK sectors fell for the first time in two years, by £106.1 billion in the latest quarter, Quarter 1 (Jan to Mar) 2018, compared with the previous quarter. In general, this fall was caused by a fall in prices of existing shares, which could be partly due to a combination of global market sell-off, uncertainty about Brexit and a weaker US dollar.
At a sector level, this was felt most heavily by the private non-financial corporations (PNFCs) sector, which fell by £97.6 billion (as shown in Figure 1); that’s 92.0% of the fall in the value of total UK shares. This was the largest fall in the value of shares in issue by PNFCs in over six years (since Quarter 3 (July to Sept) 2011).
Figure 1: Contributions to the change in the value of total UK shares, non-seasonally adjusted
Quarter 1 (Jan to mar) 2011 to Quarter 1 (Jan to Mar) 2018
Source: Office for National Statistics
Download this chart Figure 1: Contributions to the change in the value of total UK shares, non-seasonally adjusted
Image .csv .xlsThe fall in the value of shares in issue by PNFCs is mirrored by the fall in the FTSE All-Share price index (see Figure 2). The quarter saw several large companies report substantial losses, which prompted sell-offs and, as a consequence, resulted in the fall in the price of shares.
In Quarter 1 2018, the index was the worst-performing major stock market despite numerous major drops in Asian and US markets.
Figure 2: Index of FTSE All-Share and indexed value of private non-financial corporations’ shares: Quarter 1 (Jan to Mar) 2011
Quarter 1 (Jan to Mar) 2011 to Quarter 1 (Jan to Mar) 2018, UK
Source: Office for National Statistics, London Stock Exchange
Notes:
- Value of shares at end of quarter.
Download this chart Figure 2: Index of FTSE All-Share and indexed value of private non-financial corporations’ shares: Quarter 1 (Jan to Mar) 2011
Image .csv .xls4. Real household disposable income increased by 0.3% in the latest quarter, while the 2017 growth rate was revised down to negative 0.5%
Real household disposable income (RHDI) in Quarter 1 (Jan to Mar) 2018 increased by 0.3%, quarter on previous quarter, as gross disposable income increased at a faster pace than price rises. This is compared with negative 0.4% growth in the previous quarter where price rises more than offset growth in household income.
Gross disposable household income (GDHI) increased by £4.5 billion in the latest quarter and contributed 1.4 percentage points to RHDI growth, as shown by Figure 3. Much of this growth was led by a £2.6 billion increase in wages and salaries as the number of people employed in the economy increased. Approximately 197,000 more people aged 16 years and over were in employment compared with the previous quarter (see UK labour market: June 2018) – the highest quarter on previous quarter increase since Quarter 4 (Oct to Dec) 2015. Gross operating surplus also contributed positively to GDHI growth (£1.2 billion).
This growth in GDHI was offset partly by a 1.1% rise in prices affecting households. This was the largest impact of inflation on RHDI quarter on previous quarter growth since Quarter 2 (Apr to June) 2011 when it was 1.2%.
Figure 3: Percentage point contributions to real household disposable income growth, quarter on previous quarter
Quarter 1 (Jan to Apr) 2015 to Quarter 1 (Jan to Apr) 2018, UK
Source: Office for National Statistics
Notes:
- Sum of contributions to real household disposable income may not add to growth rate due to rounding.
Download this chart Figure 3: Percentage point contributions to real household disposable income growth, quarter on previous quarter
Image .csv .xlsCompared with the same quarter a year ago, RHDI grew by 2.0%; the fastest rate in over two years (Quarter 4 2015 when it grew by 4.5%).
The main reason for this was the growth in total wages and salaries throughout 2017 as employment levels reached record highs. Approximately 396,000 more people over the age of 16 years were in employment in the latest quarter compared with the same quarter a year ago. Almost two-thirds of these were in full-time work.
This is now the second consecutive quarter of positive RHDI growth (quarter on same quarter a year ago) following five consecutive quarters of negative growth.
Revisions to real household disposable income
As a result of improvements introduced in the National Accounts, The Blue Book 2018 to be published on 31 July 2018, estimates for RHDI were open for revisions all the way back to 1997.
The average revision between 1997 and 2016 was 0.0 percentage points and details on the improvements made can be found in National Accounts articles: Detailed assessment of changes to sector and financial accounts, 1997 to 2016.
The most notable revision in this period was in 2016, when RHDI growth was revised downwards from 0.0% growth to negative 0.2% growth as wages and salaries was revised downwards by £5.2 billion. This reflects updated data sources.
The RHDI growth rate in 2017 was also revised downwards due to the same reason as in 2016. Wages and salaries received by households was revised downwards by £10.6 billion causing a downward revision in the RHDI growth rate from positive 0.3% to negative 0.5%. This revision meant that RHDI had fallen for two consecutive years in 2017, the first time this has happened since 2011.
See Appendix A for a chart summary on revisions to RHDI growth and for revisions to the sub-components of GDHI in 2017.
Nôl i'r tabl cynnwys5. Households’ saving ratio fell 0.4 percentage points to 4.1% in the latest quarter, the third-lowest on record
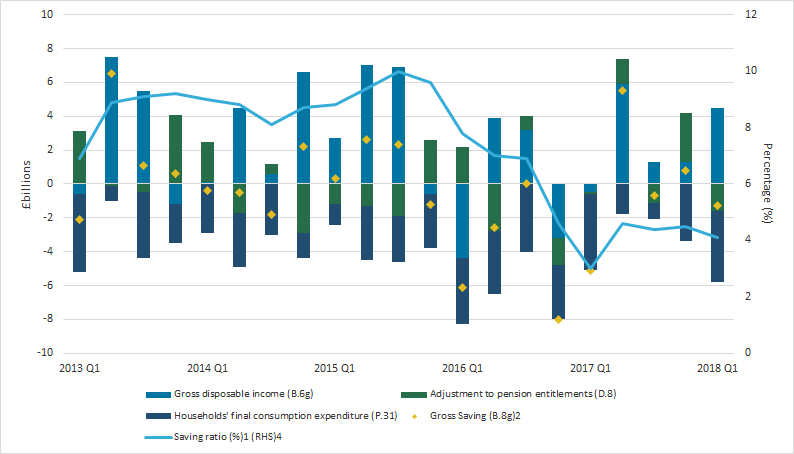
The households’ saving ratio remained historically low as it fell 0.4 percentage points to 4.1% in Quarter 1 (Jan to Mar) 2018. The fall was due to a combination of household spending increasing by £4.2 billion (its largest quarter on previous quarter increase in four quarters) and a slowdown in the accumulation of pension entitlements of £1.6 billion, as shown in Figure 4.
Figure 4 also shows gross disposable household income (GDHI) growing by £4.5 billion. Total wages and salaries received by households (£2.6 billion) largely caused the increase in GDHI as employment levels saw the highest quarter on previous quarter increase since Quarter 4 (Oct to Dec) 2015 (see Section 4 for greater detail on the UK labour market).
In summary, the increase in spending and a slowdown in the accumulation of pension entitlements more than offset income growth. As a result, the amount households had available to save (that is, gross savings) in Quarter 1 2018 fell by £1.3 billion and consequentially a fall in the saving ratio to 4.1%.
Figure 4: Contributions to the household saving ratio, quarter on previous quarter, seasonally adjusted
Quarter 1 (Jan to Mar) 2013 to Quarter 1 (Jan to Mar) 2018, UK
Source: Office for National Statistics
Notes:
- Saving ratio calculated as gross saving divided by total available resources.
- Gross saving calculated as total available resources minus households' final consumption expenditure.
- Total available resources calculated as gross disposable income plus adjustment to pension entitlements.
- Saving ratio (%) refers to the axis on the right-hand side (RHS). All others refer to the left-hand side axis.
Download this image Figure 4: Contributions to the household saving ratio, quarter on previous quarter, seasonally adjusted
.png (30.6 kB) .xls (48.6 kB)
Long-term perspective
The saving ratio in Quarter 1 2018 was the third-lowest since records began in 1963. This follows a historically low period in the amount of income households have available to save since Quarter 3 (July to Sept) 2016.
Figure 5 shows the historical context of the drop in the saving ratio seen in recent quarters. The line in Figure 5 shows the quarterly saving ratio while the bars show the percentage point change in the saving ratio, quarter on the same quarter a year ago. The bars therefore imply the severity and longevity of movements in the saving ratio.
The saving ratio has seen two significant drops in the past, as Figure 5 shows. In the mid- to late-1980s, the decline in the saving ratio was long but less severe than the current decline. In the late-1990s, there was a severe drop in the saving ratio but this was a single quarter “shock” and the saving ratio returned to trend shortly after. In both cases, the decline in the saving ratio was caused partly by spending outstripping income. The current decline, however, had two consecutive quarters of severe downward shocks (in Quarter 4 2016 and Quarter 1 2017), as emphasised by the bars.
It is too early to tell whether these new levels are a new normal as 2017 saw exceptional political and economic uncertainty. The Bank of England has seen evidence of credit tightening by commercial banks and with growing talk of potential interest rate rises, the returns on saving could make saving more attractive if these increases take place and are of significant magnitude. For the time being, the households’ saving ratio remains at historically low levels.
Figure 5: UK saving ratio, percentage, quarterly, seasonally adjusted
Quarter 1 (Jan to Mar) 1963 to Quarter 1 (Jan to Mar) 2018
Source: Office for National Statistics
Download this chart Figure 5: UK saving ratio, percentage, quarterly, seasonally adjusted
Image .csv .xlsRevisions to the saving ratio
As a result of improvements introduced in the National Accounts, The Blue Book: 2018 to be published on 31 July 2018, the saving ratio was open for revisions all the way back to 1963. Pre-1997, the impact was minimal and revisions averaged 0.0% a year.
The average revision between 1997 and 2016 was also 0.0 percentage points and details on the improvements made can be found in National Accounts articles: Detailed assessment of changes to sector and financial accounts, 1997 to 2016. Within this period, one of the more notable revisions was in 2016, when the saving ratio was revised downwards by 0.4 percentage points to 6.6%. This revision was caused by a £5.2 billion downward revision to total wages and salaries received by households reflecting updated data sources.
However, the most notable revision was in 2017, when the already lowest saving ratio on record was revised downwards further from 4.9% to 4.1%. The cause was also revised wages and salaries following updated data sources. The largest impact from revisions to wages and salaries was felt in Quarter 2 (Apr to June) 2017 (revised downwards by £3.2 billion) and it caused a negative 0.9 percentage point revision to the saving ratio, to 4.6%.
See Appendix B for a chart summary of revisions to the saving ratio and for revisions to components of gross savings for 2017.
Nôl i'r tabl cynnwys6. What has happened to the net lending or borrowing positions of UK sectors?
The net lending or borrowing of a sector represents the net resources that the sector makes available to the rest of the economy. It does not necessary refer to actual lending or borrowing in the normal sense, rather, it means that either a sector has money left over after its spending in a given period (net lending), or it has spent more than it received and has a need for financing (net borrowing), which may be covered by borrowing, issuing shares or bonds, or by drawing on reserves.
The position is determined by saving, the balance between national gross disposable income and final consumption expenditure, and is reduced or increased by the balance of capital transfers to provide an amount available for financing investment. The final net lending or borrowing position then reflects total investment in non-financial assets.
If actual investment is lower than the amount available for investment, the balance will be positive – representing net lending. Similarly, if actual investment is higher than the amount available for investment, borrowing is represented.
The only UK sectors in a net lending position in Quarter 1 (Jan to Mar) 2018 were financial corporations and non-profit institutions serving households sectors (albeit by a very small amount at 0.1% of gross domestic product (GDP)). All other UK sectors are currently net borrowers in the non-financial account.
Figure 6 summarises the net lending (positive) or borrowing (negative) positions of UK sectors and the rest of the world, according to the non-financial account, as a percentage of UK GDP. Following Figure 6 is further analysis on each sector’s position.
Figure 6: Net lending (positive) or borrowing (negative) positions of UK sectors and the rest of the world in the non-financial account as a percentage of UK gross domestic product
Quarter 1 (Jan to Mar) 1987 to Quarter 1 (Jan to Mar) 2018
Source: Office for National Statistics
Download this chart Figure 6: Net lending (positive) or borrowing (negative) positions of UK sectors and the rest of the world in the non-financial account as a percentage of UK gross domestic product
Image .csv .xlsNon-financial corporations
Non-financial corporations are made up of two sub-sectors: private non-financial corporations (PNFCs) and public corporations.
PNFCs’ net borrowing decreased in the latest quarter, Quarter 1 2018 by £2.1 billion. Their net borrowing position was 0.8% of GDP compared with 1.2% in the previous quarter. This decrease was due mainly to gross operating surplus, increasing by £3.4 billion.
In November 2017, following changes to the regulation of social housing in England, English housing associations were reclassified back into the private non-financial corporations sector. This reclassification has been implemented in Blue Book 2018 from November 2017, the date the regulations came into force. As a result, public corporations’ net borrowing decreased by £0.6 billion between Quarter 3 (July to Sept) 2017 and Quarter 4 (Oct to Dec) 2017. In the latest quarter, it fell by a further £0.7 billion to 0.0% of GDP. This decrease was due mainly to a fall in both net acquisition of non-produced non-financial assets (£0.7 billion) and gross fixed capital formation (£0.3 billion).
Financial corporations
In the latest quarter, Quarter 1 2018, financial corporations experienced a net lending position for the first time since Quarter 3 2015, at £0.5 billion. As a percentage of GDP, their net lending position in the latest quarter was 0.1% compared with a net borrowing position of 1.1% of GDP in the previous quarter. This switch in positions was due mainly to an increase of £2.3 billion in receipts of distributed income of corporations (which includes dividends and repatriated profits) and reinvested earnings on foreign direct investment (also £2.3 billion).
General government
Government net borrowing increased in the latest quarter, Quarter 1 2018, to £13.1 billion following two consecutive quarters of decreasing borrowing. As a percentage of GDP, general government’s net borrowing position was 2.5% compared with 1.3% in the previous quarter. This movement was driven by a fall in the income received from distributed income of corporations (£3.9 billion) and a £1.9 billion increase in the amount paid in gross national income-based European Union (EU) contributions.
In December 2017, the UK received a credit of £1.2 billion, following amendments to the 2017 EU Budget, which adjusted member states’ contributions. With the refund being larger than the UK contributions, this resulted in lower Quarter 4 2017 borrowing than usual. The increase in Quarter 1 2018 reflects the UK contributions returning to more usual levels. It is also worth noting that amendments to contributions are a regular annual process and are not an unusual occurrence.
Further details on this sector can be found in Public sector finances, UK: December 2017. Note that although public sector finances and national accounts are compiled in accordance with the European System of Accounts: ESA 2010 some differences remain.
Despite some differences, improvements have been incorporated in Blue Book 2018 on continued reconciliation work between the public sector finances statistics and the national accounts; notably the move away from a pure cash recording for Corporation Tax and its replacement with a time-adjusted cash approach, which better aligns the recording of when tax is deemed to be payable with the timing of the economic activity underlying the tax liability. The impacts of these improvements (and others) can be found in the National Accounts articles: Detailed assessment of changes to sector and financial accounts, 1997 to 2016.
Households
It is now the sixth consecutive quarter in which households have been net borrowers, meaning that they had to borrow (or draw on their reserves) in order to fund their spending and investment activities. Up until Quarter 3 2016, the households sector was a net lender.
In Quarter 1 2018, households experienced a net borrowing position of £5.8 billion (negative 1.1% of GDP) – which is also the average over the last six quarters, since they became net borrowers. This was an increase compared with the previous quarter when they were net borrowers of £4.8 billion (negative 0.9% of GDP).
Much of this increase in borrowing was down to an increase in household expenditure (up £4.2 billion) and a fall of £1.6 billion in the adjustment to pension entitlements. Investment in non-financial assets only increased by £0.1 billion. Partly offsetting the increase in borrowing was a £2.6 billion rise in wages and salaries received by households.
Among G7 countries (minus Italy), households are on average net lender. However, even when you exclude the UK, the average net lending position as a percentage of gross domestic product among G7 countries has fallen in the last couple of years. In 2017, the average net lending or borrowing position of households among G7 countries fell to its lowest since 2006 as a percentage of GDP.
Figure 7: Net lending or borrowing position of households in G7 countries as a proportion of gross domestic product
1997 to 2017
Source: Statistics Canada, Bureau of economic analysis, Statistisches Bundesamt (Destatis), Institut national de la statistique et des études économiques, Cabinet office Japan, Office for National Statistics
Notes:
- Households.
- Households and non-profit institutions serving households.
- All series are authors' calculations.
- G7 countries not including Italy (data not accessible).
- Data correct as of 27 June 2018.
Download this chart Figure 7: Net lending or borrowing position of households in G7 countries as a proportion of gross domestic product
Image .csv .xlsNon-profit institutions serving households (NPISH)
In Quarter 1 2018, the NPISH sector was a net lender for the thirteenth consecutive quarter at £0.6 billion (or 0.1% of GDP). This is unchanged from the previous quarter.
The NPISH sector is a relatively small sector compared with other UK sectors. However, the sector (which includes, for example, charities and universities) remains an important one because of its social benefits to society.
Our previous Quarterly sector accounts, UK: October to December 2017 article provided an overview on the net lending or borrowing position of the NPISH sector over time.
Rest of the world
The amount the rest of the world lends to UK sectors decreased slightly in the latest quarter, Quarter 1 2018, by £2.2 billion to £17.9 billion.
In Quarter 1 2018, the decrease in lending fell as a result of a fall in the external balance of goods and services (£1.9 billion) and an increase in the amount they paid in reinvesting earnings on direct UK investment (£4.5 billion).
Further details of the UK Balance of Payments position can be found in the Balance of payments bulletin.
Nôl i'r tabl cynnwys7. Summary of revisions to net lending borrowing positions
Revisions in the latest quarterly sector accounts were significant for some sectors following improvements made as part of the National Accounts, The Blue Book 2018 to be published on 31 July 2018.
A summary of these revisions were highlighted in our National Accounts articles: Detailed assessment of changes to sector and financial accounts, 1997 to 2016.
A summary of revisions in the quarters in 2017 can be seen in Table 1. Most of these revisions are as a result of updated data sources.
Table 1: Summary of revisions to main economic indicators in the UK Quarterly sector accounts, Quarter 1 (Jan to Mar) 2017 to Quarter 4 (Oct to Dec) 2017
| Quarter 1 (Jan to Mar) 2017 to Quarter 4 Oct to Dec) 2017 | ||||||
|---|---|---|---|---|---|---|
| Revisions to Net lending (+) borrowing (-) positions of UK sectors, £ billions | ||||||
| Non-financial account (B.9n) | ||||||
| Non- financial corporations | Financial corporations | General government | Households | NPISH1 | Rest of the world | |
| 2017 Q1 | 0.6 | 2.6 | -1 | -1.4 | -0.1 | -3.2 |
| 2017 Q2 | -0.4 | 1.6 | 1.8 | -3.1 | -0.1 | -2.3 |
| 2017 Q3 | -5.5 | 2.6 | 3 | -3.2 | -0.1 | 0.8 |
| 2017 Q4 | -6.2 | 2.3 | 2.6 | -2.6 | 0.1 | 1.3 |
| Revisions to Net lending (+) borrowing (-) positions of UK sectors, £ billions | ||||||
| Financial account (B.9f) | ||||||
| Non- financial corporations | Financial corporations | General government | Households | NPISH1 | Rest of the world | |
| 2017 Q1 | -22.4 | 6.6 | -0.4 | 2.8 | 0.7 | 12.7 |
| 2017 Q2 | 0.5 | 1.8 | 4.3 | -6.3 | 0.3 | -0.6 |
| 2017 Q3 | -13.2 | 6.2 | 3.3 | 2.4 | -0.8 | 2.1 |
| 2017 Q4 | 2.1 | 18 | -0.5 | 1.3 | 0.6 | -21.6 |
| Revisions to other key economic indicators | ||||||
| Households sector | ||||||
| RHDI2 growth rate (quarter on previous quarter, %) | Saving ratio (%) | HHFCE3 Deflator (index points) | ||||
| 2017 Q1 | 0 | -0.7 | -1.2 | |||
| 2017 Q2 | -0.7 | -0.9 | -1.3 | |||
| 2017 Q3 | 0.1 | -0.8 | -1.5 | |||
| 2017 Q4 | -0.5 | -0.7 | -1.3 | |||
| Source: Office for National Statistics | ||||||
| Notes: | ||||||
| 1. Non-profit institutions serving households. | ||||||
| 2. Real households' disposable income. | ||||||
| 3. Households' final consumption expenditure deflator. | ||||||
Download this table Table 1: Summary of revisions to main economic indicators in the UK Quarterly sector accounts, Quarter 1 (Jan to Mar) 2017 to Quarter 4 (Oct to Dec) 2017
.xls (39.4 kB)8. National accounts articles
We published an article stating the impacts on the sector and financial accounts following changes made in Blue Book 2018. A detailed assessment on the indicative impacts can be found in National Accounts articles: Detailed assessment of changes to sector and financial accounts, 1997 to 2016.
Our national accounts publication Blue Book 2018 is to be published on 31 July 2018.
Nôl i'r tabl cynnwys11. Changes to this bulletin
Changes to Quarterly sector accounts datasets
No changes were made to the latest Quarterly sector accounts dataset.
If you have any suggestions please contact us by email at sector.accounts@ons.gov.uk.
We also maintain an email subscription list informing interested people when there are planned changes to the bulletin. If you wish to subscribe to this list, please email us with “subscribe” as the subject line.
Nôl i'r tabl cynnwys12. Quality and methodology
The Quarterly sector accounts Quality and Methodology Information report contains important information on:
the strengths and limitations of the data and how it compares with related data
uses and users of the data
how the output was created
the quality of the output including the accuracy of the data
The Quarterly sector accounts and the UK Economic Accounts are published at quarterly, pre-announced intervals alongside the Quarterly national accounts and Quarterly balance of payments statistical bulletins.
Nôl i'r tabl cynnwys13. Appendix A: Revisions to real household disposable income growth
Figure 8: Revisions to real household disposable income growth rate, seasonally adjusted
1997 to 2017
Source: Office for National Statistics
Download this chart Figure 8: Revisions to real household disposable income growth rate, seasonally adjusted
Image .csv .xls
Figure 9: Revisions to the sub-components of gross disposable household income, seasonally adjusted
Quarter 1 (Jan to Mar) 2017 to Quarter 4 (Oct to Dec) 2017
Source: Office for National Statistics
Download this chart Figure 9: Revisions to the sub-components of gross disposable household income, seasonally adjusted
Image .csv .xlsFor revisions between 1997 and 2016, see National Accounts articles: Detailed assessment of changes to sector and financial accounts, 1997 to 2016.
Nôl i'r tabl cynnwys14. Appendix B: Revisions to the Household saving ratio
Figure 10: Revisions to the households’ saving ratio, seasonally adjusted
Quarter 1 (Jan to Mar) 1987 to Quarter 1 (Jan to Mar) 2017
Source: Office for National Statistics
Download this chart Figure 10: Revisions to the households’ saving ratio, seasonally adjusted
Image .csv .xls
Figure 11: Revisions to the sub-components of gross savings, seasonally adjusted
Quarter 1 (Jan to Mar) 2017 to Quarter 4 (Oct to Dec) 2017
Source: Office for National Statistics
Download this chart Figure 11: Revisions to the sub-components of gross savings, seasonally adjusted
Image .csv .xlsFor revisions between 1997 and 2016, see National Accounts articles: Detailed assessment of changes to sector and financial accounts, 1997 to 2016.
Nôl i'r tabl cynnwys15. Acknowledgements
The author, Michael Rizzo, would like to express his thanks to Freddy Farias Arias at Office for National Statistics for his contributions to this work.
Nôl i'r tabl cynnwys