Cynnwys
- Key points
- Overview
- Background
- Key terms
- Changes to methodology
- What do you think?
- Capital stocks and consumption of fixed capital in detail
- Analysis by institutional sector
- Analysis by type of asset
- Analysis by industry
- Capital output ratio analysis
- Net capital stocks per employed person
- International comparisons
- Background notes
- Methodoleg
1. Key points
This is the first publication of capital stock estimates since 2010. Estimates of capital stocks and consumption of fixed capital are now produced using a new methodology, as explained in the methodological changes to the estimation of capital stocks and consumption of fixed capital and impact of the methodological changes to the estimation of capital stocks and consumption of fixed capital articles published in June and July 2014. Users are strongly advised to read these articles and the background notes of this release
All data referred to in this bulletin are annual estimates of chained volume measures (CVM), unless specified otherwise
The United Kingdom’s (UK) net capital stock was estimated at £3.5 trillion at the end of 2012. Between 1998 and 2007, annual growth averaged at 1.9% but this slowed between 2008 and 2012 to 1.1%. Since 1997, estimates of net capital stocks increased by £750 billion (28%)
Consumption of fixed capital for the UK was estimated at £183 billion in 2012, an increase of £40 billion (28%) compared with 1997. However, the 2012 estimate remains £13 billion (6%) below the 2007 peak for this series, having fallen during the economic downturn
Services industries held an estimated 79% of total net capital stocks at the end of 2012
In 2012 the level of net capital stock per employed person fell by 1% following a slowdown in growth in 2010 and 2011
This release contains analysis of the capital stock to output ratio, and ratio of capital stock to employment
2. Overview
This is the first publication of capital stock estimates since 2010, as explained in the methodological changes to the estimation of capital stocks and consumption of fixed capital and impact of the methodological changes to the estimation of capital stocks and consumption of fixed capital articles published in June and July 2014. The information within these articles will assist users’ interpretation of these statistics as there have been significant changes to methodology since the last release of these estimates in 2010. The background notes of this release contain further information on understanding and using the data. Users may also find the definitions in the ‘key terms’ section useful.
The estimates in this release cover the period 1997 to 2012. Estimates for 2013 will be published in the next release of these data in November 2014. Estimates for periods before 1997 are not yet available. ONS is working to re-instate these estimates and provide users with a longer time series. A progress update on the pre-1997 estimates will be included in the November 2014 publication.
All data referred to in this bulletin are annual estimates of chained volume measures (CVM). These are time series put in real terms by computing the volume of each year in the prices of the preceding year. The data are then chained together to obtain a time series of production figures from which the effect of price changes have been removed. The CVMs in this publication are referenced to 2010. Current Price estimates are available in the tables and time series dataset.
This bulletin is split into five main sections:
Background
Key terms
Changes to methodology
Capital stocks and consumption of fixed capital in detail
Background notes
3. Background
Capital stocks and the consumption of fixed capital are estimated using the Perpetual Inventory Method (PIM). The PIM models capital stocks and capital consumption from estimates of gross fixed capital formation (GFCF). It is described in greater detail in the background notes of this release.
Estimates of GFCF and its breakdowns by sector and asset (from 1997) are published separately in the quarterly Business Investment Statistical Release.
Image 1 shows how gross capital stocks are calculated using the PIM. The cumulative sum of net investment in assets (GFCF), i.e. the capital stock, is calculated by adding investment this period to the capital stock in the previous period and subtracting the value of assets which have reached the end of their useful life or that have been scrapped as a result of bankruptcy. The PIM replicates this process for each industry and asset combination for every year of data in the model.
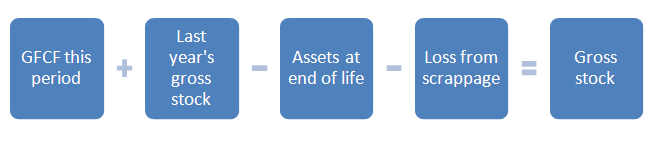
Image 2 shows how net capital stocks are calculated. This is also a ‘stock’ measure and estimates the value at the end of the year. The same process that is used for the estimation of gross stocks is used; however, an additional component for depreciation (for example, from wear and tear) is subtracted from the gross value. This can be thought of as the quantity of assets ‘used up’ in a year. At the end of an asset’s service life, its whole value has been ‘used up’, and it no longer contributes to the net (or gross) stock level.

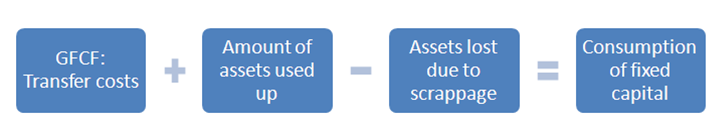
The consumption of fixed capital is an estimate of a ‘flow’. It represents the change in the value of assets during the year. Image 3 shows that it is made up of the sum of transfer costs (costs associated with purchasing or disposing of an asset) from GFCF, the depreciation or loss in value of assets due to usual wear and tear as well as the value of assets lost when companies go bankrupt. This value is calculated for each year within the model.
Further explanations of the terms used are available in the key terms section of this release.
Capital stocks and the consumption of fixed capital estimates are produced annually and used by ONS in the compilation of the UK National and Economic Accounts and Public Sector Finances. They are also used by the Bank of England (BoE), the Office for Budgetary Responsibility (OBR), Her Majesty’s Treasury (HMT), the Department for Business, Innovation and Skills (BIS), the Statistical Office of the European Union (Eurostat), business and research communities, educational communities, the media and the general public. These estimates are used to monitor economic performance and inform monetary and fiscal policy decisions, as well as for international comparisons.
Nôl i'r tabl cynnwys4. Key terms
Capital stocks represent the value of all fixed assets used in production in the economy that are still in use, such as machinery, dwellings and intangible fixed assets such as software
Economic assets are a store of value representing the benefits the economic owner will get by holding or using the asset over a period of time
Fixed assets are non-financial items which are used repeatedly in the process of production for more than one year, for example, a machine on a production line or software used in production
Gross capital stocks tell us how much the economy’s assets would cost to buy again as new, or their replacement cost. All of the fixed assets in the economy, that are still productive and in use, are added up to calculate this, regardless of how old they are or how much they may have deteriorated since they were first used. This measure shows the value at the end of the quarter or year. This is mainly calculated as an intermediate step towards net capital stocks but individually provides a broad indicator of the productive capacity of an economy
Net capital stocks show the market value of fixed assets. The market value is the amount that the assets could be sold for, which will be lower than the value of gross capital stocks. This reflects the fact that the assets will have had some wear and tear compared to a new asset. This measure shows the value at the end of the quarter or year. This measure is used in preference to gross capital stocks as it provides a valuation of assets in the economy after depreciation has been removed
The consumption of fixed capital is the decline in the value, or depreciation, of fixed assets in the economy over a time period. The decline in value can be due to wear and tear, assets no longer being used, or normal accidental damage. It can also be described as the quantity (or value) of the capital stocks which is used up in that period. Whilst these data are interesting, their primary purpose is to move from various gross measures of economic flows to the corresponding “net” variable, in particular for production and income (net domestic product, net value added) and a number of demand variables such as net investment
Gross fixed capital formation (GFCF) is the acquisition less disposals of produced fixed assets; that is assets intended for use in the production of other goods and services for a period of more than a year. Acquisition includes both purchases of assets (new or second-hand) and the construction of assets by producers for their own use. New buildings and dwellings, and major improvements to buildings and dwellings are included in GFCF, but the acquisition and disposal of existing buildings and dwellings are not
Current prices (CP), also known as nominal terms, are the value for an item expressed in terms of the prices of that period, for example the cost of a new machine bought in 1998 in 1998 prices
Constant price (KP) series have had the effects of inflation or deflation removed by fixing the prices of goods and services in one period (the base year), so that only the volumes change. For example the cost of a new machine bought in 1998 in 2009 prices
Chained volume measures (CVM) are a series of economic data from successive years put in real terms by computing the production volume for each year in the prices of the preceding year. The data are then chain linked together to obtain a time-series of production figures from which the effects of price changes (that is, monetary inflation or deflation) have been removed. In other words, a series is obtained from the raw data which reflects only the production volume
Institutional sectors are defined in the System of National Accounts (SNA) glossary as: units that are grouped together to form institutional sectors; on the basis of their principal functions, behaviour and objectives
The institutional units of the UK that make up the total economy are grouped into five mutually exclusive sectors:
Non-financial corporations
Financial corporations
General government
Non-profit institutions serving households
Households
In the case of the non-financial sector, it can be further broken down into the private sector (those units controlled by private individuals or groups), and public corporations (units controlled by the state).
Nôl i'r tabl cynnwys5. Changes to methodology
There have been a number of improvements and key changes to the methodology for estimating capital stocks and the consumption of fixed capital. The most significant changes are summarised below:
changes to the estimation of GFCF – there have been significant changes to the estimation of GFCF since the 2010 publication. These, and their impact on estimates of GFCF, are described in detail in the article Explaining UK Investment Estimates: past, present & future (654.1 Kb Pdf) , published in March, 2014
the inclusion of cultivated assets in the estimates for the first time
new data sources for artistic originals and operating surplus mark-up for own account software
changes to the Standard Industrial Classification (SIC) - this has been updated from SIC 2003 to SIC 2007, and has an impact on the industry breakdowns
changes to the level of detail in the PIM - now processes data for series at the asset by industry level, with no further breakdown by institutional sector. In the 2010 estimates, processing in the PIM was carried out at the asset by industry by sector level
changes to the methods for estimation of breakdowns by institutional sector – now estimated using fixed proportions, rather than being processed throughout at the sector level
changes to the deflation methodology – now uses the GFCF weighted asset deflators implemented for GFCF in Blue Book 2013 (1997-present), which replaces the 2010 asset by industry deflators
The key areas of improvements still to be implemented are:
restore consistency with other National Accounts publications – due in Blue Book 2014. These estimates are not consistent with the 2013 United Kingdom National Accounts (Blue Book). These estimates have been produced using Blue Book 2013 GFCF methods (see Explaining UK Investment Estimates: past, present & future) plus reconverted GFCF source data, for all years, from SIC 2003 to SIC 2007; the data does not include European System of Accounts (ESA) 2010 changes. Consistency will be restored with the next publication of this release (scheduled for November 2014), which will be consistent with the estimates used in Blue Book 2014 (including ESA10 changes)
produce estimates for General, Central and Local Government using the new methodology. As consequence of Blue Book 2014 timetable constraints, ONS has been unable to fully implement the new methodology to produce estimates for the central and local government sectors. As a result, the sector totals used in the previous publication in 2010 have been maintained and the estimates for 2010 to 2012 have been forecast for these sectors based on historic trends. A key input to the estimates of capital stocks and the consumption of fixed capital are gross fixed capital formation (GFCF) investment estimates which come from sample surveys and administrative sources. This means that any updates to gross fixed capital formation (GFCF) for these sectors are not reflected in this release. All other sectors have been produced using ONS’ new system and methods. ONS will aim to resolve this issue in time for the publication of Blue Book 2016
provide a breakdown for institutional sector non-financial corporations (S.11) into public corporations (S.11001) and private non-financial corporations (S.11PR). It has not been possible to provide a breakdown of the institutional sector non-financial corporations (S.11), into public corporations (S.11001) and private non-financial corporations (S.11PR). ONS will provide an institutional sector breakdown into S.11001 and S.11PR in Capital Stocks, Consumption of Fixed Capital, 2014 to be published in November 2014. ONS will aim to provide a breakdown by asset for both of these institutional sectors in time for the publication of Blue Book 2016
fully introduce new data for NPISH. In these estimates and for Blue Book 2014, ONS has implemented the new methodology to produce estimates for the non-profit institutions serving households (NPISH) sector. NPISH includes for example charities and trade unions. However, the NPISH data from the PIM model were fixed at an early stage of the production process due to deliveries required to meet the Blue Book 2014 timetable. NPISH estimates have not been re-calculated by the PIM since this time, therefore they are inconsistent with the outputs for other non-government sectors. ONS plans to remove this inconsistency when the National Accounts revision policy allows
For a full description of the changes, and an assessment of the impact they have had on the estimates of capital stocks and the consumption of fixed capital, please see the methodological changes to the estimation of capital stocks and consumption of fixed capital and impact of the methodological changes to the estimation of capital stocks and consumption of fixed capital articles published on 25 June and 02 July 2014.
Consistency with other publications
These estimates are not consistent with the 2013 United Kingdom National Accounts (Blue Book). These estimates have been produced using Blue Book 2013 GFCF methods (see Explaining UK Investment Estimates: past, present & future) plus reconverted GFCF source data, for all years, from SIC 2003 to SIC 2007; the data does not include European System of Accounts (ESA) 2010 changes. Consistency will be restored with the next publication of this release (scheduled for November 2014) which will be consistent with the estimates used in Blue Book 2014 (including ESA10 changes).
As a consequence of the Blue Book 2014 delivery timetable, ONS has been unable to fully implement the new methodology to produce estimates for the central and local government sectors. As a result, the sector totals last published in 2010 (for these sectors only) have not been revised. Estimates for 2010 to 2012 have been forecast, based on historic trends. As such, any updates to GFCF for these sectors are not reflected in this release.
ONS has also been unable to provide an institutional sector and asset breakdown of non-financial corporations (S.11), into public corporations (S.11001) and private non-financial corporations (S.11PR). This was also due to the constraints of the Blue Book 2014 delivery timetable and the requirement for additional quality assurance of the asset breakdowns.
ONS will aim to resolve both these issues in time for the publication of Blue Book 2016.
All estimates cited in this publication are available for download in the accompanying time series dataset and in the publication tables.
Nôl i'r tabl cynnwys6. What do you think?
ONS are striving to improve this release and its associated commentary. We would welcome any feedback you may have, and would be particularly interested in knowing how you make use of these data to inform your work. Please contact us via email: gcf@ons.gov.uk or telephone Wesley Harris on +44 (0)1633 455250.
Nôl i'r tabl cynnwys7. Capital stocks and consumption of fixed capital in detail
Estimates of capital stocks and the consumption of fixed capital tend to follow a relatively smooth path over time, because they are recorded as accumulated balances. Nevertheless, in cases where the asset price or GFCF have changed significantly, changes in the rate of increase or decrease in the capital stock can be observed.
Although the level of real fixed GFCF investment fell sharply during the economic downturn, by 6.9% in 2008 and 16.7% in 2009, capital stock growth remained positive during these years. This is because despite falling sharply, the level (or flow) of fixed GFCF investment remained positive and above the level of depreciation in the capital stock. This meant that both gross and net capital stock continued to grow in 2008 and 2009, albeit at slower rates compared with the decade prior to the downturn.
Estimates of gross and net capital stocks, and the consumption of fixed capital are available in both CP and CVMs in the accompanying time series dataset and in the publication tables.
Gross capital stocks
The chained volume measure of UK gross capital stocks was estimated at £6 trillion at the end of 2012, an increase of 33% since 1997 (equivalent to 1.9% growth per annum). In the decade prior to the economic downturn, gross capital stock rose on average by 2.1% per annum, however this slowed to 1.5% per annum between 2007 and 2009. In subsequent years, gross capital stock growth increased but, on average, remained below rates seen prior to the downturn (see Table 1).
Table 1: Average annual growth in the capital stock chained volume measures
| Reference year: 2010 Coverage: United Kingdom | ||||
| 1998-2007 | 2008-2009 | 2010-2012 | 1998-2012 | |
| Gross stock | 2.1% | 1.5% | 1.7% | 1.9% |
| Net stock | 1.9% | 1.1% | 1.1% | 1.6% |
| Consumption of fixed capital | 3.2% | -5.0% | 1.2% | 1.7% |
| Source: Office for National Statistics | ||||
Download this table Table 1: Average annual growth in the capital stock chained volume measures
.xls (25.6 kB)Net capital stocks
Net capital stocks account for the depreciation in assets, so both the level and the rate of increase in the net stock will be lower compared with gross stock (figure 1). Chained volume measures of UK net capital stocks were estimated at £3.5 trillion at the end of 2012, an increase of 28% since 1997 (equivalent to 1.6% growth per annum).
As with the gross capital stock estimates, net capital stock growth also slowed during the economic downturn, to an annual average growth rate of 1.1% compared with 1.9% annual growth prior to the downturn. Growth in subsequent years remained subdued, with net stock rising by just 0.7% and 1.1% in 2011 and 2012 respectively.
Figure 1: Gross and net capital stocks chained volume measures
Reference year: 2010 Coverage: United Kingdom
Source: Office for National Statistics
Download this chart Figure 1: Gross and net capital stocks chained volume measures
Image .csv .xlsConsumption of fixed capital
At the end of 2012, the chained volume measure of UK consumption of fixed capital was estimated at £183 billion, an increase of 28% since 1997 (equivalent to 1.7% growth per annum). In contrast with the gross and net capital stock estimates, capital consumption is a flow variable and showed negative growth during the economic downturn. The level of consumption of fixed capital peaked in 2007 at £196 billion, but fell by 7.4% and 2.6% in 2008 and 2009 respectively to reach £176 billion in 2009. This was caused by a sharp fall in household transfer costs (costs associated with purchasing or disposing of an asset), which can be attributed to the adverse impact of the financial market shock on the housing market. Growth in the consumption of fixed capital subsequently picked up, albeit at a slower rate compared with pre-downturn rates. In 2012, the level of the consumption of fixed capital was £13 billion lower than the 2007 peak (see Figure 2).
Figure 2: Consumption of fixed capital estimates chained volume measures
Reference year: 2010 Coverage: United Kingdom
Source: Office for National Statistics
Download this chart Figure 2: Consumption of fixed capital estimates chained volume measures
Image .csv .xlsAlso published as part of this release are estimates of the gross capital stock, net capital stock, and consumption of fixed capital at an institutional sector, asset and industry level. Further information on the detailed classification of these three areas can be found in the ONS ‘concepts, sources and methods’ publication.
Nôl i'r tabl cynnwys8. Analysis by institutional sector
The percentage share of net capital stocks owned by the institutional sectors remained relatively stable between 1997 and 2012 in CVM terms. The net capital stocks estimates have been used for this analysis because it is a measure of the market value of fixed assets, that is, what these assets were worth at the time. Users will notice a large change in estimates of ‘other machinery and equipment’, in non-financial corporations (S.11) and central government (S.13) in 2005. This was due to the reclassification of British Nuclear Fuels Limited (BNFL) in April 2005 - more information is available in the background notes.
At the end of 2012, non-financial corporations (NFCs) were estimated to have held the largest share of total net capital stock at £1.5 trillion (43%), followed by the households and non-profit institutions serving households (NPISH) sector which held an estimated £1.3 trillion (38%) of assets.
Within this, NFCs held the largest number of assets in ‘other buildings and structures’, at £805 billion (54% of total net capital stock held by NFCs). Households and NPISH primarily held assets in dwellings (excluding land) at £1.3 trillion (96% of total net capital stock held by households).
Figure 3: Net capital stocks by institutional sector, 1997 and 2012, chained volume measures
Reference year: 2010 Coverage: United Kingdom
Source: Office for National Statistics
Notes:
- (a) NPISH stands for non-profit institutions serving households, such as universities and charities. (b) General Government (i.e. Central and Local Government) sectors have been forecast based on historic trends, any updates to GFCF for these sectors are not reflected in the estimates in this release – see changes to methodology section for further details
Download this chart Figure 3: Net capital stocks by institutional sector, 1997 and 2012, chained volume measures
Image .csv .xlsFigure 3 and Table 2 show that all institutional sectors experienced growth in net capital stocks between 1997 and 2012, albeit at different rates. In percentage terms, general government experienced the strongest growth at 56% (equivalent to 3.0% per annum), followed by NFCs at 27% (equivalent to 1.6% per annum) and financial corporations, which rose by 24% (an increase of 1.5% per annum). Households and NPISH increased by 19%, or 1.2% per annum.
Table 2 shows that the economic downturn affected the growth of net capital stock to varying degrees by institutional sectors. For example, growth in net capital stock held by financial corporations was adversely affected by the downturn, falling from 2.0% per annum in the pre-downturn decade, to 0.8% in 2008 and 2009 before falling again to just 0.3% on average in subsequent years. In contrast, growth in net capital stock held by general government remained stable during the downturn at 2.6%, before rising strongly in subsequent years.
Table 2: Average annual growth in the net capital stock by institutional sector
| Chained Volume Measures | ||||
| 1998-2007 | 2008-2009 | 2010-2012 | 1998-2012 | |
| Non-financial corporations | 1.9% | 1.2% | 0.8% | 1.6% |
| Households and NPISH | 1.6% | 0.5% | 0.0% | 1.2% |
| General Government | 2.6% | 2.6% | 4.6% | 3.0% |
| Financial corporations | 2.0% | 0.8% | 0.3% | 1.5% |
| Total net capital stock | 1.9% | 1.1% | 1.1% | 1.6% |
| Source: Office for National Statistics | ||||
Download this table Table 2: Average annual growth in the net capital stock by institutional sector
.xls (33.3 kB)Figure 4 highlights the contribution that each institutional sector made to annual growth in the net capital stock between 1998 and 2012. It shows that the strong rise in general government net capital stock growth partially offset slower net stock growth for households and NFCs, which accounted for a relatively higher share of the level over the entire period. It also shows a gradual slowdown in the contribution made from financial corporations over the entire period.
Figure 4: Contributions to annual net stock growth by institutional sector chained volume measures, %
Reference year: 2010 Coverage: United Kingdom
Source: Office for National Statistics
Download this chart Figure 4: Contributions to annual net stock growth by institutional sector chained volume measures, %
Image .csv .xls9. Analysis by type of asset
Figure 5 shows that ‘dwellings’ accounted for the largest share of assets in 2012, at £1.4 trillion (41.2% of the total net capital stocks in 2012). ‘Other buildings and structures’ accounted for the second largest share at 37.8% (£1.3 trillion in 2012), while ‘other machinery and equipment’, ‘intangible fixed assets’ and ‘other assets’ follow with 15.1%, 3.3% and 2.7% respectively.
Figure 5: Net capital stocks estimates by asset, 1997 and 2012, chained volume measures
Reference year: 2010 Coverage: United Kingdom
Source: Office for National Statistics
Notes:
- (a) Intangible fixed assets include software, entertainment and mineral exploration. (b) Other assets includes transport equipment and cultivated assets
Download this chart Figure 5: Net capital stocks estimates by asset, 1997 and 2012, chained volume measures
Image .csv .xlsFigure 5 and Table 3 show that net capital stocks of ‘intangible fixed assets’ were the only assets to decrease between 1997 and 2012, falling by 2% per annum on average over the entire period. The asset that experienced the strongest growth was ‘other machinery and equipment’, which increased by 50% over the entire period (or 2.7% per annum), followed by ‘other buildings and structures’, which increased by 42% since 1997 (2.4% per annum).
Table 3 shows that the economic downturn affected the pace of net capital stock accumulation by varying amounts across assets. For example, ‘other buildings and structures’ rose at broadly similar rates across the pre-downturn (2.4%), downturn (2.4%), and post-downturn (2.5%) periods. In contrast, ‘other machinery and equipment’ growth fell to 1.0% and 0.8% during the downturn and in subsequent years, compared with 3.7% average annual growth in the pre-downturn decade.
Table 3: Average annual growth in net capital stock by asset
| Chained Volume Measures (CVM) | ||||
| 1998-2007 | 2008-2009 | 2010-2012 | 1998-2012 | |
| Dwellings | 1.4% | 0.5% | 0.2% | 1.0% |
| Other buildings and structures | 2.4% | 2.4% | 2.5% | 2.4% |
| Other machinery and equipment | 3.7% | 1.0% | 0.8% | 2.7% |
| Intangible fixed assets | -2.0% | -2.5% | -1.8% | -2.0% |
| Other assets | 1.6% | -0.7% | 0.0% | 1.0% |
| Total net stock | 1.9% | 1.1% | 1.1% | 1.6% |
| Source: Office for National Statistics | ||||
Download this table Table 3: Average annual growth in net capital stock by asset
.xls (26.1 kB)Figure 6 decomposes annual net capital stock growth between 1998 and 2012, according to the contribution made from the headline assets cited in Table 3. The largest growth in net capital stock between 1998 and 2012 was in ‘other machinery and equipment’ (2.7%) and ‘other buildings and structures’ (2.4%). This reflected relatively strong growth in both assets and the relatively large share of ‘other buildings and structures’. ‘Intangible fixed assets’ showed a consistently negative contribution to growth. During the economic downturn, ‘other buildings and structures’ continued to make strong positive contributions to annual growth, while the contributions from ‘other machinery and equipment’ and ‘dwellings’ fell and have not increased since.
Figure 6: Contributions to annual net stock growth by asset chained volume measures, %
Reference year: 2010 Coverage: United Kingdom
Source: Office for National Statistics
Download this chart Figure 6: Contributions to annual net stock growth by asset chained volume measures, %
Image .csv .xlsAsset and sector estimates for all measures of capital stock and capital consumption for CP and CVMs are available in the accompanying time series dataset and in the publication tables.
Nôl i'r tabl cynnwys10. Analysis by industry
Estimates of capital stocks and the consumption of fixed capital can be analysed by industry using the UK Standard Industrial Classification 2007.
In these estimates there are four broad industry groupings; manufacturing, other production (agriculture, mining, electricity, gas, water and waste), construction and services. The share of the net capital stock held by the four broad industry groupings reflects the relative sizes of these groups in nominal Gross Value Added (GVA) terms. Table 4 shows that the services industries (sections G-T) held an estimated £2,769 trillion (79%) of total net capital stocks at the end of 2012. Other production industries (sections A, B, D and E) held £279 billion (8%); construction (section F) held £248 billion (7%) and manufacturing (section C) held £200 billion (6%). Since 1997, the percentage share of these industry groupings was relatively stable, although both the other production and service industries increased their percentage shares by 2% since 1997, while the manufacturing and construction industries both reduced their percentage share by 2%.
Table 4: The value in £ billion and percentage of net capital stocks held by broad industry groupings, 1997 and 2012
| Chained Volume Measures (CVM) | |||||||
| 1997 | 2012 | Year on year change £bn | Year on year % change | ||||
| Net capital stocks £bn | Share of assets held % | Net capital stocks £bn | Share of assets held % | ||||
| ABDE | Other production | 160 | 6 | 279 | 8 | 119.2 | 2.1 |
| C | Manufacturing | 199 | 7 | 200 | 6 | 0.8 | -1.5 |
| F | Co | 252 | 9 | 248 | 7 | -4.8 | -2.1 |
| G to T | Services | 2,128 | 78 | 2,769 | 79 | 641.4 | 1.6 |
| TOTAL | Total | 2,740 | 100 | 3,496 | 100 | 755.9 | 0.0 |
| Source: Office for National Statistics | |||||||
Download this table Table 4: The value in £ billion and percentage of net capital stocks held by broad industry groupings, 1997 and 2012
.xls (34.3 kB)
Figure 7: Net capital stocks by broad industry groups, 1997 and 2012 chained volume measures
Reference year: 2010 Coverage: United Kingdom
Source: Office for National Statistics
Notes:
- (a) Other production includes agriculture, mining, electricity, gas, water and waste management
Download this chart Figure 7: Net capital stocks by broad industry groups, 1997 and 2012 chained volume measures
Image .csv .xlsThe types of fixed assets held as stock by the industrial sectors varied. For example, in 2012 service industries held the majority of their total net stocks either in ‘dwellings’ (£1,296 billion or 47%), or in ‘other buildings and structures’ (£985 billion or 36%).
Other production industries also held the majority of their total capital stocks as ‘other buildings and structures’ (£172 billion or 62%), however they also held a significant proportion of capital stocks as ‘other machinery and equipment’ (£87 billion or 32%).
The construction industry held the majority of their capital stocks in ‘dwellings’ (£144 billion or 58%) and ‘other buildings and structures’ (£89 billion or 36%).
In contrast, manufacturing industries held the majority of their capital stocks in ‘other machinery and equipment’ at (£116 billion or 58%) while ‘other buildings and structures’ accounted for a relatively small proportion (£75 billion or 37%).
Table 5: Net capital stock as a percentage of fixed assets held by asset and broad industry groups 2012
| Current prices (CP) | |||||||
| % | |||||||
| ABDE Other production | C Manufacturing | F Construction | G to T Services | Total | |||
| Other machinery and equipment | 32 | 58 | 4 | 11 | 15 | ||
| Transport equipment | 2 | 0 | 1 | 3 | 3 | ||
| Dwellings (excl land) | z | z | 59 | 47 | 41 | ||
| Other buildings and structures | 61 | 37 | 36 | 35 | 37 | ||
| Intangible fixed asssets | 3 | 4 | 0 | 3 | 3 | ||
| Cultivated assets | 2 | z | z | z | 0 | ||
| Total fixed assets | 100 | 100 | 100 | 100 | 100 | ||
| Source: Office for National Statistics | |||||||
| Notes: | |||||||
| 1. (a) Totals may not sum due to rounding | |||||||
| 2. z = data not applicable for this asset in this industry | |||||||
Download this table Table 5: Net capital stock as a percentage of fixed assets held by asset and broad industry groups 2012
.xls (27.1 kB)As with the institutional sector and asset breakdowns, growth in net capital stock showed variation across the industries (Table 6). For example, the net capital stock held by manufacturing industries fell during the economic downturn, by 0.7% on average per annum in 2008 and 2009, before continuing to fall by 0.9% between 2010 and 2012. In contrast, growth in the net capital stock held by other production industries rose by 4.6% during the downturn, from 3.6% in the pre-downturn decade, and remained at this level in the most recent years.
Table 6: Average annual growth in net capital stock by industry
| Chained Volume Measures (CVM) | ||||
| Net stock by industry (CVM) | 1998-2007 | 2008-2009 | 2010-2012 | 1998-2012 |
| Manufacturing | 0.5% | -0.7% | -0.9% | 0.0% |
| Other production | 3.6% | 4.6% | 3.9% | 3.8% |
| Construction | 0.3% | -0.8% | -1.0% | -0.1% |
| Services | 2.1% | 1.2% | 1.2% | 1.8% |
| Total net stock | 1.9% | 1.1% | 1.1% | 1.6% |
| Source: Office for National Statistics | ||||
Download this table Table 6: Average annual growth in net capital stock by industry
.xls (25.6 kB)Reflecting the growth rates and the relative shares in Tables 5 and 6, Figure 8 shows that services industries consistently made the largest positive contribution to annual growth in the total net capital stock between 1998 and 2012. However, contributions from this industry fell during the economic downturn, while the contribution made from other production industries remained broadly stable.
Figure 8: Contributions to annual net capital stock growth by industry chained volume measures, %
Reference year: 2010 Coverage: United Kingdom
Source: Office for National Statistics
Download this chart Figure 8: Contributions to annual net capital stock growth by industry chained volume measures, %
Image .csv .xlsEstimates by industry for all measures are available in the accompanying time series dataset and in the publication tables.
Nôl i'r tabl cynnwys11. Capital output ratio analysis
The capital output ratio is calculated by dividing capital stocks estimates by Gross Value Added (GVA), to obtain a measure of the capital intensity of each industry. GVA is the value of output less the value of intermediate consumption; it is a measure of the contribution to Gross Domestic Production (GDP) made by an individual producer, industry or sector. Intermediate consumption consists of the value of the goods and services consumed as inputs by the process of production, excluding fixed assets whose consumption are recorded as consumption of fixed capital; the goods or services may be either transformed or used up by the production process.
The capital output ratio shows the ratio of capital stocks to output. It has been calculated for gross and net capital stocks measures in the publication tables back to 1997.
All else being equal, if there is a higher level of capital stock in the economy; workers should theoretically be able to produce a greater quantity or quality of output using the same quantity of labour input. Thus, higher level of productivity arises because workers have more, or better tools or facilities at their disposal.
Figure 9 shows that using this measure, the most ‘capital intensive’ industry in 2012 was the real estate industry, which held the vast majority of its assets in dwellings. Manufacturing, construction and utilities industries also showed relatively high levels of ‘capital intensity’ (of which a smaller proportion of this can be attributed to dwellings). In contrast, other professional and government services industries showed smaller rates of capital intensity.
Figure 9: Capital intensity by industry sector
Net stocks in 2012 divided by Gross Value Added (GVA) in 2012
Source: Office for National Statistics
Download this chart Figure 9: Capital intensity by industry sector
Image .csv .xlsIndustries have different levels of capital output ratios over time, as shown in Figure 10, which indexes the aforementioned ratios to 2010=100. An increase in a line shows that the capital output ratio has increased. Construction and manufacturing rose sharply in their intensity in 2008; this was because the level of GVA fell during this period while the capital stock continued to grow.
Figure 10: Net capital stocks to output ratio, chained volume measures
ratio of net stock (NS): Gross Value Added (GVA)
Source: Office for National Statistics
Notes:
- Index 2010=100
Download this chart Figure 10: Net capital stocks to output ratio, chained volume measures
Image .csv .xlsCapital output ratio estimates by industry for all measures are available in the accompanying time series dataset and in publication tables.
Nôl i'r tabl cynnwys12. Net capital stocks per employed person
In this release, ONS have also published data for the level of capital stock per employed person. Net capital stocks are used in this calculation because they provide a better estimate of the value of capital stocks at a point in time than gross stocks. Data on employment includes both employees and the self-employed by industry sector, sourced from table EMP14 (262.5 Kb Excel sheet) of the ONS Labour Market Statistics, May 2014.
Figure 11 shows the annual growth in capital stock per employee from 1998 to 2012. Between 2008 and 2009 there were sharp rises, reflecting a sharp fall in employees, which more than offset slower capital stock growth during this period. In the most recent years, this ratio rose at a slower rate and even fell in 2012. This suggested that firms were diverting resources away from capital and more into labour inputs. This is explored further in the July 2014 Economic Review published alongside this bulletin.
Figure 11: Year on year growth in net capital stock per employed person
% change in capital per employed person
Source: Office for National Statistics
Download this chart Figure 11: Year on year growth in net capital stock per employed person
Image .csv .xlsCapital stocks per employed person estimates by industry for gross and net stocks are available in the accompanying time series dataset and in publication tables.
Nôl i'r tabl cynnwys13. International comparisons
Broadly speaking, net capital stock has moved in line with the UK’s major counterparts, in terms of both annual growth and capital output shares. This can be seen in figure 12, which plots the UK year on year net capital stock growth rate compared with other members of the G71. The UK has among the highest rates of net capital stock growth across the G7, and is broadly comparable to France. Figure 12 also shows that growth in the net capital stock fell noticeably across all G7 economies during the economic downturn, recovering somewhat in 2010 and 2011 before falling again in 2012 (estimates for 2012 are not currently available for all countries). The latter could have been attributed to renewed economic uncertainty in the euro area.
Figure 12: Year on year net stock growth rate of G7 economies in their own currencies
Percent
Source: Office for National Statistics
Notes:
- Data was not available for all countries in 2012 at the time of this publication
Download this chart Figure 12: Year on year net stock growth rate of G7 economies in their own currencies
Image .csv .xlsFigure 13 presents the Capital Output Ratio compared with the same major economies. It shows that the UK had the second lowest capital output ratio at around 2.5%. This is broadly in line with relevant GFCF estimates; the UK has historically invested a smaller proportion of its GDP compared with the G7 (17% in the UK compared with 21% in both the G7 and the euro area between 1997 and 2012 respectively2). Figure 13 also shows the ratio gradually rising during the pre-downturn decade, before rising a little more strongly in 2009, when the level of net stock continued to grow while the level of GVA fell.
Figure 13: Capital Output Ratio in their Own Currencies
Net Capital Stocks Divided by Gross Value Added (GVA)
Source: Office for National Statistics
Notes:
- Data are not available for Germany for years 1998-2000, US for 1997. Italy, US, and Germany data are not available for 2012
Download this chart Figure 13: Capital Output Ratio in their Own Currencies
Image .csv .xlsNotes for international comparisons
The G7 is a group of seven countries with advanced economies: Canada, France, Germany, Italy, Japan, United Kingdom (UK) and United States (US). All data used are taken from the Organisation for Economic Co-Operation and Development (OECD) or the country’s respective national statistics institute
Source: World Bank