Cynnwys
- Abstract
- Introduction
- Recognising vulnerability in the formal banking system
- MFI sources and uses of funds (excluding derivatives)
- OFI sources and uses of funds (excluding derivatives)
- The use of financial derivatives
- Conclusion and future development of FoF
- Authors and acknowledgements
- Annex: Guide to the statistical classifications of institutional sectors and financial instruments
- References
- Relevant links
1. Abstract
To mark the tenth anniversary of the global financial crisis, we use the experimental UK flow of funds statistics to study the behaviour of the UK financial sector between 1997 and 2015, with a specific focus around the period leading up to the crisis.
We show how these experimental data can provide insights that could have been important during the build-up to the crisis, potentially giving early warning signs of a rise in financial instability. These include the rapid balance sheet expansion of the formal banking sector and the associated depressed retail deposit to asset ratio, its increased interconnectedness with the shadow banking sector and the rest of the world, and the shift in banking business model towards a more vulnerable structure involving trading more derivatives against the rest of the world.
Through this we demonstrate the usefulness of the flow of funds statistics in monitoring financial vulnerability.
Nôl i'r tabl cynnwys2. Introduction
The financial crisis in 2007 to 2008 saw some of the biggest global financial institutions face major financial difficulties and the financial intermediation system fail. As losses associated with the US sub-prime housing market in 2007 became more widespread and surfaced in places that had not been expected, it revealed both the interconnected nature of the UK financial sector and the opaque nature of some modern financial instruments.
One of the many lessons is that the then-existing financial accounts data were insufficient at both local and global levels to accurately measure the risks that were piling up in the balance sheets of the financial sectors in different countries. This issue is particularly relevant for the UK, which is an international financial centre and has by far the highest financial balance sheet to nominal gross domestic product (GDP) ratio in the G7 countries (Nolan and Matthews (2016)). An improved understanding of the interconnectedness of the UK financial sector as well as being able to monitor counterparty information on financial assets and liabilities by instrument at a more disaggregated level is necessary to understand better where financial vulnerabilities may be building.
In recent years, the Barker and Ridgeway Review and Bean Review have identified the need for more detailed and complete flow of funds statistics. To address this gap, Office for National Statistics (ONS) set up an ambitious initiative in partnership with the Bank of England in late 2014 to enhance the coverage and quality of financial accounts statistics for the UK. The centrepiece of this project is to develop granular whom-to-whom, or “flow of funds” (FoF) statistics on the balance sheet positions and inter-sectoral financial flows for a larger number of sectors and instruments. An international comparison of the provision of financial statistics by Nolan and Matthews (2016) points out that successful delivery of this project will make the UK a world leader in this area.
We have published experimental whom-to-whom statistics for financial balance sheet levels between 1997 and 20151. Figure 1 provides a Sankey diagram illustrating the sectors and instruments currently available in the experimental whom-to-whom matrices. It shows in a particular year what instruments the sectors hold their financial liabilities in and to whom they owe those instrument liabilities.
Figure 1: A Sankey diagram showing the interactions between the various sectors
Embed code
Table 1 provides definitions for the main sectors being analysed in this article, namely monetary financial institutions (MFI), other financial institutions (OFI) and rest of the world (RoW). Definitions consistent with the European System of National and Regional Accounts (ESA) 2010 for the full range of sectors and financial instruments from Figure 1 are provided in the Annex.
Table 1: Definitions of monetary financial institutions, other financial institutions and the rest of the world
| Sector | Definition |
|---|---|
| Monetary financial institutions (MFI) | This includes three subsectors: |
| • Central Bank (the Bank of England) | |
| • Deposit-taking corporations (that is retail banks and building societies) | |
| • Money market funds (that is corporations engaged in lending and borrowing using instruments which can be considered as close substitutes for deposits) | |
| Other financial institutions (OFI) | This includes four subsectors: |
| • Non-money market funds (for example hedge funds, private equity funds etc) | |
| • Other financial intermediaries (for example non-bank securities dealers, securitisation special purpose vehicles etc) | |
| • Financial Auxiliaries (for example central clearing parties, brokers, fund managers etc) | |
| • Captive financial institutions and money lenders (for example holding companies) | |
| Rest of the world (RoW) | This includes all institutions or individuals that are not resident in the UK but have economic interactions with resident units. These can be overseas corporations, charities, governments or private individuals, or international organisations, irrespective of their geographical location. |
| Source: Office for National Statistics | |
Download this table Table 1: Definitions of monetary financial institutions, other financial institutions and the rest of the world
.xls (28.7 kB)In this article we explore the usefulness of the experimental flow of funds statistics in understanding the behaviour of the UK financial sectors of MFIs and OFIs, which represent our current best proxy measures for “formal2” and “shadow3” banking respectively, around the time of the financial crisis in 2008. It is important to note that ongoing development at ONS is aiming to produce more granular sectorisation, which will provide more accurate estimates for the formal and shadow banking systems, and for a greater number of instruments than currently available. This is discussed in greater detail in Section 7.
The structure of this article is as follows.
We highlight the aggressive expansion of the formal banking sector’s balance sheet position, excluding financial derivatives4 and the decreasing reliance on retail deposits5 as sources of funding. Hahm et al (2013) shows that this is associated with financial vulnerability.
We dig deeper, using counterparty information in the experimental statistics, into the questions of how the MFI sector, or the formal banking system, sourced funds (liabilities) and used these funds (assets). We observe rising interconnectedness of the MFI sector with the RoW, which increased the likelihood of foreign vulnerabilities transmitting across borders.
We then study the funding and asset purchase of the shadow banking sector, noting that in the run-up to the financial crisis it was becoming more interlinked with the formal banking sector. This would accelerate the spreading of financial difficulties across the whole banking system.
We also look at the rise of the use of financial derivatives. Derivatives are the most versatile but also most complex type of instruments where the network of exposures can become highly convoluted. At the height of the financial crisis, the aggregate derivatives position of the MFI sector was almost equivalent to its balance sheet excluding derivatives due to an increase in interactions with the RoW, reflecting the very high level of stress within the financial system.
We conclude by outlining the ongoing development of the flow of funds statistics that is relevant for understanding and monitoring the UK banking system.
Notes for: Introduction
- The current estimates are consistent with the UK Economic Accounts Quarter 1 (Jan to Mar) 2016, excluding Other accounts receivable/payable. They are subject to revisions as part of the Blue Book 2017 process later this year.
- The formal banking system refers to deposit-taking corporations and their financial activities. They are supervised by the Bank of England under traditional bank regulation. For example, they have depositors whose funds are protected and insured by the Financial Services Compensation Scheme, and they can borrow in an emergency from the Bank of England. The formal banking system is closely, albeit imperfectly, matched to the definition of the monetary financial institutions (MFI) sector. The MFI sector includes the formal banking system and also the Bank of England and money market funds.
- There are different working definitions of the shadow banking system in the literature, and in this article we follow the broad measure proposed by the European Systemic Risk Board, or ESRB (2016). It defines shadow banking as “credit intermediation performed outside the traditional banking system” and proposes a “conservative approximation” by the combined balance sheet positions of the investment fund sectors (including money market and non-money market funds), other financial intermediaries, financial auxiliaries and captive financial institutions. This definition is closely matched to that of the other financial institutions (OFI) sector, apart from the inclusion of money market funds, a sector that is estimated in a separate commission to be of relative insignificance, accounting for between £4 billion to £8 billion in assets in 2016 (the OFI sector is estimated to hold over £4,000 billion overall).
- Even though derivatives are recorded on the balance sheet, analyses of bank funding sources typically do not consider them (for example, see IMF 2013, Beau et al 2014) because they are not used for such purpose. Also, the recording for a forward-type derivative may switch between being an asset or liability over the course of the contract. See Section 6 for a more detailed discussion of derivatives.
- The Bank of England terms this “retail funding” (Beau et al 2014) and defines it as deposits that households and small companies keep with a bank.
3. Recognising vulnerability in the formal banking system
Deposit-taking corporations, such as banks, can draw funding from multiple sources. These include taking deposits, raising money through the wholesale and inter-bank market, issuing debt securities and issuing equity. There are different properties to these sources of funding and there are drawbacks and advantages depending on the circumstances. A full discussion is provided in Beau et al (2014). Out of all sources, retail deposits are regarded as the most stable (Akritidis (2017)) as well as the least costly – they require no collateral and typically incur zero or very low level of interest.
Using the experimental flow of funds statistics, we define the retail deposits to asset ratio of the monetary financial institutions (MFI) sector as households and non-profit institutions serving households (HH plus NPISH) deposits with MFI divided by total MFI assets (excluding derivatives)1. Retail deposits are also referred to as “core liabilities” in the literature (for example, see Hahm et al (2013)) as they are stable and predictable.
During economic growth when credit risks are low, MFIs typically are willing to expand their balance sheets by increasing their risk appetite and purchasing relatively riskier assets. When core liabilities cannot keep up, the banks will explore alternative non-core sources of funding from the capital market, such as those listed previously and from overseas creditors, to finance their expansion. Accordingly, the core liabilities to assets ratio will fall. See Figure 2 from Hahm et al (2013) for a stylised illustration of a lending boom. Expansion of balance sheet through a lowering of the retail deposits to assets ratio will be associated with above-trend growth in credit and compressed risk premiums. There are also increased vulnerabilities to deleveraging by foreign creditors.
Figure 2: An illustration of expansion of monetary financial institutions assets financed by non-core liabilities
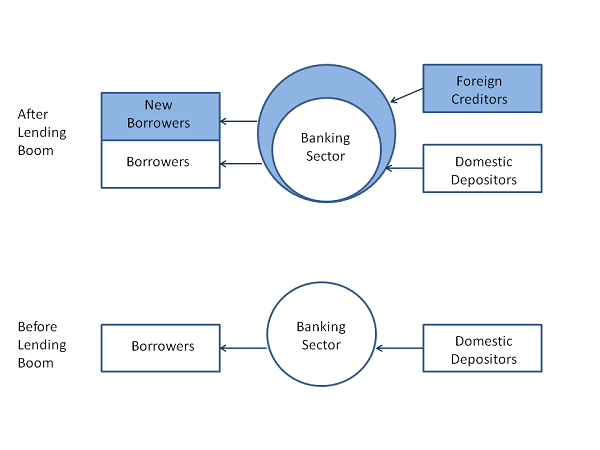
Source: Hahm et al (2013)
Download this image Figure 2: An illustration of expansion of monetary financial institutions assets financed by non-core liabilities
.png (41.5 kB)
Using the experimental flow of funds statistics, Figures 3 and 4 show the retail deposits to MFI assets ratio and its components between 1997 and 2015 for the UK. It is clear the ratio was in decline for over 10 years in the run-up to the height of the financial crisis in Quarter 4 (Oct to Dec) 20082, as MFI assets had always grown faster than retail deposits. This widened after 2004, signalling higher vulnerability. In the post-crisis period, retail deposits continued to grow steadily, confirming them as a stable source of funding, while the MFI sector slowed its expansion of assets and eventually reversed, falling below the pre-crisis position. These contributed to the flattening and then rising of the retail deposits to assets ratio after Quarter 4 2008.
Figure 3: UK retail deposits to monetary financial institutions assets ratio
Quarter 1 (Jan to Mar) 1997 to Quarter 4 (Oct to Dec) 2015
Source: Experimental flow of funds statistics
Download this chart Figure 3: UK retail deposits to monetary financial institutions assets ratio
Image .csv .xls
Figure 4: Growth of households and non-profit institutions serving households deposit and monetary financial institutions asset, indexed to 100 in Quarter 1 (January to March) 1997
UK, Quarter 1 (Jan to Mar) 1997 to Quarter 4 (Oct to Dec) 2015
Source: Experimental flow of funds statistics
Download this chart Figure 4: Growth of households and non-profit institutions serving households deposit and monetary financial institutions asset, indexed to 100 in Quarter 1 (January to March) 1997
Image .csv .xlsNotes for: Recognising vulnerability in the formal banking system
- This is a close but not perfect proxy for retail deposits because of the exclusion of small non-profit institutions serving households (NPISH) businesses. Ongoing development of the flow of funds project is looking at sub-sectorising private non-financial corporations (PNFC) into businesses of different size bands. Such granular data will allow us to capture the retail deposits to assets ratio more accurately.
- September to October 2008 saw a series of high-profile financial institution failures around the world, including the US government bail-out of Fannie Mae and Freddie Mac, the bankruptcy of Lehman Brothers, the UK government bail-out of Royal Bank of Scotland, Lloyds TSB and Halifax Bank of Scotland. For simplicity we use Quarter 4 2008 as the cut-off for describing the financial crisis, though the first sign of the crisis is commonly attributed to the shutdown of two BNP Paribas hedge funds in August 2007.
4. MFI sources and uses of funds (excluding derivatives)
Having recognised heightened vulnerability in the formal banking system in the run-up to the financial crisis, we next exploit the counterparty information in the experimental flow of funds (FoF) statistics more fully to understand the nature of the vulnerability. We consider the monetary financial institutions (MFI) sector’s sources of funds (liabilities) and their uses (assets) around the time of the financial crisis. We exclude derivatives in the analysis, which are discussed separately in Section 6.
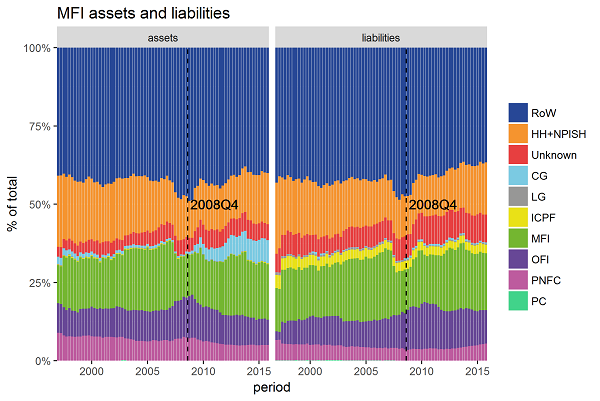
The UK formal banking sector has been using the rest of the world (RoW) as an important source of funds since 1997. Figure 5 shows that the RoW acted as counterparty to about 41 to 43% of MFI liabilities in between 1997 and 2006, the biggest counterparty sector of all. From the second half of 2007, there was a spike in the proportion of overseas funding. It peaked at 49% in Quarter 1 (Jan to Mar) 2008, highlighting how interconnected the UK financial sector was with the RoW.
In terms of the MFI sector’s uses of funds, the pattern largely mirrored that of its sources of funds, with RoW the biggest debtor, averaging over 40%, followed by households and the MFI sector. There was a similar spike with the RoW around 2007 to 2009. The most significant change in the MFI’s uses of funds after the crisis was in the central government sector, which increased to an average level of over 5% post-crisis compared with about 1% prior. However, rather than reflecting a behavioural change of the formal banking system in response to the crisis, this is likely reflecting the impacts of quantitative easing. The MFI sector currently includes the Bank of England, which purchased government bonds through its quantitative easing programme in the post-crisis period1.
Figure 5: Proportion of monetary financial institutions assets and liabilities excluding derivatives, by counterparty sectors
UK, Quarter 1 (Jan to Mar) 1997 to Quarter 4 (Oct to Dec) 2015
Source: Experimental flow of funds statistics
Download this image Figure 5: Proportion of monetary financial institutions assets and liabilities excluding derivatives, by counterparty sectors
.png (79.9 kB) .xls (151.6 kB)
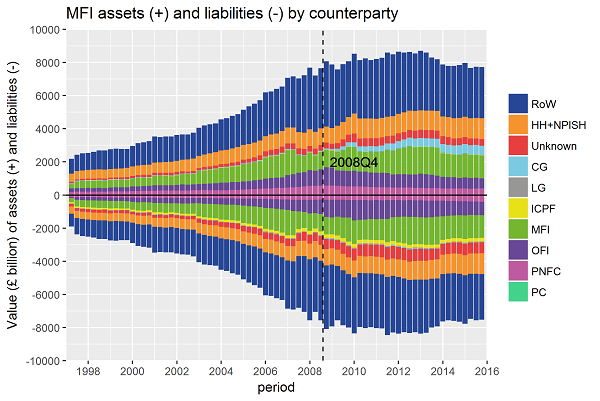
Figure 6 shows the growth of the nominal value of the MFI sector’s balance sheet (excluding derivatives), which increased nearly four-fold between 1997 (£2.2 trillion of assets2) and 2008 (£8.1 trillion). After an initial dip after the crisis between Quarter 4 (Oct to Dec) 2008 and Quarter 2 (Apr to June) 2009, the sector continued to expand but at a slower pace until 2013. After that, it contracted to roughly the pre-crisis level by the end of 2015.
Figure 6: Trends in monetary financial institutions assets (+) and liabilities (-), breakdown by counterparty sectors
UK, Quarter 1 (Jan to Mar) 1997 to Quarter 4 (Oct to Dec) 2015
Source: Experimental flow of funds statistics
Download this image Figure 6: Trends in monetary financial institutions assets (+) and liabilities (-), breakdown by counterparty sectors
.png (111.3 kB) .xls (138.2 kB)
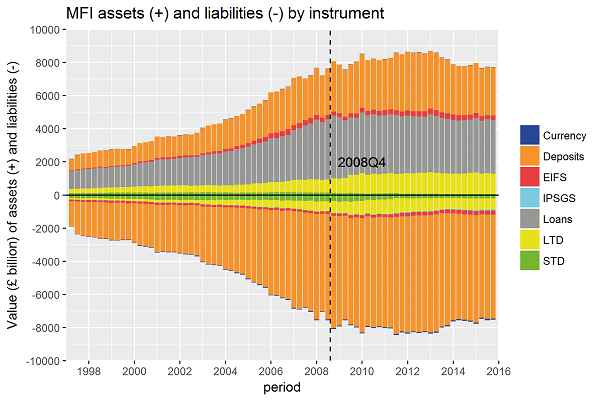
Figure 7 shows that the MFI sector predominantly receives funds through deposits. This includes retail deposits, as well as wholesale deposits from large companies and overseas, and funding from inter-bank lending. Funds received through issuing equity and debt securities are limited, accounting for only 17% of MFI liabilities in Quarter 4 2015. Putting this alongside Figure 4 allows us to conclude that the expansion of the MFI debt position in the run-up to the crisis was more driven by growth in “non-core” liabilities, which would have increased uncertainty and funding costs.
In terms of the uses of funds, the MFI sector purchases mainly loans and deposits, including inter-bank lending, and long-term debt (LTD) to a lesser extent. The composition is largely constant through time, though we notice the importance of loans assets, to which the household sector is the major counterparty, slightly dropped after the financial crisis.
Loans assets of the MFI sector capture both secured (for example, mortgage) and unsecured loans (for example, credit card), so this indicates a reversal in the sector’s pre-crisis lending behaviour, which has often been cited as a contributing factor to the crisis. Interestingly, the importance of long-term debt securities (LTD), which includes mortgage-backed securities (MBS), has not receded after the crisis. The unravelling of the value of MBS due to the sub-prime nature of mortgages packaged within them is often cited as the trigger of the financial crisis, but even if we discount the Bank of England’s quantitative easing programme, which accounts for over £400 billion of MFI LTD assets, we still only observe a minor fall in the sector’s position compared with pre-crisis level. As we will see in Section 6, the effect of this is potentially captured in the derivatives market instead, where heightened uncertainty has led to a surge in activities.
Figure 7: Trends in monetary financial institutions assets (+) and liabilities (-), breakdown by instruments
UK, Quarter 1 (Jan to Mar) 1997 to Quarter 4 (Oct to Dec) 2015
Source: Experimental flow of funds statistics
Download this image Figure 7: Trends in monetary financial institutions assets (+) and liabilities (-), breakdown by instruments
.png (93.9 kB) .xls (101.9 kB)
So far, by excluding derivatives and looking at traditional sources and uses of funds of the MFI (or formal banking) sector, the following patterns are particularly obvious in the run-up to the financial crisis: firstly, the balance sheet had greatly expanded; secondly, the sector was highly interconnected with the RoW and particularly so between 2007 and 2008.
On the first point, we already discussed in Section 3 that vulnerabilities are associated with an over-expansion of the balance sheet with respect to the growth of retail deposits. On the second point, greater financial interconnectedness with the RoW can bring benefits and costs. Borrowing the argument from Liu, Roth and Quiet (2015), greater access to the RoW allows domestic sectors to access funds and transfer risks more easily, but overseas stresses also tend to spread more rapidly and extensively across the financial system.
For example, a liquidity issue in foreign financial systems may be transmitted across-border, resulting in a reduction in the domestic provision of financial services, affecting lending to households or businesses that produce non-financial goods and services in the economy. This is anecdotally supported in the experimental statistics by the reduction in MFI loans assets after the crisis, especially towards the private non-financial corporations sector. Hahm et al (2013) indeed find that the most consistently reliable indicator of vulnerability of both a currency crisis and a credit crisis is a high level of bank liabilities in the RoW, which was present in the UK formal banking system between 2007 and 2008.
Notes for: MFI sources and uses of funds (excluding derivatives)
- Latest Bank of England data show that their current outstanding stock of holdings from government bonds purchase as part of the programme stands at nearly £430 billion.
- The sectoral aggregates in this article, whether presented as numbers or in graphs, are calculated by summing across instruments. There are very minor discrepancies, especially in the earlier years, with the reported simple totals presented as part of the experimental statistics.
5. OFI sources and uses of funds (excluding derivatives)
We now turn our attention to the shadow banking sector. The discussion of balance sheet position in this section continues to exclude derivatives.
Shadow banking covers all financial intermediaries that do not take deposits and do not have a banking licence. Nonetheless the sector performs bank-like activities in channelling funds from lenders to borrowers. It is typically highly interconnected with the formal banking sector and as such can become a source of systemic risk both directly and indirectly (Financial Stability Board (2017)). In this section we use the experimental flow of funds statistics to understand its interconnectedness with the formal sector and its behaviour before and after the financial crisis.
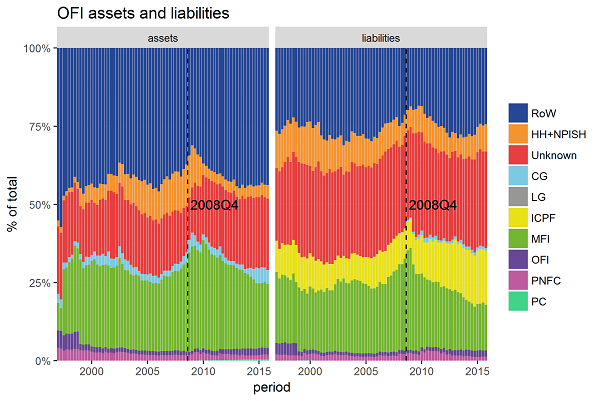
First, we look at the proportion of other financial institutions (OFI) assets and liabilities, excluding derivatives, by counterparty sectors in Figure 8. The rest of the world (RoW) and the monetary financial institutions (MFI) sectors clearly play an important role, with the RoW especially so in OFI assets.
However, the current iteration of the experimental statistics contains a considerable amount of missing information with regards to the counterparty to OFI – about 20% of OFI assets and 30% of liabilities are without known counterpart. Ongoing development in the flow of funds (FoF) project is addressing this issue and we will report as soon as progress is made.
Notwithstanding this, we observe from the data a spike in the OFI sector’s interconnectedness with the MFI sector around the time of the financial crisis. We see that in Quarter 3 (July to Sept) 2005 there was 21% of the OFI sector’s funding sourced from the MFI sector but the figure increased sharply to 33% by Quarter 1 (Jan to Mar) 2009, before dropping quickly and eventually settling around levels of 15% in the latest available data. The story on the side of OFI assets against the MFI sector is very similar.
Figure 8: Proportion of other financial institutions assets and liabilities excluding derivatives, by counterparty sectors
UK, Quarter 1 (Jan to Mar) 1997 to Quarter 4 (Oct to Dec) 2015
Source: Experimental flow of funds statistics
Download this image Figure 8: Proportion of other financial institutions assets and liabilities excluding derivatives, by counterparty sectors
.png (79.2 kB) .xls (151.0 kB)
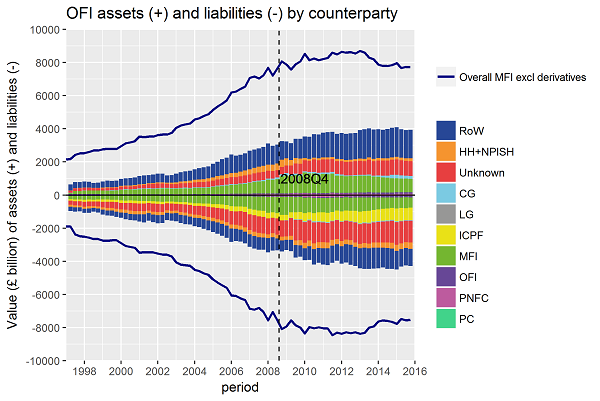
In terms of the nominal value of the balance sheet, Figure 9 shows that the shadow banking system is smaller than the formal banking system, but its relative importance has grown since the financial crisis. In Quarter 1 1997, OFI liabilities stood at £0.9 trillion, or 48% of the size of MFI liabilities (£1.9 trillion). At the height of the financial crisis in Quarter 4 (Oct to Dec) 2008, OFI liabilities were valued at £3.4 trillion. The expansion over 1997 levels was nearly 380% but it was not as high as the growth rate of the MFI sector and its size relative to MFI liabilities dropped to 42%. After the crisis, the growth of the formal banking system stalled but shadow banking continued to increase in activitiy. By the end of 2015, OFI liabilities reached £4.3 trillion and this was over 57% of the size of MFI liabilities.
Figure 9: Trends in other financial institutions assets (+) and liabilities (-), breakdown by counterparty sectors
UK, Quarter 1 (Jan to Mar) 1997 to Quarter 4 (Oct to Dec) 2015
Source: Experimental flow of funds statistics
Download this image Figure 9: Trends in other financial institutions assets (+) and liabilities (-), breakdown by counterparty sectors
.png (106.2 kB) .xls (160.3 kB)
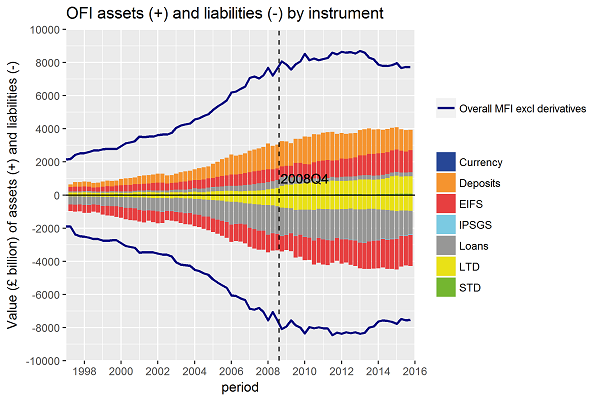
Figure 10 shows the structure of the OFI sector’s balance sheet. We can see that the shadow banking system is by and large funded (liabilities) by loans, equity and long-term debt securities. As for uses of funds (assets), it mainly purchases assets in the form of deposits, equity and long-term debt securities.
Figure 10: Trends in other financial institutions assets (+) and liabilities (-), breakdown by instruments
UK, Quarter 1 (Jan to Mar) 1997 to Quarter 4 (Oct to Dec) 2015
Source: Experimental flow of funds statistics
Download this image Figure 10: Trends in other financial institutions assets (+) and liabilities (-), breakdown by instruments
.png (93.7 kB) .xls (116.7 kB)
Overall, we see that the OFI sector was particularly interconnected with the MFI sector in the run-up to the financial crisis, which may have increased the likelihood of financial vulnerabilities spreading across the banking system and aggravated the financial crisis. Also the OFI sector continued to grow after the crisis while the MFI sector remained flat, suggesting a potential shift in the source and the type of financial vulnerabilities present in the overall financial system.
Nôl i'r tabl cynnwys6. The use of financial derivatives
The analysis so far has highlighted the symptoms of increased financial vulnerabilities, such as a lowering of the retail deposit to asset ratio and increased interconnectedness of the monetary financial institutions (MFI) sector with the rest of the world (RoW) and other financial institutions (OFI) sectors.Further considering the market for financial derivatives may offer extra insights. The reason is summarised in a report by the Organisation for Economic Co-operation and Development (OECD) in 2013, which states that “the banking model has evolved over time, becoming increasingly dominated by wholesale markets and in particular derivatives, to the detriment of the more traditional deposit-taking and lending activities”. In this section, we complete the analysis of the UK banking system by studying the MFI and OFI sectors’ derivatives activities, using the experimental flow of funds (FoF) statistics.
Derivatives are financial assets based on, or derived from a different underlying instrument such as another financial asset, a commodity or an index. Since the hedging or offsetting of risk is frequently a motivation for their creation, they can be referred to as hedging instruments. Their recording in the national accounts as assets or liabilities are determined by their properties – see Valdivia-Velarde (2010) for a fuller discussion. A summary is provided in Table 2.
A forward-type contract is an unconditional contract by which two parties agree to exchange a specified quantity of an underlying item at an agreed price on a specified date. Examples include futures or currency swaps. As the value of the contract is over-and-above the value of the underlying asset, the contract has zero value at inception and typically requires no up-front payment. Depending on the fluctuation in price over the course of the contract, a forward-type derivative may switch between being an asset (favourable price fluctuation) or a liability (unfavourable) to the same party. On the other hand, an option, whereby the purchaser acquires from the seller the right to buy or sell a specified item at a specific price on or before a specified date in exchange for a down payment, is always recorded as a liability to the seller. This is because the down payment creates a value for the contract from its inception. Credit default swaps (CDS), which are insurance-like contracts that allow investors to hedge against default risks in exchange for premiums, also fall into this category.
Table 2: Summary of differences between the recording of forward-type derivative contracts and options in the national accounts
| Forward-type contract | Options |
|---|---|
| • No up-front payment (premium) | • Up-front payment (premium) |
| • Contract has zero value at inception | • Contract has value at inception |
| • Obligations for transaction at maturity | • Exercise at discretion of the buyer |
| • During life of the contract, either party can be creditor/debtor (and it may change) | • The buy is always the creditor, and the seller is always the debtor |
| • Forwards can switch between assets and liabilities for both counterparties | • Along the contract, only asset for one counterparty and liability for the other |
| Source: Valdivia-Velarde (2010) | |
Download this table Table 2: Summary of differences between the recording of forward-type derivative contracts and options in the national accounts
.xls (27.1 kB)We show in Figures 11 and 12 the trends in derivatives activities of the MFI and OFI sectors respectively. The beginning of the analysis period here is 2004, instead of 1997 in previous sections, because prior to that recording of derivatives was poor1.
In the MFI sector, the amount of derivatives activities rose sharply in the run-up to the crisis. At the beginning of 2004, MFI derivatives assets were valued at £1 trillion, or 22% against an overall MFI assets position excluding derivatives of £4.6 trillion. By the beginning of 2008, the percentage was over 50% and at the height of the crisis in Quarter 4 (Oct to Dec) 2008, the value of MFI derivatives contracts reached £7.5 trillion, nearly level with the MFI balance sheet excluding derivatives. It then fell sharply and by the end of 2015 returned to a level of £2.9 trillion. We see that much of the spike in Quarter 4 2008 was driven by contracts against the RoW. This may be reflecting uncertainty in other asset markets such as exchange rates and credit risks, which led to banks taking up new derivatives positions to hedge against heightened risks.
Figure 11: Trends in monetary financial institutions derivatives assets (+) and liabilities (-), breakdown by counterparty
UK, Quarter 1 (Jan to Mar) 2004 to Quarter 4 (Oct to Dec) 2015

Source: Experimental flow of funds statistics
Download this image Figure 11: Trends in monetary financial institutions derivatives assets (+) and liabilities (-), breakdown by counterparty
.png (90.0 kB) .xls (120.3 kB)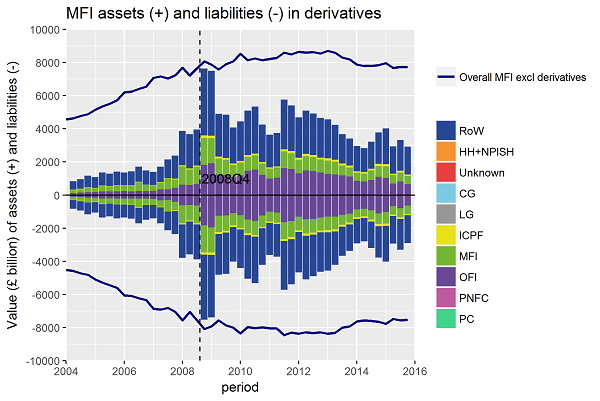
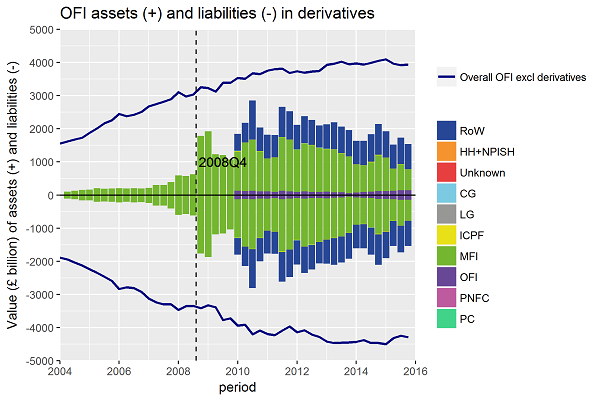
Turning to the OFI sector, the use of financial derivatives in the run-up to the crisis was less prominent than in the MFI sector both in terms of the absolute value and the relative proportion to total activities excluding derivatives. The OFI sector before 2010 was trading derivatives primarily with the MFI sector only. After the crisis, following an initial contraction the amount of OFI derivatives activities as measured by value actually grew beyond the financial crisis peak to £2.8 trillion in Quarter 3 (July to Sept) 2010 due to increased trading with the RoW. In the most recent data it fell to £1.5 trillion but remained comparable with the level seen during the crisis. This is in contrast to the MFI sector’s use of derivatives shown in Figure 9, which shrank over 60% from its financial crisis peak by the end of 2015.
Figure 12: Trends in other financial institutions derivatives assets (+) and liabilities (-), breakdown by counterparty
UK, Quarter 1 (Jan to Mar) 2004 to Quarter 4 (Oct to Dec) 2015
Source: Experimental flow of funds statistics
Download this image Figure 12: Trends in other financial institutions derivatives assets (+) and liabilities (-), breakdown by counterparty
.png (82.0 kB) .xls (120.3 kB)
As noted by the OECD (2013), the banking model has indeed evolved and the sharp rise in the use of financial derivatives and in particular against the RoW in the run-up to mid-2009 is a defining feature of the 2008 financial crisis from the viewpoint of the experimental FoF statistics.
Hull (2012) states that “derivatives are very versatile instruments. It is this very versatility that can cause problems. Sometimes traders who have a mandate to hedge risks or follow an arbitrage strategy become (consciously or unconsciously) speculators. The results can be disastrous.” Li and Marinc (2014) find that financial derivatives are positively and significantly related to systematic risk exposures. Similarly, the OECD (2013) report finds that the use of derivatives in banks’ risk-weighting process creates ineffectiveness and distortions that meant leverage was not effectively restrained. Indeed, the House of Commons Treasury committee report (2009) on the banking crisis states that the explosion in size of the UK’s financial sector was due to new financial instruments being created to satisfy the search for yield, but as a side effect risk was heightened, defeating the purpose of derivatives.
Lehman Brothers and AIG in 2008 were prime examples of firms that in search for yield oversold credit default swaps, an insurance-like derivative contract that investors use to hedge against the risk of the firms they invest in default. They can act as a cheap source of funding for credit default swaps (CDS) sellers, particularly in a buoyant economic environment where default risks are low. However, as the business environment started to turn after the US sub-prime mortgage crisis surfaced, the CDS sellers became vulnerable and struggled to meet their obligations as more firms started to default. This exacerbated the credit crisis.
Derivatives contracts also typically heighten counterparty risks, that is, the impact of counterparties being unable to meet their obligations. Bespoke bilateral derivative contracts (or “over-the-counter” (OTC) contracts) are typically not centrally cleared and they make up by far the largest share of financial derivatives market – 86% in December 2016 according to the Bank for International Settlements.
When OTC contracts are traded they involve the risk that a counterparty fails to meet its obligations or fulfil margin calls. This can lead to a loss on the other side of the contract and if it is severe enough it can cause liquidity and financial distress which in turn can have knock-on effects for their creditors. In fact, the spike in market value of derivatives in 2008 as seen in Figures 11 and 12 was associated with margin and collateral calls that pushed many financial institutions towards the default point. The interbank market became dysfunctional as trust broke down and illiquidity mechanisms impaired lending and this issue was particularly marked in the UK where bank business models had changed heavily in the direction of innovative products such as derivatives (OECD, 2013).
The OECD (2013) concludes that as the business models of financial institutions shifted towards more vulnerable structures involving derivatives during the run-up to the crisis, this created a sharp rise in leverage and counterparty risk, which in turn led to deleveraging, increased economic uncertainty and an increase in the cost of capital. The FoF statistics with their granular data on counterparty information and risk type will allow analyses that monitor the build-up of such risks in the future.
Notes for: The use of financial derivatives
- This was subsequently addressed by the G20 leaders after the financial crisis through the implementation of, for example, the Dodd-Frank Act in the US and the European Market Infrastructure Regulation in the EU.
7. Conclusion and future development of FoF
In this article we have used the experimental flow of funds (FoF) statistics to study the behaviour of the formal and shadow banking system before and after the 2008 financial crisis. We have shown that the data has potential to support traditional analyses of financial vulnerability that have been proposed in the literature and are of great value in monitoring risks associated with interconnection, counterparty and instrument choice in the financial system. The data can also support analysis of the derivatives market, which is evolving into an important part of the modern banking business model. Such a tool if available at the time would have highlighted the main issues in the run-up to the last financial crisis:
- the rapid balance sheet expansion of the monetary financial institutions (MFI) (or formal banking) sector and the associated depressed retail deposit to MFI asset ratio
- the increased interconnectedness of the MFI sector with the rest of the world (RoW) and other financial institutions (OFI) (or shadow banking) sectors
- the shift in banking business model towards a more vulnerable structure involving trading more derivatives against the RoW
Ongoing work in the ambitious enhanced financial accounts (EFA) initiative is looking at producing granular flow of funds (FoF) statistics for more subsectors and for a more detailed breakdown of financial instruments. This will provide policymakers with a more complete picture of the economy and the financial system should similar events arise in the future.
Our preferred approach in achieving this is to use non-survey record level data such as administrative, regulatory and commercial data sources. Such data allow greater flexibility over surveys in responding to evolving user requirements for granularity. Where necessary, survey data will continue to be used to fill any gaps. The EFA initiative is studying a wide range of data sources to achieve its ambition and as progress is made, experimental statistics will be released at the earliest opportunity on an incremental basis before full implementation into the national accounts. This will give users early sights of development and an opportunity to offer feedback.
We list the areas of relevant further improvement that we are aiming to make with regards to informing analysis surrounding the banking system. These improvements will help with the level of analysis that can be carried out to understand better how financial vulnerabilities may build up:
- subsectorising the MFI sector into central bank, other depository corporations and money market fund
- subsectorising the OFI sector into different types of funds, for example, exchange traded fund, hedge fund, private equity fund and other financial intermediaries, for example, security and derivative dealers, consumer credit lender, financial vehicle corporations, financial auxiliaries
- subsectorising RoW into regions and countries
- breaking down debt securities by maturity
- breaking down loans by maturity and by types, for example, mortgage, finance leasing, credit card
- breaking down equity by listed and unlisted companies, and the currency of denomination
- breaking down financial derivatives by over-the-counter versus exchange trade, by contract type, for example, swaps, options, forwards and by underlying instrument, for example, commodities, interest rates, exchange rates, credit
We are interested in your feedback on the experimental analysis as well as future development of FoF. Please send any comments to flowoffundsdevelopment@ons.gov.uk.
Nôl i'r tabl cynnwysManylion cyswllt ar gyfer y Erthygl
Related publications
- Economic Statistics Transformation Programme: enhanced financial accounts (UK flow of funds) improving the measurement of company quarterly profit
- Economic Statistics Transformation Programme: enhanced financial accounts (UK flow of funds) progress on financial derivatives data
- Economic Statistics Transformation Programme: Enhanced financial accounts (UK flow of funds) plans for commercial data use
- Economic Statistics Transformation Programme: enhanced financial accounts (UK flow of funds) - improving the economic sector breakdown
- Economic Statistics Transformation Programme: Enhanced financial accounts (UK flow of funds) employee stock options
- Economic Statistics Transformation Programme: Enhanced financial accounts (UK flow of funds) Government tables for the special data dissemination standards plus (SDDS Plus)
- Economic Statistics Transformation Programme: UK flow of funds experimental balance sheet statistics, 1997 to 2015
- Economic Statistics Transformation Programme: Flow of funds - the international context
- Economic Statistics Transformation Programme: the UK flow of funds project: identifying sectoral interconnectedness in the UK economy
- Economic Statistics Transformation Programme: The UK Flow of Funds Project: Improvements to the Sector and Financial Accounts
- Economic Statistics Transformation Programme: Historical estimates of financial accounts and balance sheets
- Economic Statistics Transformation Programme: The UK Flow of Funds Project - comprehensive review of the UK financial accounts
- Economic Statistics Transformation Programme: The UK Flow of Funds Project: introduction, progress and future work
Efallai y bydd hefyd gennych ddiddordeb yn:
- Flow of Funds archived background information
- The UK Enhanced Financial Accounts: changes to defined contribution pension fund estimates in the national accounts; part 2 – the data
- The UK Enhanced Financial Accounts: changes to defined contribution pension fund estimates in the national accounts; part 1 – the methodology