Cynnwys
- Main points
- Things you need to know about this release
- Producer prices inflation summary
- Annual rate of inflation for materials and fuels falls 10 percentage points in the first 6 months of 2017
- Annual rate of inflation for goods leaving the factory gate slowed for the second time this year in June
- Core inflation is now the main driver of annual inflation for goods leaving the factory gate
- Improvements to the Import and Export Price Indices (IPI and EPI) and Services Producer Price Indices (SPPI): June 2017
- Links to related statistics
- Quality and methodology
1. Main points
The annual rate of inflation for goods leaving the factory gate slowed for the second time this year in June and follows a steep decline in input price inflation since January 2017.
Factory gate prices (output prices) rose 3.3% on the year to June 2017 from 3.6% in May 2017, which is the slowest rate prices have increased since December 2016.
Input prices rose 9.9% on the year to June 2017 from 12.1% in May 2017, meaning the annual rate has fallen 10 percentage points since January 2017.
Inputs of crude oil is the main driver of the recent slowing of input price inflation as annual price growth for crude oil fell from 88.9% in February 2017 to 9.1% in June 2017.
Core output inflation rose 2.9% on the year to June 2017 from 2.8% in May 2017 and is now the largest contributor to the annual rate of inflation for goods leaving the factory gate.
2. Things you need to know about this release
The factory gate price (output price) is the amount received by UK producers for the goods that they sell to the domestic market. It includes the margin that businesses make on goods, in addition to costs such as labour, raw materials and energy, as well as interest on loans, site or building maintenance, or rent.
The input price measures the price of materials and fuels bought by UK manufacturers for processing. It includes materials and fuels that are both imported or sourced within the domestic market. It is also not limited to materials used in the final product, but includes what is required by businesses in their normal day-to-day running, such as fuels.
Index numbers shown in the main text of this bulletin are on a net sector basis. The index for any industry relates only to transactions between that industry and other industries; sales and purchases within industries are excluded.
Indices relate to average prices for a month. The full effect of a price change occurring part way through any month will only be reflected in the following month’s index.
All index numbers exclude VAT. Excise duty (on cigarettes, manufactured tobacco, alcoholic liquor and petroleum products) is included, except where labelled otherwise.
Each Producer Price Index (PPI) has two unique identifiers: a 10-digit index number, which relates to the Standard Industrial Classification code appropriate to the index and a 4-character alpha-numeric code, which can be used to find series when using the time series dataset for PPI.
Every 5 years, producer price indices are rebased and weights updated to reflect industry changes.
Figures for the latest 2 months are provisional and the latest 5 months are subject to revisions in light of (a) late and revised respondent data and (b) for the seasonally adjusted series, revisions to seasonal adjustment factors are re-estimated every month. A routine seasonal adjustment review is normally conducted in the autumn each year.
Nôl i'r tabl cynnwys3. Producer prices inflation summary
Figure 1 shows input and output Producer Prices Indices (PPI) across the past 15 years. Looking at the trend across the period it can be seen that the two indices behave differently. Input PPI is mostly driven by commodity prices, which tend to be more volatile over time compared to prices for finished goods. Input PPI is also sensitive to exchange rate movements as roughly two thirds of inputs into the UK manufacturing sector are imported, which is reflected in the weight of imported materials and fuels in the index.
Figure 1: Input and output PPI June 2002 to June 2017, UK
Source: Office for National Statistics
Download this chart Figure 1: Input and output PPI June 2002 to June 2017, UK
Image .csv .xlsBetween June 2002 and June 2017, input prices increased 72%, mainly driven by crude oil prices that rose 128% over the period. Output prices increased 31% across the same period.
Comparing prices today with those prior to the downturn peak in June 2008, input prices were 1.0% lower in June 2017, while output prices were up 12.4% across the period.
Nôl i'r tabl cynnwys4. Annual rate of inflation for materials and fuels falls 10 percentage points in the first 6 months of 2017
Table 1: Input prices, index values, growth rates and percentage point change to the 12-month rate: June 2016 to June 2017
| UK | ||||
| All materials and fuels purchased (K646) | ||||
| Change in the | ||||
| PPI Index | 1-month | 12-month | 12-month rate | |
| (2010=100) | rate | rate | (percentage points) | |
| 2016 Jun | 96.4 | 1.7 | -0.5 | 3.8 |
| Jul | 99.5 | 3.2 | 4.2 | 4.7 |
| Aug | 99.8 | 0.3 | 7.8 | 3.6 |
| Sep | 100.2 | 0.4 | 7.6 | -0.2 |
| Oct | 104.6 | 4.4 | 12.4 | 4.8 |
| Nov | 104.0 | -0.6 | 13.5 | 1.1 |
| Dec | 106.5 | 2.4 | 16.6 | 3.1 |
| 2017 Jan | 108.0 | 1.4 | 19.9 | 3.3 |
| Feb | 108.0 | 0.0 | 19.3 | -0.6 |
| Mar | 107.4 | -0.6 | 16.7 | -2.6 |
| Apr | 107.0 | -0.4 | 15.4 | -1.3 |
| May | 106.3 | -0.7 | 12.1 | -3.3 |
| Jun | 105.9 | -0.4 | 9.9 | -2.2 |
| Source: Office for National Statistics | ||||
| Notes: | ||||
| 1. Series are not seasonally adjusted. | ||||
Download this table Table 1: Input prices, index values, growth rates and percentage point change to the 12-month rate: June 2016 to June 2017
.xls (20.5 kB)Since the start of 2017, input prices have mostly declined. In June 2017 the annual rate of growth was 10 percentage points lower than it was in January 2017. June’s annual rate of 9.9% is the slowest the rate has grown since September 2016 when it was 7.6%.
In terms of month-on-month growth, the rate has fallen in the four most recent months to June 2017. The last time the index fell for this number of consecutive periods was from May to August 2015. The monthly growth rate was up an average of 1.7% during the second half of 2016, whereas during the first 6 months of 2017 the rate was down 0.1% on average. The main driver of the recent declines has been falling prices for inputs of crude oil into the manufacturing sector. According to the World Bank, the overall average global price for crude oil fell from $54.4 per barrel in February 2017 to $46.2 in June 2017, a decline of 15% over the period.
Table 2: Imported materials and fuels purchased and sterling effective exchange rate, index values, growth rates and percentage point change to the 12-month rate: June 2016 to June 2017
| UK | ||||||
| Imported materials and fuels purchased (K64F) | Sterling effective exchange rate - month average | |||||
| Change in the | ||||||
| PPI Index | 1-month | 12-month | 12-month rate | 1-month | 12-month | |
| (2010=100) | rate | rate | (percentage points) | rate | rate | |
| 2016 Jun | 94.7 | 1.9 | 0.6 | 3.3 | -2.0 | -7.8 |
| Jul | 98.5 | 4.0 | 6.0 | 5.4 | -6.5 | -14.9 |
| Aug | 98.8 | 0.3 | 9.2 | 3.2 | -1.3 | -16.2 |
| Sep | 99.0 | 0.2 | 8.9 | -0.3 | 0.4 | -14.3 |
| Oct | 103.5 | 4.5 | 14.0 | 5.1 | -5.1 | -18.4 |
| Nov | 101.9 | -1.5 | 14.6 | 0.6 | 2.7 | -17.9 |
| Dec | 103.7 | 1.8 | 17.4 | 2.8 | 2.1 | -14.5 |
| 2017 Jan | 106.0 | 2.2 | 20.2 | 2.8 | -1.6 | -13.0 |
| Feb | 105.5 | -0.5 | 19.2 | -1.0 | 0.8 | -10.4 |
| Mar | 105.9 | 0.4 | 16.8 | -2.4 | -1.3 | -10.7 |
| Apr | 105.2 | -0.7 | 14.5 | -2.3 | 2.2 | -7.8 |
| May | 104.3 | -0.9 | 12.3 | -2.2 | 0.5 | -9.2 |
| Jun | 104.1 | -0.2 | 9.9 | -2.4 | -2.0 | -9.2 |
| Source: Office for National Statistics | ||||||
| The sterling effective exchange rate source: Bank of England | ||||||
| Notes: | ||||||
| 1. Series are not seasonally adjusted. | ||||||
| 2. The sterling effective change rate measures the changes in the strength of sterling relative to a basket of other currencies | ||||||
| 3. The sterling effective exchange rate is only indicative of the rates applied to producer prices. This is because the sterling effective exchange rate is a trade weighted index that represents all UK trade, whereas producer prices reflect transactions in the production sector. | ||||||
Download this table Table 2: Imported materials and fuels purchased and sterling effective exchange rate, index values, growth rates and percentage point change to the 12-month rate: June 2016 to June 2017
.xls (29.7 kB)The annual rate of inflation for imported materials and fuels was 9.9%, the same as the rate for overall input prices in June 2017. The annual rate for imported materials and fuels grew at a faster rate than overall input prices for the whole of 2016. In the first 6 months of 2017 the rate has only exceeded growth for overall input prices on three occasions.
Since October 2016, the sterling effective annual rate has appreciated from a decline of 18.4% in October 2016 to a decline of 9.2% in June 2017. All else equal, a stronger sterling effective exchange will lead to cheaper inputs of imported materials and fuels.
Table 3: Input prices, growth rates: June 2017
| UK | ||
| Product group | Percentage change | |
| 1-month | 12-month | |
| rate | rate | |
| Fuel including Climate Change Levy | -1.6 | 6.6 |
| Crude oil | -4.6 | 9.1 |
| Home food materials | 0.2 | 14.2 |
| Imported food materials | -1.8 | 6.3 |
| Other home-produced materials | -0.1 | 2.0 |
| Imported metals | 0.1 | 23.5 |
| Imported chemicals | 1.0 | 9.8 |
| Imported parts and equipment | 1.7 | 7.5 |
| Other imported materials | 1.2 | 9.2 |
| All manufacturing | -0.4 | 9.9 |
| Source: Office for National Statistics | ||
Download this table Table 3: Input prices, growth rates: June 2017
.xls (25.1 kB)Figure 2 shows contributions by industry to the monthly and annual rate of input price inflation. The largest upward contribution to the annual rate in June 2017 came from home food materials, which contributed 2.03 percentage points. Prices grew 14.2% over the year (Table 3). Within home food materials the largest upward effect came from crop and animal production, where prices rose 13.9% on the year to June 2017.
Imported metals and imported parts and equipment provided the second and third largest contributions to the annual rate, contributing 1.66 and 1.43 percentage points respectively.
The largest upward contribution to the monthly rate came from imported parts and equipment, which contributed 0.34 percentage points. Prices rose 1.7% between May and June 2017 (Table 3). The main contributor to the rise was imported products used in the manufacture of motor vehicles, trailers and semi-trailers.
Figure 2: Input PPI, contribution to 1-month and 12-month growth rate, June 2017, UK
Source: Office for National Statistics
Download this chart Figure 2: Input PPI, contribution to 1-month and 12-month growth rate, June 2017, UK
Image .csv .xlsFigure 3 shows percentage point contributions to change in the annual rate of growth for input prices. The overall rate fell 2.2 percentage points between May and June 2017 and was driven mainly by a decline in prices for crude oil. The annual rate for crude has fallen from 88.9% in February 2017 to 9.1% in June 2017.
The second and third largest contributions to change came from imported food materials and fuel, which were both downward contributions of 0.54 and 0.22 percentage points respectively.
Figure 3: Input PPI, 12-months contribution to change in the annual rate, June 2017, UK
Source: Office for National Statistics
Download this chart Figure 3: Input PPI, 12-months contribution to change in the annual rate, June 2017, UK
Image .csv .xls5. Annual rate of inflation for goods leaving the factory gate slowed for the second time this year in June
Table 4: Output prices, index values, growth rates and percentage point change to the 12-month rate: June 2016 to June 2017
| UK | ||||
| All manufactured products (JVZ7) | ||||
| Change in the | ||||
| PPI Index | 1-month | 12-month | 12-month rate | |
| (2010=100) | rate | rate | (percentage points) | |
| 2016 Jun | 106.9 | 0.3 | -0.2 | 0.3 |
| Jul | 107.1 | 0.2 | 0.2 | 0.4 |
| Aug | 107.3 | 0.2 | 0.8 | 0.6 |
| Sep | 107.6 | 0.3 | 1.2 | 0.4 |
| Oct | 108.3 | 0.7 | 2.1 | 0.9 |
| Nov | 108.4 | 0.1 | 2.4 | 0.3 |
| Dec | 108.7 | 0.3 | 2.9 | 0.5 |
| 2017 Jan | 109.3 | 0.6 | 3.6 | 0.7 |
| Feb | 109.5 | 0.2 | 3.7 | 0.1 |
| Mar | 110.0 | 0.5 | 3.7 | 0.0 |
| Apr | 110.3 | 0.3 | 3.6 | -0.1 |
| May | 110.4 | 0.1 | 3.6 | 0.0 |
| Jun | 110.4 | 0.0 | 3.3 | -0.3 |
| Source: Office for National Statistics | ||||
| Notes: | ||||
| 1. Series is not seasonally adjusted | ||||
Download this table Table 4: Output prices, index values, growth rates and percentage point change to the 12-month rate: June 2016 to June 2017
.xls (28.7 kB)The annual rate of inflation for goods leaving the factory gate has slowed in recent months, from 3.7% in February and March 2017 to 3.3% in June 2017. June 2017 was also the first time in 17 months that the monthly rate has not grown.
For further analysis of what is driving inflation at the factory gate please see section 6 of this bulletin.
Table 5: Output prices growth rates: June 2017
| UK | ||
| Product group | Percentage Change | |
| 1-month | 12-month | |
| rate | rate | |
| Food products | -0.1 | 5.8 |
| Tobacco and alcohol (incl. duty) | 0.0 | 3.2 |
| Clothing, textile and leather | 0.0 | 1.6 |
| Paper and printing | 0.2 | 1.2 |
| Petroleum products (incl. duty) | -1.4 | 4.4 |
| Chemical and pharmaceutical | 0.0 | 4.5 |
| Metal, machinery and equipment | 0.1 | 4.0 |
| Computer, electrical and optical | 0.3 | 3.3 |
| Transport equipment | 0.4 | 3.7 |
| Other manufactured products | 0.2 | 0.8 |
| All manufacturing | 0.0 | 3.3 |
| Source: Office for National Statistics | ||
Download this table Table 5: Output prices growth rates: June 2017
.xls (25.1 kB)Figure 4 shows contributions by industry to the monthly and annual rate of factory gate price inflation. All industries showed upward contributions to the annual rate. Food products provided the largest upward contribution to the rate, contributing 0.88 percentage points. Prices for food products rose 5.8% on the year to June 2017 (Table 5), which was the highest annual increase since December 2011. Annual growth has mainly been driven by dairy products, with prices up 17.6% on the year to June 2017. For further analysis on food prices please refer to section 6 of the May release and section 4 of the January release.
Transport equipment and computer, electrical and optical showed the second and third largest contributions, with 0.45 and 0.39 percentage points respectively. Prices within transport equipment grew 3.7% on the year to June 2017 (Table 5), which was the highest annual increase since April 2009. Transport equipment also gave the largest upward contribution to the monthly growth rate. For further analysis on prices and turnover for the manufacture of motor vehicles, trailers and semi-trailers, which is an important component of transport equipment, please see section 4 of the March 2017 bulletin.
Despite annual growth remaining strong, we witnessed the first month-on-month drop in prices for food products for 12 months, as prices fell 0.1% between May and June 2017 (Table 5). Petroleum products provided the only other downward effect to monthly growth in output prices; between May and June 2017 prices fell 1.4% (Table 5). This was the fourth consecutive month of negative growth. Annual price growth for petroleum products slowed to 4.4% in June 2017, from 9.5% in May 2017, its lowest level since September 2016.
Figure 4: Output PPI, contribution to 1-month and 12-month growth rate, June 2017, UK
Source: Office for National Statistics
Download this chart Figure 4: Output PPI, contribution to 1-month and 12-month growth rate, June 2017, UK
Image .csv .xlsFigure 5 shows contributions to change in the annual rate of growth for factory gate prices. The overall rate fell 0.3 percentage points between May and June 2017 and was mainly driven by a fall in prices for petroleum products. Clothing, textile and leather provided the largest upward contribution to the change in the rate; prices grew 1.6% on the year to June.
Figure 5: Output PPI, 12-months contribution to change in the annual rate, June 2017, UK
Source: Office for National Statistics
Download this chart Figure 5: Output PPI, 12-months contribution to change in the annual rate, June 2017, UK
Image .csv .xls6. Core inflation is now the main driver of annual inflation for goods leaving the factory gate
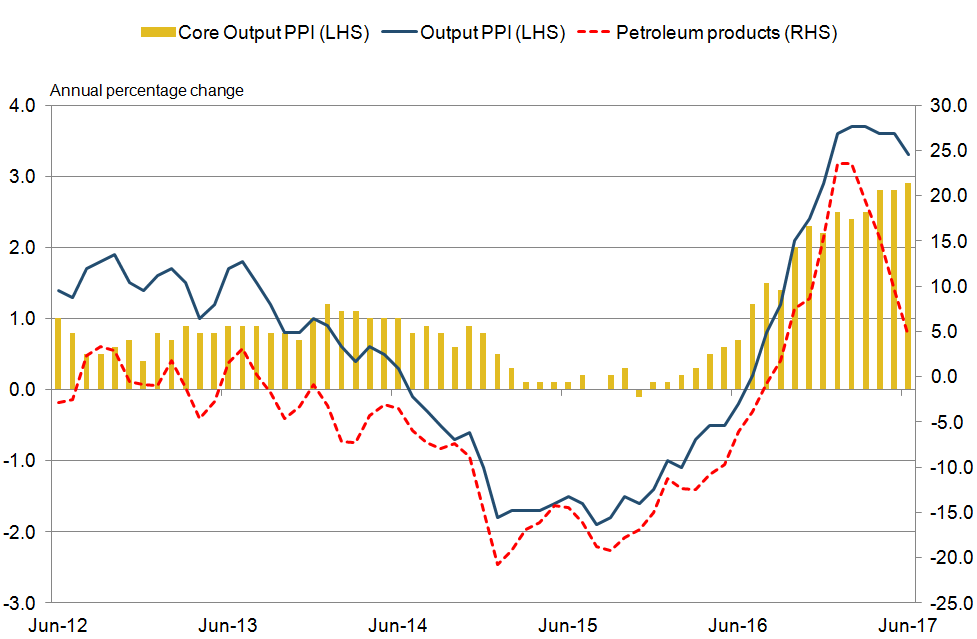
Figure 6 shows annual rates of inflation for overall output Producer Price Index (PPI), core output PPI that excludes food, beverage, tobacco and petroleum (FBTP) industries and the petroleum industry, which is excluded from the core measure. FBTP industries tend to experience more volatile inflation over time with growth being more prone to temporary shocks that can mask the underlying long-run inflation trend. Industries manufacturing goods that represent core inflation are clothing, textiles and leather; paper and printing; chemicals and pharmaceuticals; metals, machinery and equipment; computers, electrical and optical; transport equipment; and other manufactured products.
Figure 6: Output PPI, annual rate of petroleum products, core inflation and overall inflation for goods leaving the factory gate, June 2012 to June 2017, UK
Source: Office for National Statistics
Download this image Figure 6: Output PPI, annual rate of petroleum products, core inflation and overall inflation for goods leaving the factory gate, June 2012 to June 2017, UK
.png (46.1 kB) .xls (21.5 kB)
Until July 2016 the annual rate of core output inflation mostly remained between 0.0% and 1.0%, while overall inflation ranged from 1.9% growth to declines of 1.9%. Across most of 2015 when core and overall inflation were at their lowest, global commodity prices, including petroleum products, were falling and sterling was strong against other leading currencies compared with current rates. According to the Bank of England, sterling was worth 1.38 euros and 1.53 US dollars on average across 2015, compared with 1.14 and 1.28 respectively in June 2017. All else equal, a strong sterling exchange rate results in cheaper inputs of imported materials and fuels for UK manufacturers.
From early 2016, the rate of core and overall inflation increased driven by a recovery in global commodity prices and the depreciation in the value of sterling. Inflation from the petroleum industry was the main driver for the rise in overall inflation from July 2016 and is also the main reason why the rate of factory gate inflation has slowed in recent months.
Figure 7 shows the annual rate of inflation for goods leaving the factory gate along with contributions to the annual rate. The yellow bars show contributions from industries that produce goods that represent core inflation, whereas the blue bars represent contributions from goods produced by non-core FBTP industries.
Figure 7: Output PPI, annual rate of inflation for foods leaving the factory gate and contributions to the annual rate, June 2012 to June 2017, UK
Source: Office for National Statistics
Notes:
- Contributions to the annual change rate may not add up to the rate exactly due to rounding.
Download this chart Figure 7: Output PPI, annual rate of inflation for foods leaving the factory gate and contributions to the annual rate, June 2012 to June 2017, UK
Image .csv .xlsBetween June 2012 and January 2014, prices for goods leaving FBTP industries represented an average 42% of overall contributions to the annual rate of inflation for goods leaving the factory gate. This compares to the period between February 2014 and May 2016 when inflation was mostly driven by non-core FBTP industries. Since May 2016, the annual rate of inflation for goods leaving industries that represent core inflation has steadily increased, with contributions accounting for 55% towards the overall annual rate in June 2017, which stood at 3.3%. This is the first time that core inflation has been the largest contributor to overall inflation since December 2016.
For a breakdown of contributions over time by individual industries please see data tables within Prices economic commentary.
Nôl i'r tabl cynnwys7. Improvements to the Import and Export Price Indices (IPI and EPI) and Services Producer Price Indices (SPPI): June 2017
Please note that the planned sample updates for EPI will not start in June 2017 as previously announced. This is to allow for further quality assurance work to be completed. No updates for either EPI or IPI will now be introduced until this work is complete. A new schedule will be announced in due course.
Nôl i'r tabl cynnwys9. Quality and methodology
The PPI Quality and Methodology Information document contains important information on:
- the strengths and limitations of the data and how it compares with related data
- uses and users of the data
- how the output was created
- the quality of the output including the accuracy of the data
If you would like more information about the reliability of the data, a PPI standard errors article was published on 20 March 2017. The article presented the calculated standard errors of the Producer Price Index (PPI) during the period January 2016 to December 2016, for both month-on-month and 12-month growth.
Guidance on using indices in indexation clauses has been published on our website. It covers producer prices, services producer prices and consumer prices.
An up-to-date manual for the PPI, including the import and export index, is now available. PPI methods and guidance provides an outline of the methods used to produce the PPI as well as information about recent PPI developments.
Gross sector basis figures, which include intra-industry sales and purchases, are shown in PPI dataset Tables 4 and 6.
The detailed input indices of prices of materials and fuels purchased by industry (PPI dataset Table 6) do not include the Climate Change Levy (CCL). This is because each industry can, in practice, pay its own rate for the various forms of energy, depending on the various negotiated discounts and exemptions that apply.
Nôl i'r tabl cynnwys