1. Main points
The headline rate of output prices showed positive growth of 9.3% on the year to December 2021, down from 9.4% in November 2021.
The headline rate of input prices showed positive growth of 13.5% on the year to December 2021, down from 15.2% in November 2021.
Petroleum products, and metals and non-metallic mineral products provided the largest upward contributions to the annual rates of output and input inflation respectively.
The annual rate for the Services Producer Price Index (SPPI) showed positive growth of 3.6% in Quarter 4 (Oct to Dec) 2021, up from 3.4% in Quarter 3 (July to Sept) 2021.
Transportation and storage services provided the largest upward contribution to the annual rate.
2. Analysis
Figure 1: Input producer price inflation (PPI) is more volatile over time than output inflation
Input and output PPI, UK, December 2011 to December 2021
Source: Office for National Statistics – Producer Price Index
Download this chart Figure 1: Input producer price inflation (PPI) is more volatile over time than output inflation
Image .csv .xlsOn the month, the rate of output inflation was 0.3% in December 2021, down from 1.0% in November 2021 (Table 1).
| All manufactured products (GB7S) | ||||
|---|---|---|---|---|
| PPI Index (2015=100) | 1-month rate | 12-month rate | Change in the 12-month rate (percentage points) | |
| 2020 Dec | 108.7 | 0.4 | -0.2 | 0.4 |
| 2021 Jan | 109.5 | 0.7 | 0.2 | 0.4 |
| Feb | 110.2 | 0.7 | 1.0 | 0.8 |
| Mar | 110.6 | 0.4 | 1.9 | 0.9 |
| Apr | 111.1 | 0.4 | 3.5 | 1.6 |
| May | 111.9 | 0.7 | 4.4 | 0.9 |
| June | 112.7 | 0.8 | 4.6 | 0.2 |
| July | 113.8 | 1.0 | 5.4 | 0.8 |
| Aug | 114.6 | 0.7 | 6.2 | 0.8 |
| Sept | 115.4 | 0.7 | 7.0 | 0.8 |
| Oct | 117.4 | 1.7 | 8.8 | 1.8 |
| Nov | 118.5 | 1.0 | 9.4 | 0.6 |
| Dec | 118.8 | 0.3 | 9.3 | -0.1 |
Download this table Table 1: Output prices, index values, growth rates and percentage point change to the 12-month rate
.xls .csvOf the 10 product groups, nine showed positive annual growth in December 2021. Petroleum provided the largest upward contribution of 2.24 percentage points to the annual rate (Figure 2) and had annual price growth of 68.1% in December 2021 (Table 2).
More about economy, business and jobs
- All ONS analysis, summarised in our economy, business and jobs roundup.
- Explore the latest trends in employment, prices and trade in our economic dashboard.
- View all economic data.
Figure 2: Petroleum provided the largest upward contribution to the annual rate
Output prices contribution to 1-month and 12-month growth rate, UK, December 2021
Source: Office for National Statistics - Producer Price Index
Notes:
- Contributions to the rate may not add up to the rate exactly because of rounding.
Download this chart Figure 2: Petroleum provided the largest upward contribution to the annual rate
Image .csv .xls
| Product group | Percentage Change | |
|---|---|---|
| 1-month rate | 12-month rate | |
| Food products | 0.6 | 5.0 |
| Tobacco and alcohol (excl. duty) | -0.9 | -1.5 |
| Clothing, textile and leather | 1.2 | 3.8 |
| Paper and printing | 1.0 | 8.8 |
| Petroleum products (excl. duty) | -2.8 | 68.1 |
| Chemical and pharmaceutical | 1.5 | 14.8 |
| Metal, machinery and equipment | 0.9 | 13.8 |
| Computer, electrical and optical | 0.5 | 4.4 |
| Transport equipment | 0.2 | 2.0 |
| Other manufactured products | 0.1 | 8.2 |
| All manufacturing | 0.3 | 9.3 |
Download this table Table 2: Output prices, growth rates
.xls .csvThe annual rate of output inflation decreased by 0.1 percentage points from 9.4% in November 2021 to 9.3% in December 2021; this is the first time the annual rate of output inflation has slowed since May 2020.
Of the 10 product groups, four showed downward contributions to the change in the rate, with transport equipment providing the largest at negative 1.84 percentage points (Figure 3).
Despite providing the largest downward contribution to the change in the annual rate, the annual rate for transport equipment increased by 0.1 percentage points from 1.9% in November 2021 to 2.0% in December 2021 (Table 2). The downward contribution is driven by weight changes implemented as part of the move to annual chain-linking. More information is available in our Chain-linking in business prices article. You can find out more about how these rates are calculated in Section 5.
Figure 3: Transport equipment made the largest downward contribution to the change in the annual rate
Output PPI, contribution to change in the annual rate, UK, December 2021
Source: Office for National Statistics – Producer Price Index
Notes:
- Contributions to the rate may not add up to the rate exactly because of rounding.
Download this chart Figure 3: Transport equipment made the largest downward contribution to the change in the annual rate
Image .csv .xlsOn the month, the rate of input inflation was negative 0.2% in December 2021, down from 1.5% in November 2021 (Table 3); this is the first time the monthly rate has been negative since August 2020, and was mainly driven by crude oil and fuel with negative monthly rates of 7.9% and 11.2% respectively (Table 5).
| All materials and fuels purchased (GHIP) | ||||
|---|---|---|---|---|
| PPI Index (2015=100) | 1-month rate | 12-month rate | Change in the 12-month rate (percentage points) | |
| 2020 Dec | 114.8 | 1.3 | 0.8 | 1.1 |
| 2021 Jan | 116.1 | 1.1 | 1.9 | 1.1 |
| Feb | 117.2 | 0.9 | 3.2 | 1.3 |
| Mar | 119.0 | 1.6 | 6.1 | 2.9 |
| Apr | 120.5 | 1.2 | 9.7 | 3.6 |
| May | 121.9 | 1.1 | 10.4 | 0.7 |
| June | 122.5 | 0.6 | 9.7 | -0.7 |
| July | 124.1 | 1.3 | 10.6 | 0.9 |
| Aug | 124.8 | 0.6 | 11.4 | 0.8 |
| Sept | 126.2 | 1.1 | 12.4 | 1.0 |
| Oct | 128.6 | 1.9 | 14.0 | 1.6 |
| Nov | 130.5 | 1.5 | 15.2 | 1.2 |
| Dec | 130.3 | -0.2 | 13.5 | -1.7 |
Download this table Table 3: Input prices, index values, growth rates and percentage point change to the 12-month rate
.xls .csvThe annual rate of imported inputs was 7.0% in December 2021 (Table 4), down from 7.6% in November 2021.
| Imported materials and fuels purchased (GD74) | Sterling effective exchange rate - month average (BK67) | ||||||
|---|---|---|---|---|---|---|---|
| PPI Index (2015=100) | 1- month rate | 12- month rate | 12-Change in the month rate (percentage points) | Sterling Index (Jan 2005 =100) | 1- month rate | 12- month rate | |
| 2020 Dec | 115.8 | 1.1 | 0.9 | 1.6 | 78.0 | -0.3 | -3.2 |
| 2021 Jan | 116.2 | 0.4 | 0.9 | 0.0 | 79.0 | 1.3 | -1.6 |
| Feb | 115.6 | -0.5 | 0.1 | -0.8 | 80.6 | 2.0 | -0.1 |
| Mar | 116.9 | 1.2 | 0.7 | 0.6 | 81.7 | 1.4 | 6.4 |
| Apr | 118.3 | 1.2 | 5.4 | 4.7 | 81.3 | -0.5 | 4.1 |
| May | 118.3 | 0.0 | 4.6 | -0.8 | 82.0 | 0.9 | 6.4 |
| June | 118.7 | 0.3 | 4.4 | -0.2 | 82.0 | 0.0 | 6.6 |
| July | 119.9 | 1.0 | 4.6 | 0.2 | 81.9 | -0.1 | 6.5 |
| Aug | 119.3 | -0.5 | 4.4 | -0.2 | 82.0 | 0.1 | 5.0 |
| Sept | 120.7 | 1.1 | 4.8 | 0.4 | 81.6 | -0.5 | 5.7 |
| Oct | 121.5 | 0.7 | 5.6 | 0.8 | 82.1 | 0.6 | 6.1 |
| Nov | 123.3 | 1.5 | 7.6 | 2.0 | 81.6 | -0.6 | 4.3 |
| Dec | 123.9 | 0.4 | 7.0 | -0.6 | 81.5 | -0.1 | 4.5 |
Download this table Table 4: Imported materials and fuels purchased and sterling effective exchange rate, index values, growth rates and percentage point change to the 12-month rate
.xls .csvThe largest upward contribution to the annual input inflation rate came from metals and non-metallic minerals, which contributed 4.23 percentage points (Figure 4) and had positive annual price growth of 20.9% in December 2021 (Table 5). This was mainly driven by basic iron and steel, and of ferro-alloys for domestic market.
Figure 4: Metals and non-metallic minerals provided the largest upward contribution to the annual rate
Input PPI, contribution to 1-month and 12-month growth rate, UK, December 2021
Source: Office for National Statistics – Producer Price Index
Notes:
- Contributions to the rate may not add up to the rate exactly because of rounding.
Download this chart Figure 4: Metals and non-metallic minerals provided the largest upward contribution to the annual rate
Image .csv .xls
| Product group | Percentage change | |
|---|---|---|
| 1-month rate | 12-month rate | |
| Beverages & tobacco | -1.0 | -1.0 |
| Fuel excluding Climate Change Levy | -11.2 | 22.2 |
| Crude oil | -7.9 | 47.3 |
| Home food materials | 1.8 | 5.6 |
| Imported food materials | 1.9 | 3.3 |
| Other produced materials | 0.2 | 20.4 |
| Metals & non-metallic minerals | 0.5 | 20.9 |
| Chemicals | 1.2 | 16.6 |
| Other parts and equipment | 0.4 | 1.6 |
| Other inputs | 0.2 | 0.2 |
| All manufacturing | -0.2 | 13.5 |
Download this table Table 5: Input prices, growth rates
.xls .csvThe annual input inflation rate decreased by 1.7 percentage points from 15.2% in November 2021 to 13.5% in December 2021.
Of the 10 product groups, five showed downward contributions to the change in the rate; crude oil showed the largest downward contribution to the change in the rate at 0.98 percentage points (Figure 5). Crude oil saw a fall of 7.9% between November and December 2021, compared with an increase of 10.1% between the same period in 2020. This base effect is driving the downward contribution, which saw the annual rate for crude oil fall by 28.7 percentage points from 76.0% in November 2021 to 47.3% in December 2021 (Table 5). Annual growth rates for this product group were being driven by crude oil for domestic market.
Figure 5: Crude oil provided the largest downward contribution to the change in the annual rate
Input PPI, contribution to change in the annual rate, UK, December 2021
Source: Office for National Statistics – Producer Price Index
Notes:
- Contributions to the rate may not add up to the rate exactly because of rounding.
Download this chart Figure 5: Crude oil provided the largest downward contribution to the change in the annual rate
Image .csv .xlsThe annual rate of inflation for the Services Producer Price Index (SPPI) was 3.6% in Quarter 4 (Oct to Dec) 2021, up from 3.4% in Quarter 3 (July to Sept) 2021 (Figure 6). This is the highest the rate has been since records began.
Figure 6: The annual rate of inflation for the Services Producer Price Index (SPPI) rose in Quarter 4 (Oct to Dec) 2021
SPPI, UK, Quarter 4 (Oct to Dec) 2011 to Quarter 4 (Oct to Dec) 2021
Source: Office for National Statistics – Services Producer Price Index
Download this chart Figure 6: The annual rate of inflation for the Services Producer Price Index (SPPI) rose in Quarter 4 (Oct to Dec) 2021
Image .csv .xlsThe quarter-on-quarter growth of services sold by UK companies was 0.9% in Quarter 4 2021, down from 1.1% in Quarter 3 (July to Sept) 2021 (Table 6).
| UK | |||||
|---|---|---|---|---|---|
| Percentage change | |||||
| SPPI Index (2015=100) | 1-Quarter | 12-months | Change in the 12-month rate (percentage points) | ||
| 2020 | Q4 | 107.9 | 0.7 | 0.7 | 0.5 |
| 2021 | Q1 | 108.8 | 0.9 | 1.3 | 0.6 |
| Q2 | 109.6 | 0.7 | 1.8 | 0.5 | |
| Q3 | 110.8 | 1.1 | 3.4 | 1.6 | |
| Q4 | 111.8 | 0.9 | 3.6 | 0.2 | |
Download this table Table 6: services producer prices
.xls .csvThe largest upward contribution to the annual rate came from transportation and storage services at 1.45 percentage points (Figure 7), with an annual price increase of 8.0% (Table 7).
Transportation and storage services also provided the largest upward contribution to the quarterly rate at 0.63 percentage points.
Figure 7: Transportation and storage services made the largest upward contribution to the SPPI annual rate
SPPI, contribution to 1-quarter and 12-month growth rate, UK, Quarter 4 (Oct to Dec) 2021
Source: Office for National Statistics – Services Producer Price Index
Notes:
- Contributions to the rate may not add up to the rate exactly because of rounding.
Download this chart Figure 7: Transportation and storage services made the largest upward contribution to the SPPI annual rate
Image .csv .xls
| UK | ||
|---|---|---|
| Service group | Percentage change | |
| 1-quarter | 12-months | |
| Repair and maintenance of motor vehicles | 0.0 | 2.3 |
| Transportation and storage | 3.4 | 8.0 |
| Accommodation and food | 1.6 | 5.2 |
| Information and communication | 1.2 | 0.2 |
| Real estate activities | 0.2 | 0.4 |
| Professional, scientific and technical activities | -0.2 | 3.6 |
| Administrative and support services | 0.1 | 2.4 |
| Education | 0.4 | 0.9 |
| Other services | 0.1 | 0.0 |
| SPPI | 0.9 | 3.6 |
Download this table Table 7: services producer price inflation, 1-quarter and 12-month percentage change
.xls .csv3. Producer price inflation data
Producer price inflation time series
Dataset | Released 19 January 2022
A comprehensive selection of data on input and output indices. Contains producer price indices of materials and fuels purchased and output of manufacturing industry by broad sector.
Output and input producer price inflation: contributions to the 12-month rates
Dataset | Released 19 January 2022
Contributions to the 12-month rates of input and output producer price inflation by component and overall rates.
Producer price inflation
Dataset MM22 | Released 19 January 2022
UK price movement data at all manufacturing, aggregated industry and product group level. Data supplied from individual manufacturers, importers and exporters. Monthly, quarterly and annual data.
4. Glossary
Weight
This is the importance of the price of interest relative to other prices collected. With annual chain linking, this is updated every year using business turnover data.
Index value
Price level in a specific basket of goods.
Annual growth rate
The annual inflation rate.
Link factor
A smoothing factor applied to create a continuous series following a weights change.
Contribution
A measure of influence the index has on the overall growth rate. This depends on both the magnitude of the weight and the inflation rate. A positive contribution is an index that is driving a change in the annual growth rate value. Where the contribution is positive but the growth is negative, this indicates that the index is reducing the annual growth rate (for example, the growth rate would be higher if this index had a lower weight).
Producer price inflation
Changes in the prices of goods bought and sold by UK manufacturers, including price indices of materials and fuels purchased (input prices) and factory gate prices (output prices).
Output prices
The factory gate price (output price) is the amount received by UK producers for the goods that they sell to the domestic market. It includes the margin that businesses make on goods, in addition to costs such as labour, raw materials and energy, as well as interest on loans, site or building maintenance, or rent.
Input prices
The input price measures the price of materials and fuels bought by UK manufacturers for processing. It includes materials and fuels that are both imported or sourced within the domestic market. It is not limited to materials used in the final product, but includes what is required by businesses in their normal day-to-day running, such as fuels.
Services producer price inflation
Quarterly estimates monitoring the changes in prices charged for services provided to UK-based customers for a range of industries.
Nôl i'r tabl cynnwys5. Measuring the data
Producer price inflation (PPI) uses contributions to identify how indices influence the overall inflation rate. This section gives additional information on the calculation and how to interpret it.
Example scenarios
The following gives examples of how weight and inflation rate changes most commonly affect the contribution. In PPI, the weights usually have greater influence on the contribution, as these tend to show greater change than the annual inflation rate:
decrease in weight and in inflation rate — contribution is negative
decrease in weight, increase in inflation rate — contribution is usually negative
no change in weight or inflation rate — no change
no change in weight, increase in inflation rate — no change
increase in weight, decrease in inflation rate — contribution is usually positive
increase in weight, no change in inflation rate — contribution is positive
increase in weight, increase in inflation rate — contribution is positive
Contributions are calculated using the following formula:

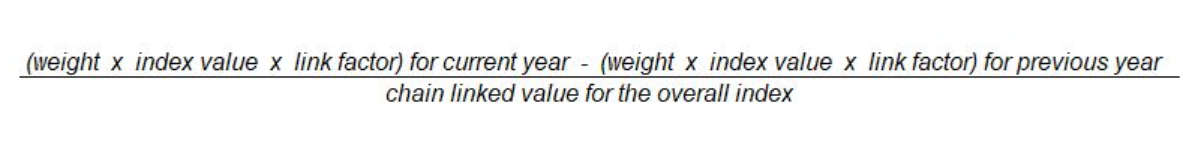
Quality and methodology information on strengths, limitations, appropriate uses, and how the data were created is available in the Producer Price Index (PPI) quality and methodology information (QMI) report and the Services Producer Price Indices (SPPI) QMI report.
Other useful documentation for the PPI and the SPPI are:
Sterling effective exchange rate
The sterling effective exchange rate measures changes in the strength of sterling relative to basket of other currencies. The sterling effective exchange rate is only indicative of the rates applied to producer prices. This is because the sterling effective exchange rate is a trade weighted index that represents all UK trade, whereas producer prices reflect transaction in the manufacture sector.
Nôl i'r tabl cynnwys6. Strengths and limitations
Strengths
These data provide users with valuable insight into the changes in the process of goods and services bought and sold by UK manufacturers.
Our data is very comprehensive, covering many products at a much greater level of detail than other surveys.
Limitations
Some products are produced by only a small number of manufacturers, meaning that there may not be enough manufacturers for a detailed and robust analysis and the sector may be volatile, requiring some estimation.
The data can be revised for 12 months.
The data for the latest two months of the Producer Price Index (PPI) and two quarters of the Services Producer Price Index (SPPI) are provisional.
Coronavirus (COVID-19) in December 2021
Response rates for the domestic PPI and Export Price Index (EPI) show a decrease between November 2021 and December 2021, whereas the response rates for the Import Price Index (IPI) show an increase between November 2021 and December 2021 (Table 8). The response rate for SPPI shows a decrease between Quarter 3 (July to Sept) 2021 and Quarter 4 (Oct to Dec) 2021 (Table 9).
| Weighted response | |||
|---|---|---|---|
| PPI (domestic) | IPI | EPI | |
| December 2020 | 73.5 | 71.9 | 76.6 |
| January 2021 | 74.8 | 70.7 | 58.7 |
| February 2021 | 75.3 | 74.2 | 62.3 |
| March 2021 | 73.9 | 75.5 | 65.4 |
| April 2021 | 79.0 | 72.6 | 60.3 |
| May 2021 | 75.5 | 77.1 | 62.7 |
| June 2021 | 77.1 | 75.3 | 64.8 |
| July 2021 | 71.1 | 68.2 | 70.7 |
| August 2021 | 73.0 | 67.9 | 72.8 |
| September 2021 | 73.3 | 67.1 | 73.8 |
| October 2021 | 67.1 | 70.5 | 67.3 |
| November 2021 | 71.1 | 69.0 | 68.8 |
| December 2021 | 68.6 | 70.0 | 63.6 |
Download this table Table 8: Overall effective response rates at time of first publishing percentage December 2020 to December 2021
.xls .csv
| Weighted Response SPPI | |
|---|---|
| 2020 Q4 | 74.9 |
| 2021 Q1 | 73.2 |
| Q2 | 71.0 |
| Q3 | 74.2 |
| Q4 | 71.3 |