Cynnwys
- Main points
- Summary
- Prices that move by a similar amount each year have a limited impact on the change in the 12-month growth rate of consumer prices
- Consumer prices for electricity and gas rose more sharply than producer prices in April 2019, as the Ofgem price cap also rose
- Property sales volumes by price bracket show similar geographic trends to average prices
- Authors
1. Main points
The 12-month growth rate of the Consumer Prices Index including owner occupiers’ housing costs (CPIH) rose to 2.0% in April 2019, up from 1.8% in March 2019.
The input Producer Price Index (input PPI) grew by 3.8% in the 12 months to April 2019, up from 3.2% in the 12 months to March 2019.
The output Producer Price Index (output PPI) grew by 2.1% in the 12 months to April 2019, down from 2.2% in the 12 months to March 2019.
A number of goods and services saw an annual uplift in prices in April 2019 but this had a limited impact on the growth rate of CPIH as it was of a similar scale to previous years.
Both consumer electricity and gas prices increased between March and April 2019, as energy providers responded to increases in Ofgem’s energy price cap.
Air fares contributed strongly to the change in the 12-month growth rate of CPIH between March and April 2019, as Easter, falling towards the end of April, affected April prices.
Property sales volumes by price bracket show similar geographic trends to average prices.
2. Summary
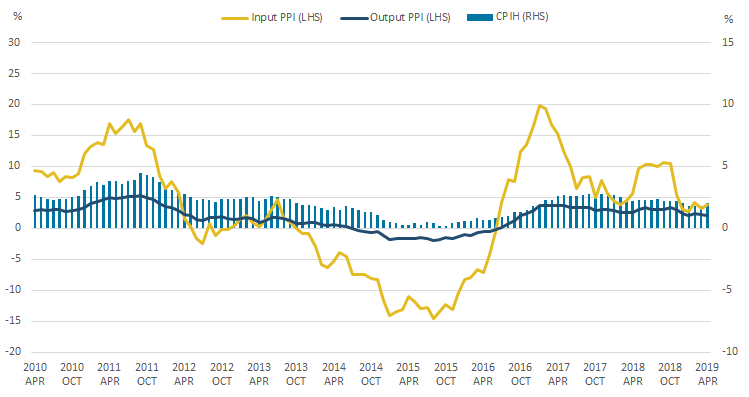
Figure 1 shows that the 12-month growth rate of the Consumer Prices Index including owner occupiers’ housing costs (CPIH) was 2.0% in April 2019, up from 1.8% in March 2019. The largest upward contributions to change in the 12-month rate came from increases in electricity and gas, and transport, predominantly from air fares. These upward effects were offset by downward contributions from a variety of categories including recreation and culture, alcoholic beverages and tobacco, and restaurants and hotels.
The input Producer Price Index (input PPI) grew by 3.8% in the 12 months to April 2019, up from 3.2% in the 12 months to March 2019. Crude oil made the largest upward contribution to the 12-month growth rate of input PPI in April 2019.
The output Producer Price Index (output PPI) grew by 2.1% in the 12 months to April 2019, down from 2.2% in the 12 months to March 2019. All product groups provided upward contributions to the 12-month growth rate of output PPI in April 2019.
Figure 1: 12-month growth rates of CPIH and input PPI increased, while output PPI fell in April 2019
12-month growth rates for input PPI and output PPI (left-hand side), and CPIH (right-hand side), UK, April 2010 to April 2019
Source: Office for National Statistics – Producer Price Index and Consumer Prices Index including owner occupiers’ housing costs
Notes:
- These data are also available within the Dashboard: Understanding the UK economy.
Download this image Figure 1: 12-month growth rates of CPIH and input PPI increased, while output PPI fell in April 2019
.png (24.8 kB) .xlsx (20.9 kB)
3. Prices that move by a similar amount each year have a limited impact on the change in the 12-month growth rate of consumer prices
Every April, annual price changes are recorded for a number of items within the basket for the Consumer Prices Index including owner occupiers’ housing costs (CPIH). Table 1 combines some of these items to show how price movements between January and April this year (2019) compare with price movements in previous years.
Items included in this series are:
- local authority rents
- Council Tax or Rates
- water charges
- sewerage and environment charges
- postage charges
- NHS prescription charges
- NHS dental charges
- Vehicle Excise Duty
- TV licence fee
Prices for these goods and services increased by around 3.4% between January and April 2019, the same percentage increase as in 2017. Price increases have been of a similar scale between 2015 and 2018, with prices increasing by between 1.0% in 2015 and 3.8% in 2018.
| Index, January of each year=100 | |||||
|---|---|---|---|---|---|
| 2015 | 2016 | 2017 | 2018 | 2019 | |
| January | 100 | 100 | 100 | 100 | 100 |
| February | 100 | 100 | 100 | 100 | 100 |
| March | 100 | 100 | 100 | 100 | 100 |
| April | 101 | 101.8 | 103.4 | 103.8 | 103.4 |
| May | 101 | 101.8 | 103.4 | 103.8 | |
| June | 101 | 101.8 | 103.4 | 103.8 | |
| July | 101 | 101.8 | 103.4 | 103.8 | |
| August | 101 | 101.8 | 103.4 | 103.8 | |
| September | 101 | 101.8 | 103.4 | 103.8 | |
| October | 101 | 101.8 | 103.4 | 103.8 | |
| November | 101 | 101.8 | 103.4 | 103.8 | |
| December | 101 | 101.8 | 103.4 | 103.8 | |
Download this table Table 1: The combined annual April price increase has been of a similar scale over the last few years
.xls .csvFigure 2 shows how prices for these individual components of CPIH have changed since January 2014, and shows how prices for the whole basket have changed over the same period.
Figure 2: Sewerage collection and dental services are among the selected indices that have seen a larger price increase than headline CPIH since January 2014
Selected CPIH indices that experience an annual price increase every April and headline CPIH, UK, January 2014 to April 2019
Source: Office for National Statistics – Consumer Prices Index including owner occupiers’ housing costs
Notes:
Download this chart Figure 2: Sewerage collection and dental services are among the selected indices that have seen a larger price increase than headline CPIH since January 2014
Image .csv .xlsPrices for the overall CPIH basket have risen by around 9% in the period since 2014. This is more than water supply charges, which have seen prices increase by around 7% over the same period, but is less than price increases seen for other components, which range from around 13% for pharmaceutical products to around 20% for dental services. Note, both pharmaceutical products and dental services include other items in addition to NHS charges.
Although a range of goods and services experience this annual price change at the same time each year, they typically have a limited effect on the 12-month growth rate of CPIH, or on the change in the 12-month growth rate from March to April. They are therefore not cited as particular drivers of inflation.
One reason for this is that the goods and services being uprated typically have relatively small weights within the CPIH basket and therefore have less impact on the 12-month growth rate than other components. For example, water supply has a weighting of four parts per thousand in the CPIH basket.
Another reason is that prices for these goods and services tend to increase by a similar amount between March and April each year and therefore have very little impact on the change in the 12-month growth rate between those two months. This is because the contribution to the change in the 12-month growth rate depends on how the price movement between two months differs from the movement between the same two months in the previous year.
This infographic explains how price movements of items contribute to changes in the 12-month inflation rate.
Air fares is an example of where differences in the timing of price movements from year to year have a large impact. Figure 3 shows how air fares have moved from January each year since 2015. The legend also shows, in brackets, which month Easter Sunday fell in for each year. Unlike other macroeconomic series, consumer price indices are not seasonally adjusted.
Figure 3: Air fares saw a price increase of around 26% between March and April 2019
Price indices for air fares, UK, 2015 to 2019
Source: Office for National Statistics – Consumer Prices Index including owner occupiers’ housing costs
Download this chart Figure 3: Air fares saw a price increase of around 26% between March and April 2019
Image .csv .xlsPrices for air fares typically rise during the school holidays, which follow similar patterns each year for the summer and Christmas holidays. As such, we see similar price patterns with prices rising through the summer before falling back in the autumn and rising again in December.
For Easter, however, school holidays typically move as the timing of Easter moves from year to year, sometimes falling in March and sometimes in April. Therefore, we can see that there were price rises for air fares in March 2016, April 2017 and April 2019. In 2015 and 2018, Easter fell in early April and was largely between collection dates for CPIH, so it had limited impact on the CPIH data.
Air fares was one of the biggest drivers of the change in the 12-month growth rate of CPIH this month, as observed prices increased by around 26% between March and April 2019 but actually fell slightly between March and April 2018. As such, air fares have made a positive contribution to the change in the 12-month growth rate of CPIH in April 2019 but made a negative contribution to the change in the 12-month growth rate in April 2018.
Nôl i'r tabl cynnwys4. Consumer prices for electricity and gas rose more sharply than producer prices in April 2019, as the Ofgem price cap also rose
Figure 4 shows movements in the Ofgem wholesale prices for electricity and the electricity components of the input Producer Price Index (PPI) and the Consumer Prices Index including owner occupiers’ housing costs (CPIH) between January 2012 and April 2019. Figure 5 shows the equivalent series for gas.
Consumer prices for electricity rose by almost 11% between March and April 2019, while input producer prices for electricity rose by around 2% over the same period. Wholesale electricity prices are only available until December 2018 but rose by around 3% between November and December 2018, and rose considerably faster than producer and consumer electricity prices between June 2017 and September 2018.
Consumer prices reflect more than just wholesale prices as they also include the cost of transmission, distribution and regulatory costs, as well as profits for energy suppliers and others in the supply chain.
Figure 4: Consumer prices for electricity increased in April 2019, coinciding with an increase in the energy price cap set by Ofgem
Price indices for wholesale electricity and the electricity components of input PPI and CPIH, UK, January 2012 to April 2019
Source: Office for National Statistics – Producer Price Index and Consumer Prices Index including owner occupiers’ housing costs, Office of Gas and Electricity Markets (OFGEM)
Notes:
- The latest data available for Ofgem wholesale electricity are December 2018.
Download this chart Figure 4: Consumer prices for electricity increased in April 2019, coinciding with an increase in the energy price cap set by Ofgem
Image .csv .xlsConsumer prices for electricity fell by 4.9% between December 2018 and January 2019, likely reflecting regulatory changes that came into force in England, Wales and Scotland on 1 January 2019. The energy regulator, Ofgem, introduced a cap on energy prices that applies to “standard variable” energy tariffs, in addition to pre-existing caps on prices for prepayment meters and for those in receipt of the government’s Warm Home Discount, and puts an upper limit on the price a supplier can charge per unit of energy.
Energy suppliers adjusting their prices in line with the Ofgem cap likely accounts for the majority of the movement we have seen in consumer prices since December 2018. It was announced in February 2019 that the cap for the Default Tariff would increase by 10%, effective from 1 April 2019 until 30 September 2019 and would be reviewed again prior to September 2019.
Any changes to Ofgem’s energy price cap will be visible in CPIH movements, as the basket is based on data for gas and electricity prices on prepayment meters and variable rates (both of which are subject to the cap). Wholesale electricity and gas prices also feed through to the prices for fixed-rate contracts (which are not subject to the cap for most consumers) but, as only those consumers coming to the end of the fixed-rate contract would be immediately affected by the change and there is an extensive range of alternative available plans, it would be difficult to measure the immediate impact of price rises.
Figure 5: Consumer prices for gas saw a similar increase to electricity prices in April 2019, following an increase in the energy price cap set by Ofgem
Price indices for wholesale gas and the gas components of input PPI and CPIH, UK, January 2012 to April 2019
Source: Office for National Statistics – Producer Price Index and Consumer Prices Index including owner occupiers’ housing costs, Office of Gas and Electricity Markets (Ofgem)
Notes:
- The latest data available for Ofgem wholesale gas are December 2018.
Download this chart Figure 5: Consumer prices for gas saw a similar increase to electricity prices in April 2019, following an increase in the energy price cap set by Ofgem
Image .csv .xlsFigure 5 shows movements in wholesale prices for gas, as well as the gas components of the input PPI and CPIH, between January 2012 and April 2019. Consumer prices for gas rose by around 9% between March and April 2019, while input producer prices for gas rose by around 3% on the month. Wholesale gas prices fell by around 14% between September and December 2018 but this followed an increase of around 34% between June and September 2018.
Nôl i'r tabl cynnwys5. Property sales volumes by price bracket show similar geographic trends to average prices
There has always been considerable variation in property prices between the countries and regions of the UK. In 2018, London had the highest average property price at £478,000, followed by the South (excluding London), which had an average property price of £294,000. The Midlands, Wales, the North of England, Scotland and Northern Ireland all had average property prices below £200,000 in 2018, with Northern Ireland having the lowest average price at £133,000.
| £ | |||
|---|---|---|---|
| 2017 | 2018 | Change | |
| London | 480,000 | 478,000 | -0.4% |
| South | 286,000 | 294,000 | +2.8% |
| Midlands | 183,000 | 192,000 | +4.9% |
| Wales | 151,000 | 157,000 | +4.0% |
| North | 150,000 | 155,000 | +3.3% |
| Scotland | 143,000 | 149,000 | +4.2% |
| Northern Ireland | 128,000 | 133,000 | +3.9% |
Download this table Table 2: London is the most expensive region, with average house prices close to £200,000 higher than any other region
.xls .csvAverage prices, however, mask the variation in property prices within countries and regions of the UK, which can be substantial and depend on a range of market factors.
Figure 6 splits out property transactions by £50,000 price brackets and shows what proportion of transactions for each country and area of the UK fell into each price bracket in 2018. This allows us to see how the distribution of property values varies across the UK.
Figure 6: Wales, Scotland and the North are the areas with the most properties in the lower price brackets, maintaining the trend seen for average house prices
Proportion of property sales in each price bracket for Scotland, Wales and areas of England, 2018
Source: Office for National Statistics, HM Land Registry – UK House Price Index
Notes:
- Percentages may not sum to 100 due to rounding.
- Data are not available for Northern Ireland.
- The North combines the North East, the North West and Yorkshire and The Humber.
- The Midlands combines the East Midlands and the West Midlands.
- The South combines the South East, the South West and the East of England.
Download this chart Figure 6: Wales, Scotland and the North are the areas with the most properties in the lower price brackets, maintaining the trend seen for average house prices
Image .csv .xlsClear geographic variations are apparent in the proportion of property transactions falling within price brackets at the lower and higher ends of the distribution, in keeping with trends seen in average house prices.
Wales, Scotland and the North of England all had their highest proportion of property transactions in the £100,000 to £149,999 price bracket, while for the Midlands, more transactions were in the £150,000 to £199,999 price bracket than any other. In the South of England (excluding London), the highest volume of transactions was in the £200,000 to £249,999 price bracket, while for London the most common price bracket was £350,000 to £399,999.
The peaks of sales volumes in each bracket also get lower the higher up the price distribution you go. Wales, Scotland, the North and the Midlands all had over 20% of sales volumes in one price bracket, while for the South of England (excluding London), the most common price bracket had 16% of property transactions.
For London, the distribution of property prices is notably flatter, with the most common price bracket only having 11% of transactions and five price brackets having between 9% and 11% of property transactions each. Over 10% of property transactions in London in 2018 were for properties costing over £1 million.
Figure 7 shows sales volumes of properties over £1 million for each country and area of Great Britain, split into price brackets of £250,000. Note that data are shown as actual sales volumes here, not as percentages as shown in Figure 6.
Figure 7: The majority of properties sold for over £1 million are sold in London
Sales volumes of properties over £1 million for each country and area of Great Britain, 2018
Source: Office for National Statistics, HM Land Registry – UK House Price Index
Notes:
- Data are not available for Northern Ireland.
- The North combines the North East, the North West and Yorkshire and The Humber.
- The Midlands combines the East Midlands and the West Midlands.
- The South combines the South East, the South West and the East of England.
Download this chart Figure 7: The majority of properties sold for over £1 million are sold in London
Image .csv .xlsUnsurprisingly, the majority of properties sold for over £1 million in 2018 were in London, followed by the South of England. All the countries and areas of Great Britain had some property sales for over £1 million, but only London saw any transactions for properties over £10 million.
Nôl i'r tabl cynnwysManylion cyswllt ar gyfer y Erthygl
Related publications
- Consumer price inflation, UK: April 2019
- CPIH-consistent inflation rate estimates for UK household groups: 2005 to 2019
- CPIH-consistent inflation rate estimates for UK household groups: 2005 to 2019
- UK House Price Index: March 2019
- Index of Private Housing Rental Prices, UK: April 2019
- Regional gross disposable household income, UK: 1997 to 2017
- Producer price inflation, UK: April 2019
- Construction Output Price Indices (OPIs), UK: January to March 2019