1. Main points
Private rental prices paid by tenants in the UK rose by 1.2% in the 12 months to April 2019, unchanged from March 2019.
In England, private rental prices grew by 1.2%, Wales experienced growth of 1.1%, while in Scotland private rental prices increased by 0.7% in the 12 months to April 2019.
London private rental prices rose by 0.5% in the 12 months to April 2019, unchanged from March 2019.
2. Things you need to know about this release
The Index of Private Housing Rental Prices (IPHRP) measures the change in the price tenants face when renting residential property from private landlords, thereby allowing a comparison between the prices tenants are charged in the current month as opposed to the same month in the previous year. The index does not only measure the change in newly advertised rental prices, but reflects price changes for all private rental properties.
The IPHRP is constructed using administrative data. That is, the index makes use of data that are already collected for other purposes to estimate rental prices. The sources of private rental prices are Valuation Office Agency (VOA), Scottish Government (SG), Welsh Government (WG) and Northern Ireland Housing Executive (NIHE). All these organisations deploy rental officers to collect the price paid for privately rented properties. Data for Northern Ireland also include data provided by propertynews.com. Annually, over 450,000 private rents prices are collected in England, 30,000 in Wales, 25,000 in Scotland and 15,000 in Northern Ireland. The sources of expenditure weights are the Ministry of Housing, Communities and Local Government (MHCLG), Scottish Government, Welsh Government, Northern Ireland Housing Executive and the VOA.
IPHRP is released as an Experimental Statistic. While the methodology for IPHRP is final, Northern Ireland data were previously excluded from the price index. We have since worked with the Northern Ireland Housing Executive to secure private rental data for Northern Ireland with results first published in our August 2018 release on 19 September 2018. We have also used these data to improve the coverage of IPHRP to that of the UK, which was published for the first time in our September 2018 release on 17 October 2018.
The IPHRP is scheduled to be assessed against the Code of Practice for Statistics in 2019 with the aim of achieving National Statistics status for the release.
Nôl i'r tabl cynnwys3. UK private rental prices growth rate unchanged
Private rental prices paid by tenants in the UK increased by 1.2% in the 12 months to April 2019, unchanged from 1.2% in March 2019. For example, a property that was rented for £500 per month in April 2018, which saw its rent increase by the average rate in the UK, would be rented for £506 in April 2019. Growth in private rental prices paid by tenants in the UK has generally slowed since the beginning of 2016, driven mainly by a slowdown in London over the same period. Rental growth has started to pick up since the end of 2018, driven by strengthening growth in London.
Rental prices for the UK excluding London increased by 1.5% in the 12 months to April 2019, unchanged from March 2019 (Figure 1). London private rental prices increased by 0.5% in the 12 months to April 2019, unchanged from 0.5% in March 2019.
Figure 1: Broad slowdown in the UK annual growth rate between 2016 and 2018
Index of Private Housing Rental Prices percentage change over 12 months, UK and Great Britain, January 2012 to April 2019
Source: Office for National Statistics - Index of Private Housing Rental Prices
Notes:
- Data presented in this dataset are classified as Experimental Statistics and subject to revisions if improvements in the methodology are identified. Results should be interpreted with this in mind.
Download this chart Figure 1: Broad slowdown in the UK annual growth rate between 2016 and 2018
Image .csv .xlsThe Royal Institution of Chartered Surveyors’ (RICS’s) April 2019 Residential Market Survey reported that tenant demand continued to rise gently while supply (new landlord instructions) slipped further, remaining in negative territory since the middle of 2016.
In contrast, the Association of Residential Letting Agents (ARLA) reported in their Private Rented Sector Report for March 2019 that the supply of rental properties has risen but agrees that demand from prospective renters has also increased marginally.
These supply and demand pressures can take time to feed through to the Index of Private Housing Rental Prices (IPHRP), which reflects price changes for all private rental properties, rather than only newly advertised rental properties.
Focusing on the long-term trend, between January 2015 and April 2019, private rental prices in the UK increased by 7.4% (Figure 2).
Figure 2: UK rental prices have increased by around 7% since January 2015
Index of Private Housing Rental Prices indices, UK, January 2015 to April 2019
Source: Office for National Statistics - Index of Private Housing Rental Prices
Notes:
- Data presented in this dataset are classified as Experimental Statistics and subject to revisions if improvements in the methodology are identified. Results should be interpreted with this in mind.
Download this chart Figure 2: UK rental prices have increased by around 7% since January 2015
Image .csv .xls4. How do growth rates compare at the country level?
In England, private rental prices grew by 1.2% in the 12 months to April 2019, unchanged from 1.2% in March 2019. When London is excluded from England, privately rented properties increased by 1.6% in the 12 months to April 2019.
Private rental prices in Wales grew by 1.1% in the 12 months to April 2019, unchanged since February 2019.
Rental growth in Scotland increased by 0.7% in the 12 months to April 2019, unchanged since January 2019. The weaker growth in Scotland since 2016 may be due to stronger supply and weaker demand in Scotland, as reported by the Association of Residential Letting Agents (ARLA).
The annual rate of change for Northern Ireland (2.0%) in December 2018 is higher than the other countries of the UK. The Northern Ireland annual growth rate remained broadly consistent around 2% throughout 2018. Northern Ireland data have been copied forward since December 2018. The next update to Northern Ireland data will be in the release on 19 June 2019.
Figure 3: Annual rental growth in Scotland is slower than other countries of the UK
Index of Private Housing Rental Prices percentage change over 12 months for countries of the UK, January 2012 to April 2019
Source: Office for National Statistics - Index of Private Housing Rental Prices
Notes:
Data presented in this dataset are classified as Experimental Statistics and subject to revisions if improvements in the methodology are identified. Results should be interpreted with this in mind.
Northern Ireland data are only available every three months. Northern Ireland data are copied forward until the next data are available, which will be in the June 2019 release.
Download this chart Figure 3: Annual rental growth in Scotland is slower than other countries of the UK
Image .csv .xlsAll UK countries have experienced rises in their private rental prices since 2015 (Figure 4). Since January 2015, rental prices in England have increased more than those in Wales, Scotland and Northern Ireland.
Figure 4: Rental prices have increased more in England than the rest of the UK since 2015
Index of Private Housing Rental Prices indices for countries of the UK, January 2015 to April 2019
Source: Office for National Statistics - Index of Private Housing Rental Prices
Notes:
Data presented in this dataset are classified as Experimental Statistics and subject to revisions if improvements in the methodology are identified. Results should be interpreted with this in mind.
Northern Ireland data are only available every three months. Northern Ireland data are copied forward until the next data are available, which will be in the June 2019 release.
Download this chart Figure 4: Rental prices have increased more in England than the rest of the UK since 2015
Image .csv .xls5. Growth in London private rental prices strengthening since mid-2018
London private rental prices increased by 0.5% in the 12 months to April 2019, unchanged from 0.5% in the 12 months to March 2019, remaining at its highest annual growth since November 2017. The Royal Institution of Chartered Surveyors (RICS) reported in their September 2018 Residential Market Survey that tenant demand has staged a sustained recovery in London, increasingly outstripping supply. These effects may be now starting to feed through to the Index of Private Housing Rental Prices.
Focusing on the English regions, the largest annual rental price increase was in the East Midlands (2.1%), down from 2.3% in March 2019 (Figure 5). This was followed by Yorkshire and The Humber (1.8%), unchanged from March 2019, and the South West (1.7%), unchanged from March 2019.
The lowest annual rental price growth was in the North East where prices increased by 0.4%, up from 0.3% in March 2019. It was followed by London, which increased by 0.5%, unchanged from March 2019.
Figure 5: Strongest annual rental price growth in the East Midlands
Index of Private Housing Rental Prices percentage change over the 12 months to April 2019, by English region
Source: Office for National Statistics - Index of Private Housing Rental Prices
Notes:
- Data presented in this dataset are classified as Experimental Statistics and subject to revisions if improvements in the methodology are identified. Results should be interpreted with this in mind.
Download this chart Figure 5: Strongest annual rental price growth in the East Midlands
Image .csv .xlsFigure 6 shows the historical 12-month percentage growth rate in the rental prices of each of the English regions.
Figure 6: London rental prices experience higher increases and falls than other region
Index of Private Housing Rental Prices percentage change over 12 months by English region, January 2007 to April 2019

Source: Office for National Statistics - Index of Private Housing Rental Prices
Notes:
- The grey line shows the average England 12-month percentage change.
Download this image Figure 6: London rental prices experience higher increases and falls than other region
.png (59.4 kB) .xls (71.7 kB)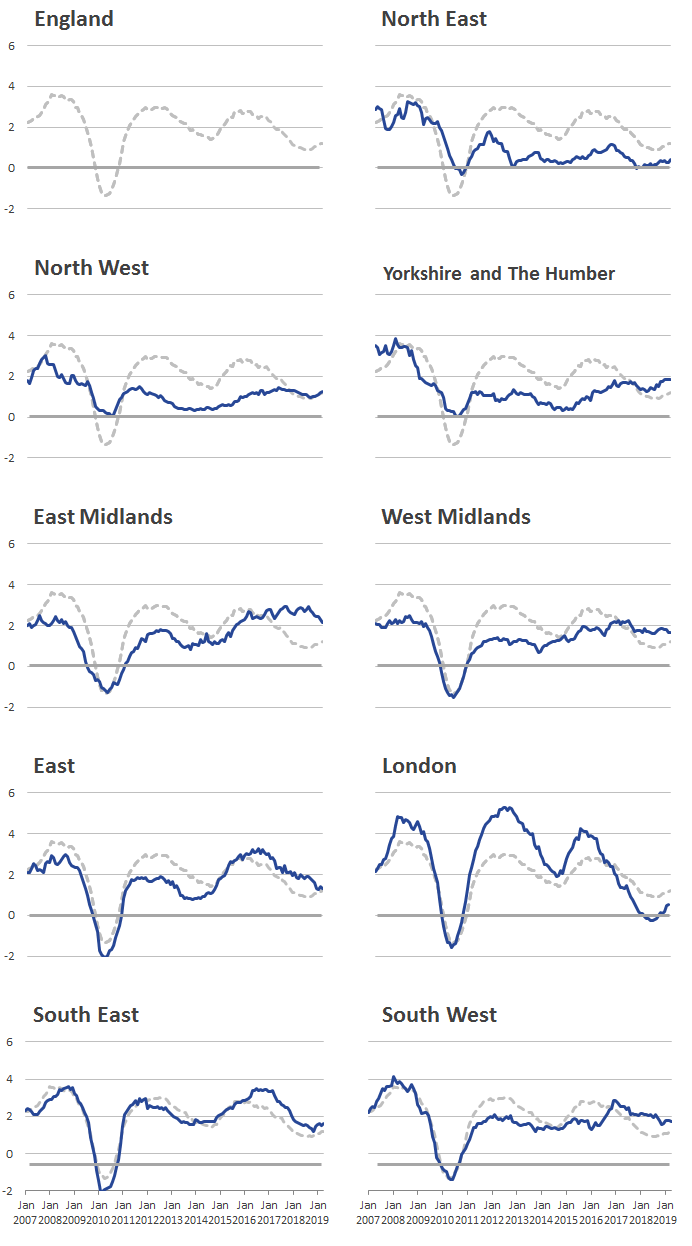
7. Quality and methodology
The Index of Private Housing Rental Prices Quality and Methodology Information report contains important information on:
the strengths and limitations of the data and how it compares with related data
uses and users of the data
how the output was created
the quality of the output including the accuracy of the data
Private rental growth measures, a UK comparison, compares the growth in the Index of Private Housing Rental Prices to other measures of private rental growth.
Quality assurance of administrative data used in private rental housing statistics documents the administrative data sources used in the production of the Index of Private Housing Rental Prices and the quality assurance processes applied to them.
Nôl i'r tabl cynnwys