Cynnwys
- Main points
- What’s changed in this release?
- Things you need to know about this release
- How much is the public sector borrowing?
- How big is public sector debt?
- How much cash does the public sector need to raise?
- How was debt in the current financial year-to-date accumulated?
- How do these figures compare with official forecasts?
- Revisions since previous release
- International comparisons of borrowing and debt
- Quality and methodology
1. Main points
Public sector net borrowing (excluding public sector banks) decreased by £2.5 billion to £32.5 billion in the current financial year-to-date (April 2017 to September 2017), compared with the same period in 2016; this is the lowest year-to-date net borrowing since 2007.
Public sector net borrowing (excluding public sector banks) decreased by £0.7 billion to £5.9 billion in September 2017, compared with September 2016; this is the lowest September net borrowing since 2007.
The Office for Budget Responsibility (OBR) forecast that public sector net borrowing (excluding public sector banks) will be £58.3 billion during the financial year ending March 2018, an increase of £12.6 billion on the outturn net borrowing in the financial year ending March 2017.
Public sector net debt (excluding public sector banks) was £1,785.3 billion at the end of September 2017, equivalent to 87.2% of gross domestic product (GDP), an increase of £145.2 billion (or 4.4 percentage points as a ratio of GDP) on September 2016.
Public sector net debt (excluding both public sector banks and Bank of England) was £1,637.8 billion at the end of September 2017, equivalent to 80.0% of GDP; an increase of £44.9 billion (or a decrease of 0.4 percentage points as a ratio of GDP) on September 2016.
Central government net cash requirement decreased by £30.8 billion to £25.0 billion in the current financial year-to-date (April 2017 to September 2017), compared with the same period in 2016, largely as a result of two large cash transactions; this is the lowest year-to-date central government net cash requirement since 2007.
2. What’s changed in this release?
This section presents information on aspects of data or methodology that is important to understand when reading this bulletin. Where appropriate, further details of individual changes are discussed in the “Quality and methodology” section of this bulletin.
Estimating the full financial year’s net borrowing
At this halfway point in the year it may seem reasonable to multiply the year-to-date borrowing by 2 to arrive at an estimate of the likely final full-year borrowing. Figure 1 illustrates why this calculation is likely to be misleading.
Referring to the financial year ending March 2017; the year-to-date borrowing position at this point last year was £35.0 billion. If we were to base an end of financial year borrowing estimate on this, we would expect borrowing to have been £70.0 billion. This estimate would have overstated the actual financial year borrowing position of £45.7 billion by £24.3 billion, or £18.3 billion compared to the OBR forecast.
Gross Domestic product
On the 29 September 2017, we published the Quarterly national accounts: April to June 2017. These re-stated estimates of gross domestic product (GDP) have been incorporated into this release resulting in historic revisions to all aggregates presented as a proportion of GDP.
Nôl i'r tabl cynnwys3. Things you need to know about this release
What are the most important terms I need to know?
Public sector net borrowing excluding public sector banks (PSNB ex) measures the gap between revenue raised (current receipts) and total spending (current expenditure plus net investment (capital spending less capital receipts)). Public sector net borrowing is often referred to by commentators as “the deficit”.
The public sector net cash requirement (PSNCR) represents the cash needed to be raised from the financial markets over a period of time to finance the government’s activities. This can be close to the deficit for the same period but there are some transactions, for example, loans to the private sector, which need to be financed but do not contribute to the deficit. It is also close but not identical to the changes in the level of net debt between two points in time.
Public sector net debt excluding public sector banks (PSND ex) represents the amount of money the public sector owes to private sector organisations including overseas institutions, largely as a result of issuing gilts and treasury bills, less the amount of cash and other short-term assets it holds.
While borrowing (or the deficit) represents the difference between total spending and receipts over a period of time, debt represents the total amount of money owed at a point in time.
The debt has been built up by successive government administrations over many years. When the government borrows (that is, runs a deficit), this normally adds to the debt total. So reducing the deficit is not the same as reducing the debt.
If you’d like to know more about the relationship between debt and deficit, please refer to our article The debt and deficit of the UK public sector explained.
What does the public sector include?
In the UK, the public sector consists of five sub-sectors: central government, local government, public non-financial corporations, Bank of England and public financial corporations (or public sector banks).
Unless otherwise stated, the figures quoted in this bulletin exclude public sector banks (that is currently only Royal Bank of Scotland (RBS)), as the reported position of debt (and to a lesser extent borrowing) would be distorted by the inclusion of RBS's balance sheet (and transactions). This is because government does not need to borrow to fund the debt of RBS, nor would surpluses achieved by RBS be passed on to government, other than through any dividends paid as a result of government equity holdings.
The sub-sector breakdown of public sector net borrowing is summarised in Table PSA2 in the Public sector finances Tables 1 to 10: Appendix A dataset.
Should I look at monthly or financial year-to-date data to understand public sector finances?
A financial year is an accounting period of 12 months running from 1 April one year to 31 March the following year. For example, the financial year ending March 2016 comprises the months from April 2015 to March 2016.
Due to the volatility of the monthly data, the cumulative financial year-to-date borrowing figures provide a better indication of the position of the public finances than the individual months.
Are our figures adjusted for inflation?
All monetary values in the public sector finances (PSF) bulletin are expressed in terms of “current prices‟, that is, they represent the price in the period to which the expenditure or revenue relates and are not adjusted for inflation.
In order to compare data over long time periods, to aid international comparisons and provide an indication of a country’s ability to service borrowing and debt, commentators often discuss changes over time to fiscal aggregates in terms of gross domestic product (GDP) ratios. GDP represents the value of all the goods and services currently produced by the UK economy in a period of time.
Are our figures adjusted for seasonal patterns?
All monetary values in the PSF bulletin are not seasonally adjusted. We recommend you use year-on-year comparisons (be it cumulative financial year-to-date or individual monthly borrowing figures) rather than making month-on-month comparisons.
Are our monthly figures likely to change over time?
Each PSF bulletin contains the first estimate of public sector borrowing for the most recent period and is likely to be revised in later months as more data become available.
In publishing monthly estimates, it is necessary to use a range of different types of data sources. Some of these are subject to revision as budget estimates (forecasts) are replaced by out-turn data and these then feed into the published aggregates.
In addition to those that stem from updated data sources, revisions can also result from methodology changes. An example of the latter is the changes that were due to the introduction of improved methodology for the recording of Corporation Tax, Bank Corporation Tax Surcharge receipts and Bank Levy implemented in the PSF estimates released in February 2017.
How is the debt interest paid by the government affected by movements in the level of RPI?
Index-linked gilts, a form of government bond, are indexed to the Retail Prices Index (RPI). When the RPI rises, the inflation uplift that applies to index-linked cash flows (both regular coupon payments and final payment at gilt maturity) also rises. If the RPI should fall, the inflation uplift would also fall. In this way, the returns to the investor from holding index-linked gilts are maintained in real terms – as measured by the RPI.
Taking £100 as the unit price for a gilt, an index-linked gilt will pay more than £100 at redemption if the RPI increases over the life of the gilt. Similarly, if the RPI increases over the life of the gilt each coupon payment will be higher than the previous one; while if the RPI were to decrease, a coupon payment could be lower than the previous one.
Both the uplift on coupon payments and the uplift on the redemption value are recorded as debt interest paid by the government, so month-on-month there can be sizeable movements in payable government debt interest as a result of movements in the RPI.
Nôl i'r tabl cynnwys4. How much is the public sector borrowing?
In the current financial year-to date (April 2017 to September 2017), the public sector spent more money than it received in taxes and other income. This meant it had to borrow £32.5 billion; that is £2.5 billion less than in the same period in the previous financial year.
Of this £32.5 billion of public sector net borrowing excluding public sector banks (PSNB ex), £16.4 billion related to the cost of the “day-to-day” activities of the public sector (the current budget deficit), while £16.1 billion related to capital spending (or net investment) such as infrastructure.
Figure 1 presents both monthly and cumulative public sector net borrowing (excluding public sector banks) in the current financial year-to-date and compares these with the previous financial year.
Figure 1: Public sector net borrowing (excluding public sector banks) in the current financial year-to-date (April to September 2017) compared with the latest full financial year (April 2016 to March 2017), UK
Source: Office for National Statistics
Download this chart Figure 1: Public sector net borrowing (excluding public sector banks) in the current financial year-to-date (April to September 2017) compared with the latest full financial year (April 2016 to March 2017), UK
Image .csv .xlsThe difference between central government's income and spending makes the largest contribution to the amount borrowed by the public sector. In the current financial year-to-date, of the £32.5 billion borrowed by the public sector, £34.7 billion was borrowed by central government, while local government net borrowing was in surplus by £2.6 billion.
In the current financial year-to-date, central government received £334.5 billion in income; including £250.5 billion in taxes. This was around 4% more than in the same period in the previous financial year.
Over the same period, central government spent £360.0 billion; around 3% more than in the same period in the previous financial year. Of this amount, just below two-thirds was spent by central government departments (such as health, education and defence), around one-third on social benefits (such as pensions, unemployment payments, Child Benefit and Maternity Pay), with the remaining being spent on capital investment and interest on government’s outstanding debt.
Appendix D to this release contains a detailed breakdown of public sector current receipts.
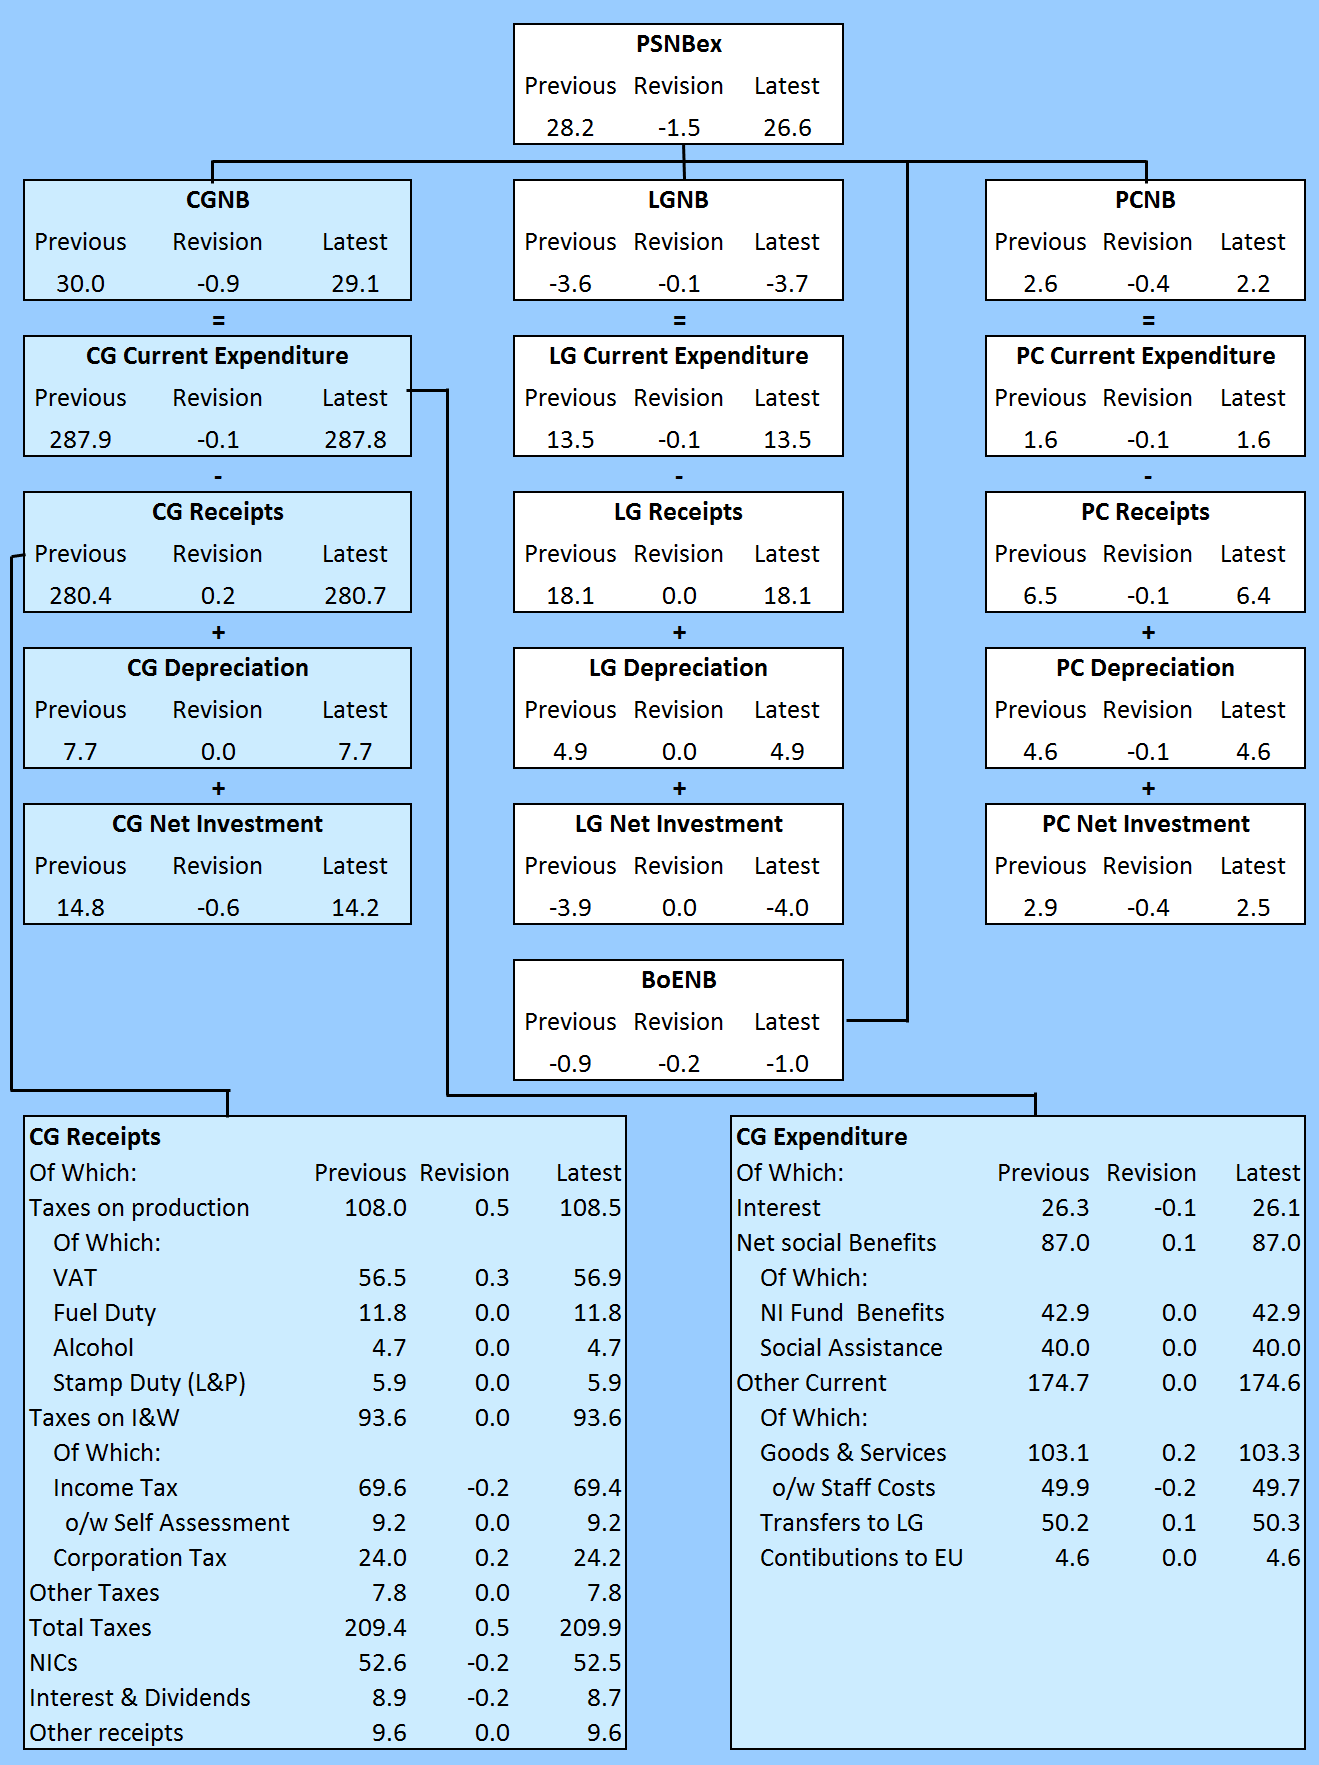
Figure 2 summarises public sector borrowing by sub-sector in the current financial year-to-date (April to September 2017) and compares these with the same period in the previous financial year.
This presentation splits PSNB ex into each of its four sub-sectors: central government, local government, public corporations and Bank of England.
A further breakdown (receipts, expenditure (both current and capital) and depreciation) is provided for central government, local government and public corporations; with central government current receipts and current expenditure being presented in further detail.
Figure 2: Contributions to public sector net borrowing (excluding public sector banks) by sub-sector in the current financial year-to-date (April to September 2017), UK
£ billion

Source: Office for National Statistics
Notes:
- PSNBex - Public sector net borrowing excluding public sector banks.
- CGNB - Central government net borrowing.
- LGNB - Local government net borrowing.
- PCNB - Non-financial public corporations' net borrowing.
- BoENB - Bank of England net borrowing.
- L&P - Land and property.
- I&W - Income and wealth.
- NICs - National Insurance contributions.
- Contributions to EU - UK VAT, GNI and abatement contributions to the EU budget.
Download this image Figure 2: Contributions to public sector net borrowing (excluding public sector banks) by sub-sector in the current financial year-to-date (April to September 2017), UK
.png (90.4 kB) .xls (67.6 kB)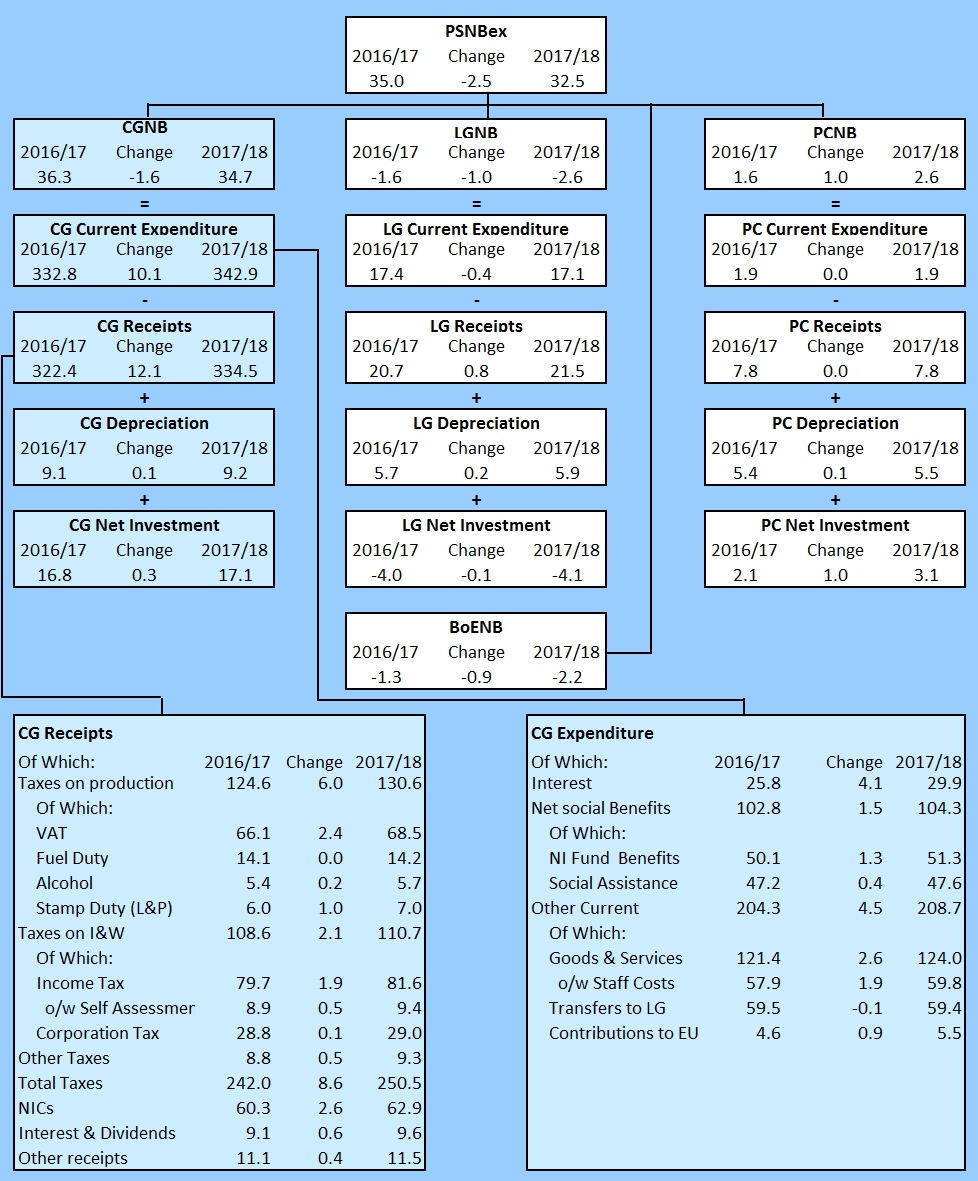
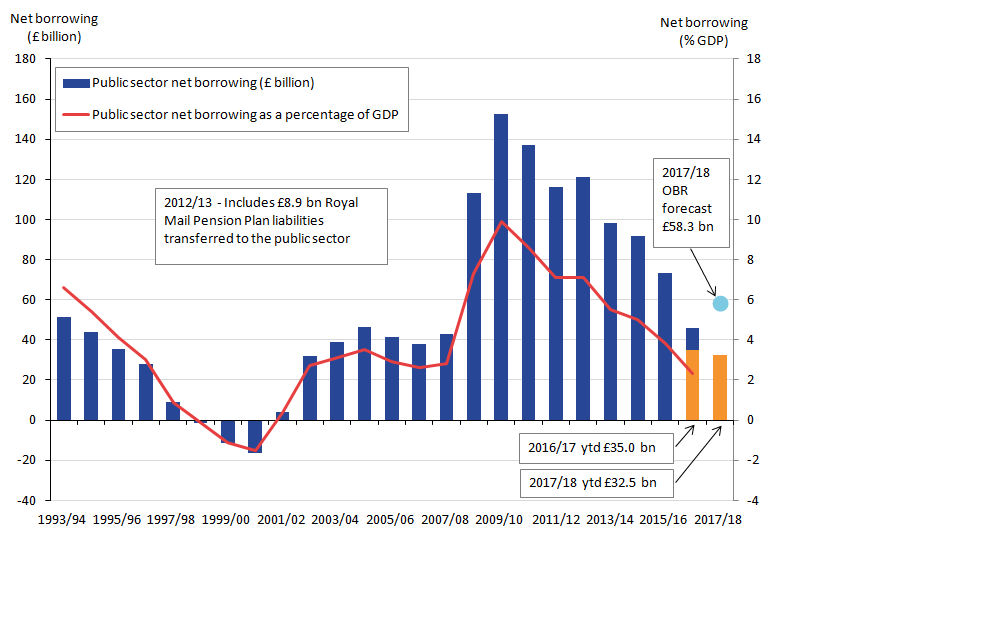
Figure 3 illustrates that annual borrowing has generally been falling since the peak in the financial year ending March 2010 (April 2009 to March 2010).
In the financial year ending March 2017 (April 2016 to March 2017), the public sector borrowed £45.7 billion, or 2.3% of gross domestic product (GDP). This was £27.5 billion lower than in the previous full financial year and around one-third of that borrowed in the financial year ending March 2010, when borrowing was £152.5 billion or 9.9% of GDP.
Figure 3: Public sector net borrowing (excluding public sector banks), April 1993 to September 2017, UK
Source: Office for National Statistics
Notes:
- Financial year 2017/18 represents the financial year ending 2018 (April 2017 to March 2018).
- Office for Budget Responsibility (OBR) full financial year forecast of £58.3 billion for public sector net borrowing excluding public sector banks (March 2017 Economic and Fiscal Outlook).
- Ytd equals year-to-date (April to September).
Download this image Figure 3: Public sector net borrowing (excluding public sector banks), April 1993 to September 2017, UK
.png (41.9 kB) .xls (65.0 kB)
Since the first estimate of public sector net borrowing (excluding public sector banks) for the financial year ending March 2017 (April 2016 to March 2017) was published on 25 April 2017, the estimate has been revised downwards by £6.3 billion, from £52.0 billion to £45.7 billion. However, these are not final figures and may be revised further over the coming months as we replace our provisional estimates with final out-turn data.
Currently, for the financial year ending March 2017:
- central government net borrowing comprises of largely audited account data
- Local government data are based on budget figures published by the Department for Communities and Local Government (DCLG) and the devolved administrations
- public corporations’ net borrowing estimates remain calculated by Office for National Statistics (ONS) and are based on Office for Budget Responsibility (OBR) forecasts
The data for the latest month of every release contain some forecast data. The initial out-turn estimates for the early months of the financial year, particularly April, contain more forecast data than other months, as profiles of tax receipts, along with departmental and local government spending are still provisional. This means that the data for these months are typically more prone to revision than other months and can be subject to sizeable revisions in later months.
Appendix G: Revisions to the first reported estimate of financial-year-end public sector net borrowing (excluding public sector banks) by sub-sector; summarises revisions to the first estimate of public sector net borrowing (excluding public sector banks) by sub-sector for the last six financial years. Revisions are shown at 6 and 12 months after year end.
We have published an article, Public Sector Finances – Sources summary and their timing, which provides a brief summary of the different sources used and the implications of using those data in the monthly public sector finances (PSF) statistical bulletin.
Focusing on the current month
In September 2017, the public sector spent more money than it received in taxes and other income. This meant it had to borrow £5.9 billion; that is £0.7 billion less borrowing than in September 2016.
Appendix D to this release contains a detailed breakdown of public sector current receipts.
Figure 4 summarises public sector borrowing by sub-sector in September 2017 and compares this with the equivalent measures in the same month a year earlier (September 2016).
This presentation splits public sector net borrowing excluding public sector banks (PSNB ex) into each of its four sub-sectors: central government, local government, public corporations and Bank of England.
A further breakdown (receipts, current expenditure, capital expenditure and depreciation) is provided for central government, local government and public corporations; with central government current receipts and current expenditure being presented in further detail.
Both local government and public corporations data for September 2017 are provisional estimates.
While some components of local government net borrowing are still based on Office for Budget Responsibility (OBR) forecasts, principally these have now been replaced with budget data received from the Department for Communities and Local Government (DCLG) and the devolved administrations.
Components of public corporations’ net borrowing remain calculated by Office for National Statistics (ONS) and are based on OBR forecasts.
For both local government and public corporations, administrative source data are used for transfers to each of these sectors from central government.
Figure 4: Contributions to public sector net borrowing (excluding public sector banks) by sub-sector in September 2017, compared with September 2016, UK
£ billion

Source: Office for National Statistics
Notes:
- PSNBex - Public sector net borrowing excluding public sector banks.
- CGNB - Central government net borrowing.
- LGNB - Local government net borrowing.
- PCNB - Non-financial public corporations' net borrowing.
- BoENB - Bank of England net borrowing.
- L&P - Land and property.
- I&W - Income and wealth.
- NICs - National Insurance contributions.
- Contributions to EU - UK VAT, GNI and abatement contributions to the EU budget.
Download this image Figure 4: Contributions to public sector net borrowing (excluding public sector banks) by sub-sector in September 2017, compared with September 2016, UK
.png (105.3 kB) .xls (67.6 kB)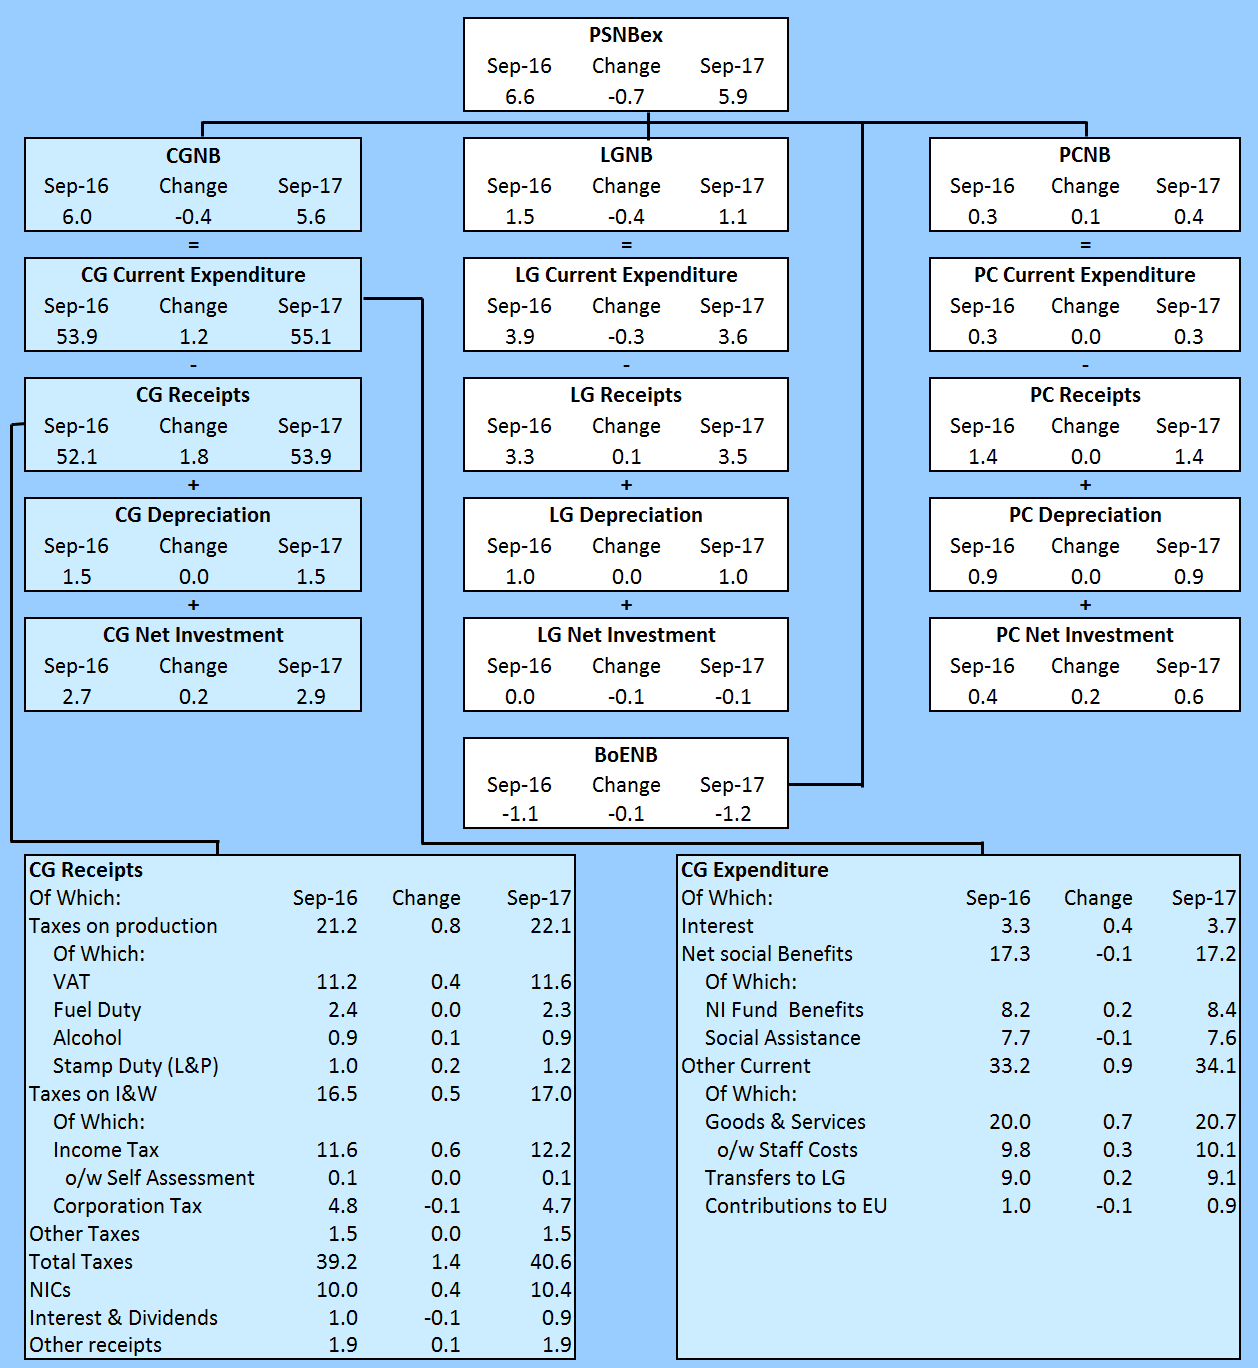
5. How big is public sector debt?
The amount of money owed by the public sector to the private sector stood at nearly £1.8 trillion at the end of September 2017, which equates to 87.2% of the value of all the goods and services currently produced by the UK economy in a year (or gross domestic product (GDP)).
This £1.8 trillion (or £1,785.3 billion) debt at the end of September 2017 represents an increase of £145.2 billion since the end of September 2016. Of this £145.2 billion, £100.3 billion is attributable to debt accumulated within the Bank of England, nearly all of it in the Asset Purchase Facility; including £84.6 billion from the Term Funding Scheme (TFS).
If we were to exclude the activities of the Bank of England in the estimation of public sector net debt (excluding both public sector banks), then public sector net debt (excluding both public sector banks and Bank of England) would reduce by £147.5 billion, from £1,785.3 billion to £1,637.8 billion, or from 87.2% of GDP to 80.0%.
Figure 5 breaks down outstanding public sector net debt at the end of September 2017 into the sub-sectors of the public sector. In addition to public sector net debt excluding public sector banks (PSND ex), this presentation includes the effect of public sector banks on debt.
Figure 5: Contributions to public sector net debt by sub-sector at the end of September 2017, UK
Source: Office for National Statistics
Notes:
- PSND - Public sector net debt.
- PSBsND - Public sector Banks net debt.
- PSNDex - Public sector net debt excluding public sector banks.
- BoEND - Bank of England's contribution to net debt.
- PSND ex Boe - Public sector net debt excluding both public sector banks and Bank of England.
- NFPCND - Non-financial public corporations' net debt.
- GGND - General government net debt.
Download this chart Figure 5: Contributions to public sector net debt by sub-sector at the end of September 2017, UK
Image .csv .xlsNet debt is defined as total gross financial liabilities less liquid financial assets, where liquid assets are cash and short-term assets, which can be released for cash at short notice without significant loss. These liquid assets mainly comprise foreign exchange reserves and bank deposits.
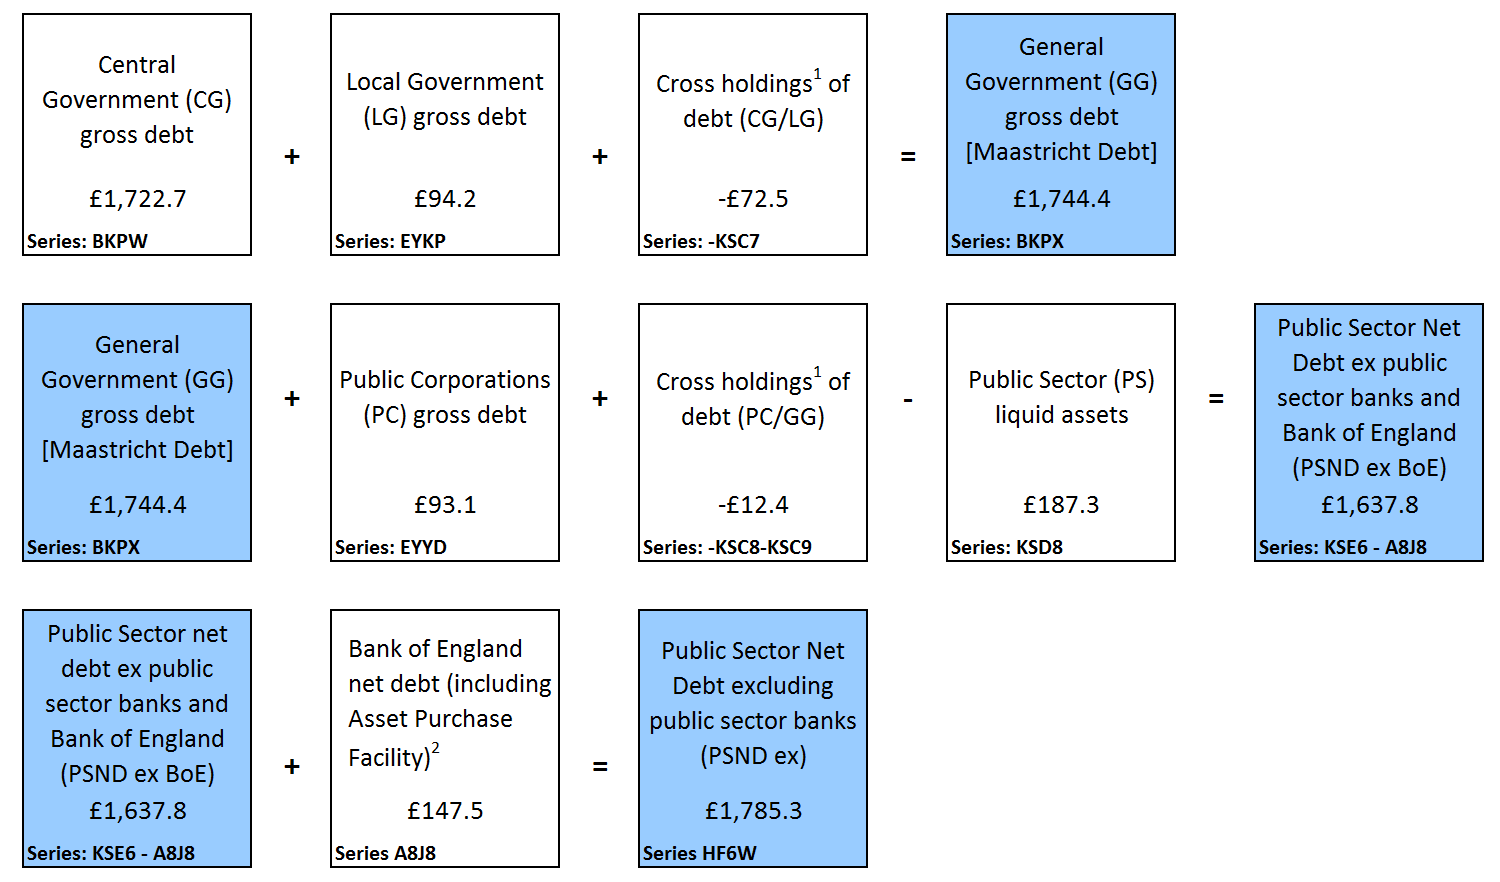
Figure 6 presents public sector net debt excluding public sector banks (PSND ex) at the end of September 2017 by sub-sector. Time series for each of these component series are presented in Tables PSA8A to D in the Public sector finances Tables 1 to 10: Appendix A dataset.
Figure 6: Contributions to public sector net debt (excluding public sector banks) by sub-sector at the end of September 2017 (£ billion), UK
£ billion
Source: Office for National Statistics
Notes:
- Cross-holdings between sub-sectors are removed in calculating public sector net debt, gross debt and liquid assets.
- APF - Bank of England Asset Purchase Facility.
Download this image Figure 6: Contributions to public sector net debt (excluding public sector banks) by sub-sector at the end of September 2017 (£ billion), UK
.png (82.6 kB) .xls (166.4 kB)
Figure 7 illustrates PSND ex from the financial year ending March 1994 to the end of September 2017.
Figure 7: Public sector net debt (excluding public sector banks), March 1994 to the end of September 2017, UK

Source: Office for National Statistics
Notes:
- Includes Asset Purchase Facility (APF), which includes the Term Funding Scheme (TFS).
- Public sector net debt excluding public sector banks (PSND ex) is the combination of PSND ex less Bank of England (BoE) plus BoE contribution to PSND ex.
Download this image Figure 7: Public sector net debt (excluding public sector banks), March 1994 to the end of September 2017, UK
.png (42.8 kB) .xls (47.1 kB)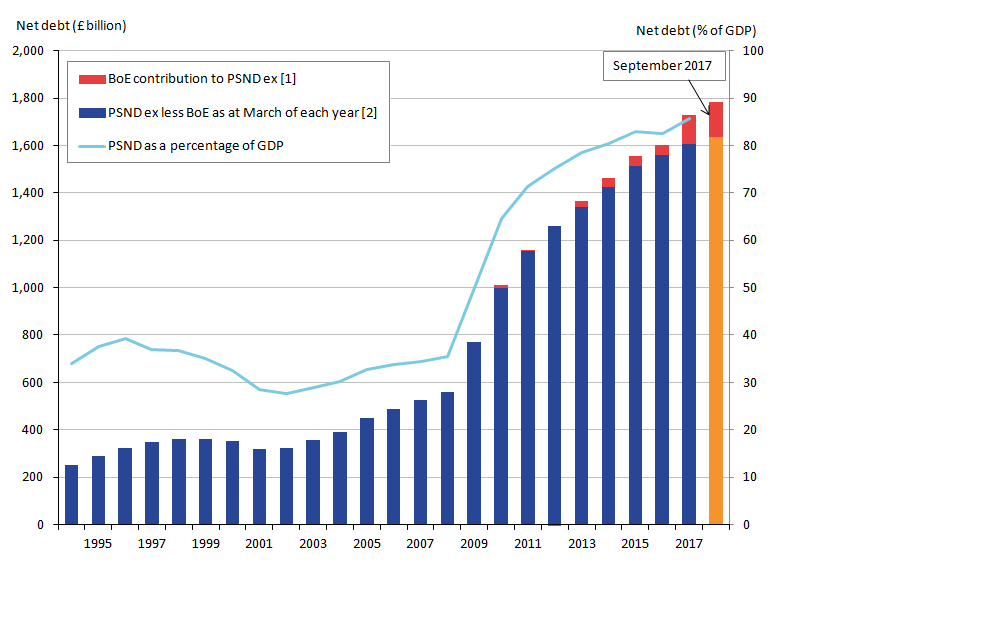
PSND ex increased at the time of the economic downturn. Since then, it has continued to increase but at a slower rate. The introduction of the Term Funding Scheme in late 2016 has led to a rise in net debt, as the loans provided under the scheme are not liquid assets and therefore do not net off in public sector net debt (against the liabilities incurred in providing the loans).
Nôl i'r tabl cynnwys6. How much cash does the public sector need to raise?
The net cash requirement is a measure of how much cash the public sector needs to raise from the financial markets (or pay out from its cash reserves) to finance its activities. This amount can be close to net borrowing for the same period but there are some transactions, for example, lending to the private sector or the purchase of shares, that need to be financed but do not contribute to net borrowing. Similarly, repayments of principal on loans extended by government or sales of shares will reduce the level of financing necessary but not reduce the net borrowing.
Figure 8 presents public sector cash requirement by sub-sector in the current financial year-to-date (April 2017 to September 2017). Time series for each of these component series are presented in Table PSA7A in the Public sector finances Tables 1 to 10: Appendix A dataset.
Figure 8: Contributions to public sector net cash requirement (excluding public sector banks) by sub-sector in the current financial year-to-date (April to September 2017) (£ billion), UK

Source: Office for National Statistics
Notes:
- Effects of cash transactions between sub-sectors are removed in calculating public sector total net cash requirement (and consolidated expenditure and income totals).
- APF - Bank of England Asset Purchase Facility.
Download this image Figure 8: Contributions to public sector net cash requirement (excluding public sector banks) by sub-sector in the current financial year-to-date (April to September 2017) (£ billion), UK
.png (51.5 kB) .xls (152.1 kB)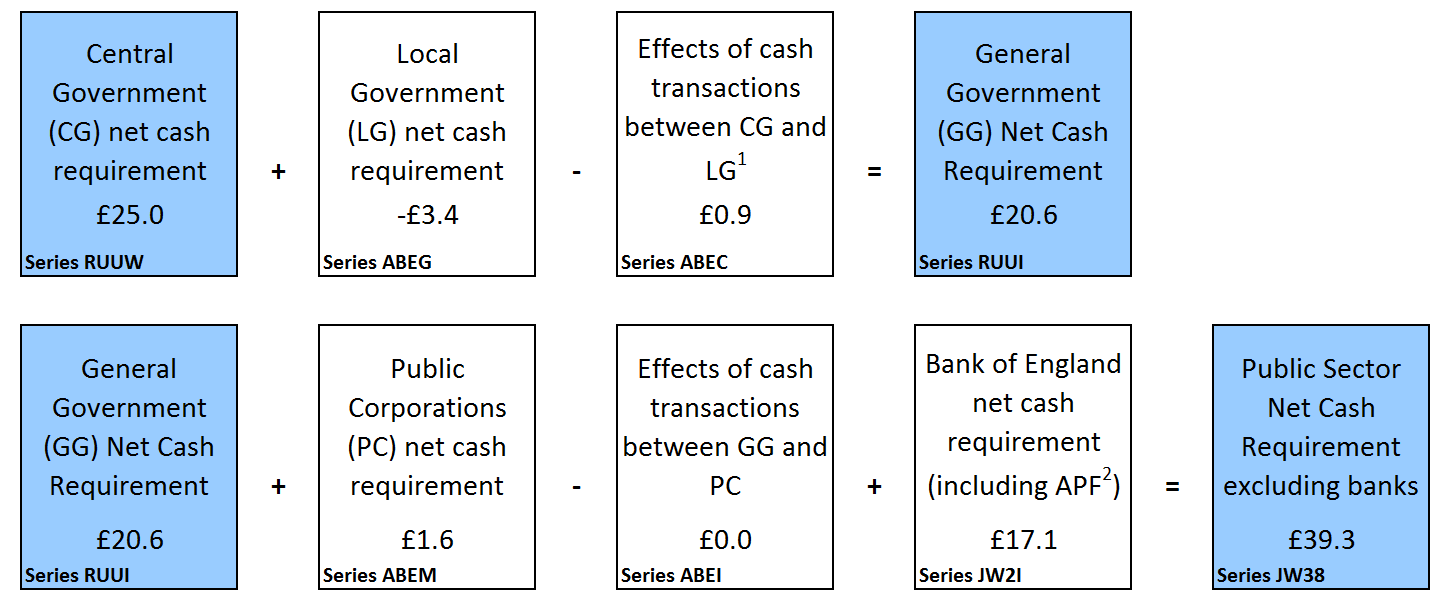
Central government net cash requirement (CGNCR) is a focus for some users, as it provides an indication of the volume of gilts (government bonds) the Debt Management Office may issue to meet the government’s borrowing requirements.
In the current financial year-to-date (April to September 2017), central government net cash requirement (CGNCR) was £25.0 billion, that is, £30.8 billion less than in the same period in the previous year. A number of one-off factors have led to this decrease, notably:
- the sale of £11.8 billion of Bradford and Bingley loans to Prudential plc in April 2017, reducing CGNCR by a corresponding amount in the current financial year-to-date
- the redemption of a 2.5% index linked gilt in July 2016 required £9.4 billion to repay investors, increasing CGNCR by a corresponding amount in the previous financial year-to-date
CGNCR is quoted both including and excluding the net cash requirement of Network Rail (NR) and UK Asset Resolution LTD (UKAR) (which manages the closed mortgage books of both Bradford and Bingley, and Northern Rock Asset Management). It is the CGNCR excluding NR and UKAR that is the particular focus of users with an interest in the gilt market.
CGNCR excluding NR and UKAR decreased by £33.6 billion to £25.6 billion in the current financial year-to-date (April 2017 to September 2017), compared with the same period in 2016.
Nôl i'r tabl cynnwys7. How was debt in the current financial year-to-date accumulated?
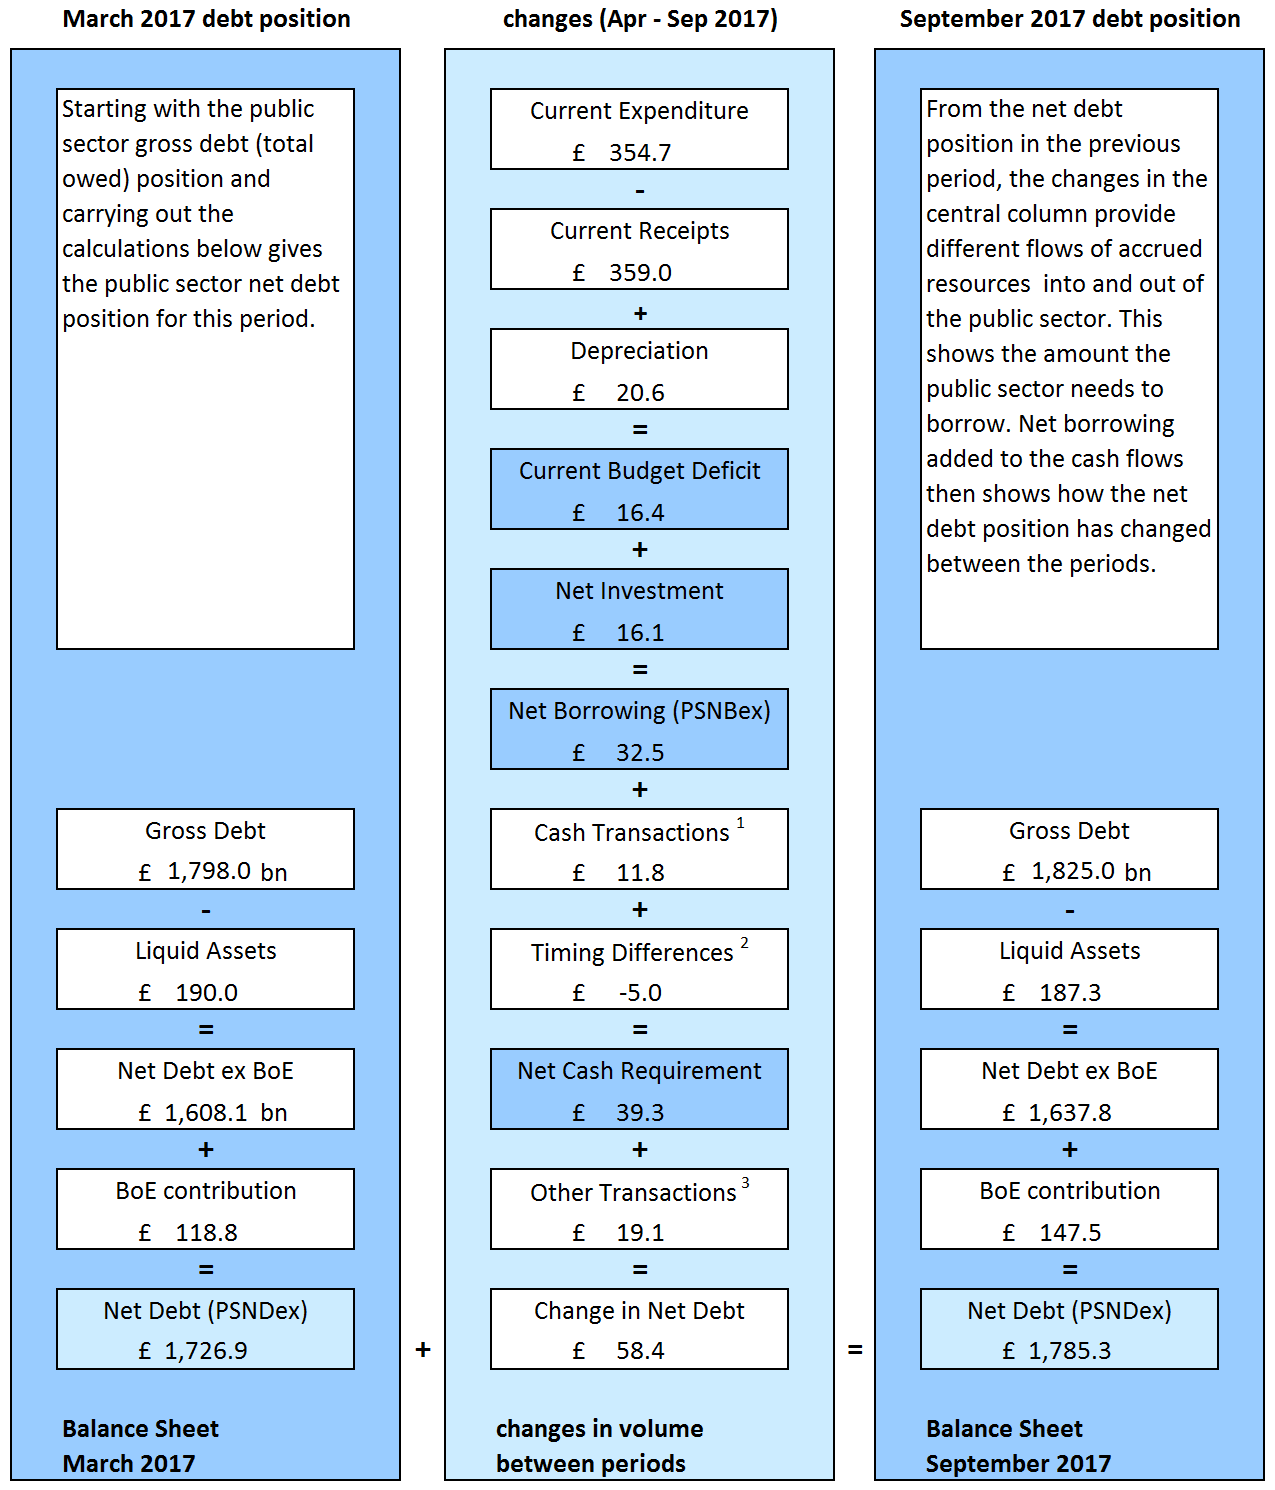
Figure 9 brings together the borrowing components detailed in Figure 2 to illustrate how the differences between income and spending (both current and capital) have led to the accumulation of debt in the current financial year-to-date (April to September 2017).
This presentation excludes public sector banks, focusing instead on the public sector net borrowing excluding public sector banks (PSNB ex) measure.
Figure 9: How the difference in expenditure and receipts affect public sector net debt (excluding public sector banks), UK
£ billion
Source: Office for National Statistics
Notes:
- Cash transactions in (non-financing) financial assets, which do not impact on net borrowing.
- Timing differences between cash and accrued data.
- Revaluation of foreign currency debt (for example, foreign currency). Debt issuances or redemptions above or below debt valuation (for example, bond premia and discounts and capital uplifts). Changes in volume of debt not due to transactions (for example, sector reclassification).
Download this image Figure 9: How the difference in expenditure and receipts affect public sector net debt (excluding public sector banks), UK
.png (95.3 kB) .xls (42.5 kB)
The reconciliation between public sector net borrowing and net cash requirement is presented in more detail in Table REC1 in the Public sector finances Tables 1 to 10: Appendix A dataset.
Nôl i'r tabl cynnwys8. How do these figures compare with official forecasts?
The Office for Budget Responsibility (OBR) normally produces forecasts of the public finances twice a year (currently in March and November). The latest OBR forecast was published on 8 March 2017.
The government has adopted OBR forecasts as its official forecast.
OBR forecast that the public sector would borrow £51.7 billion during the financial year ending March 2017, a reduction of £21.5 billion on out-turn for the financial year ending March 2016. The latest out-turn estimate for the financial year ending March 2017 was £45.7 billion; that is £6.0 billion less than the OBR forecast.
OBR forecast that the public sector will borrow £58.3 billion during the current financial year (April 2017 to March 2018); an increase of £12.6 billion on the current out-turn estimate for the financial year ending March 2017. In the current financial year-to-date (April to September 2017), the public sector has borrowed £32.5 billion; a decrease of £2.5 billion on the same period in the last financial year.
Figure 10 presents the cumulative public sector net borrowing for the latest and previous full financial years. The figure also presents the OBR forecasts for the corresponding financial years.
Figure 10: Public sector net borrowing (excluding public sector banks) in the current financial year-to-date (April to September 2017) compared with the latest full financial year (April 2016 to March 2017), UK

Source: Office for National Statistics
Notes:
- For the financial year ending 2017 (April 2016 to March 2017).
- For the financial year-to-date ending 2018 (April to September 2017).
- OBR forecast for public sector net borrowing excluding public sector banks from March 2017 Economic and Fiscal Outlook (EFO).
Download this image Figure 10: Public sector net borrowing (excluding public sector banks) in the current financial year-to-date (April to September 2017) compared with the latest full financial year (April 2016 to March 2017), UK
.png (22.3 kB) .xls (171.5 kB)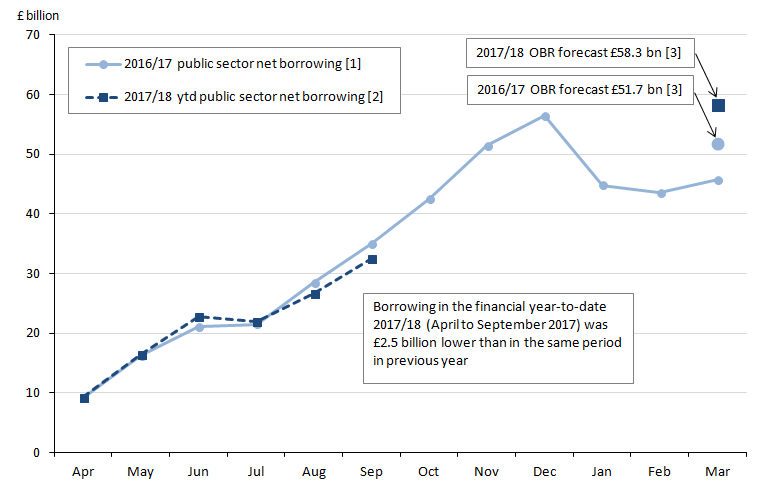
Table 1 compares the first estimates of full financial year data against the OBR forecasts. Caution should be taken when comparing public sector finances data with OBR figures for the full financial year, as data are not finalised until after the financial year ends.
Initial estimates soon after the end of the financial year can be subject to sizeable revisions in later months.
In addition, the monthly path of spending and receipts is not smooth within the year and also can vary compared with previous years, both of which can affect year-on-year comparisons.
There can also be methodological differences between OBR forecasts and out-turn data. In its latest publication, OBR published a table within its Economic and fiscal outlook supplementary fiscal tables: receipts and other – March 2017 titled “Table 2.46: Items included in OBR forecasts that ONS have not yet included in out-turn”.
Table 1: Latest out-turn estimates compared with Office for Budget Responsibility (OBR) forecasts in the current financial year-to-date (April to September 2017) compared with the latest full financial year (April 2016 to March 2017), UK
| UK, excluding public sector banks | £ billion1 (not seasonally adjusted) | ||||||
| Financial year-to-date7 | Full financial year8 | ||||||
|---|---|---|---|---|---|---|---|
| 2016/17 | 2017/188 | % change | 2016/17 Outturn | 2017/18 OBR Forecast9 | % change | ||
| Current budget deficit2 | 20.1 | 16.4 | -18.6 | 7.0 | 18.2 | 159.6 | |
| Net investment3 | 14.9 | 16.1 | 8.2 | 38.6 | 40.1 | 3.8 | |
| Net borrowing 4 | 35.0 | 32.5 | -7.2 | 45.7 | 58.3 | 27.5 | |
| Net debt 5 | 1,640.1 | 1,785.3 | 8.9 | 1,726.9 | 1,829.7 | 6.0 | |
| Net debt as a percentage of GDP6 | 82.8 | 87.2 | NA | 85.6 | 88.8 | NA | |
| Source: Office for National Statistics | |||||||
| Notes: | |||||||
| 1. Unless otherwise stated. | |||||||
| 2. Current budget deficit is the difference between current expenditure (including depreciation) and current receipts. | |||||||
| 3. Net investment is gross investment (net capital formation plus net capital transfers) less depreciation. | |||||||
| 4. Net borrowing is current budget deficit plus net investment. | |||||||
| 5. Net debt is financial liabilities (for loans, deposits, currency and debt securities) less liquid assets. | |||||||
| 6. GDP at current market price. | |||||||
| 7. Financial year-to-date refers to the period from April to September. | |||||||
| 8. 2017/18 refers to financial year ending in March 2018 and 2016/17 refers to financial year ending in March 2017. | |||||||
| 9. All OBR figures are from the OBR Economic and Fiscal Outlook published in March 2017. | |||||||
| 10. NA denotes "not applicable". | |||||||
Download this table Table 1: Latest out-turn estimates compared with Office for Budget Responsibility (OBR) forecasts in the current financial year-to-date (April to September 2017) compared with the latest full financial year (April 2016 to March 2017), UK
.xls (35.3 kB)OBR will publish an updated set of fiscal forecasts based on the government’s Autumn Budget on the 22 November 2017.
Nôl i'r tabl cynnwys9. Revisions since previous release
Revisions can be the result of both updated data sources and methodology changes. This month the reported revisions are solely the result of data changes.
Table 2 presents the revisions to the headline statistics presented in this bulletin compared with those presented in the previous publication (published on 21 September 2017).
Table 2: Revisions to main aggregates since the previous public sector finances bulletin (published 21 September 2017), UK
| UK, previous bulletin refers to the PSF bulletin published on 21 September 2017 | ||||||||
| £ billion1 (not seasonally adjusted) | ||||||||
| Net borrowing | ||||||||
|---|---|---|---|---|---|---|---|---|
| Period | CG2 | LG3 | NFPCs4 | BoE5 | PSNB ex6 | PSND ex7 | PSND % of GDP | PSNCR ex8 |
| 1997/98 | 0.0 | 0.0 | 0.0 | 0.0 | 0.0 | 0.0 | -0.4 | 0.0 |
| 1998/99 | 0.0 | 0.0 | 0.0 | 0.0 | 0.0 | 0.0 | -0.3 | 0.0 |
| 1999/00 | 0.0 | 0.0 | 0.0 | 0.0 | 0.0 | 0.0 | -0.2 | 0.0 |
| 2000/01 | 0.0 | 0.0 | 0.0 | 0.0 | 0.0 | 0.0 | -0.1 | 0.0 |
| 2001/02 | 0.0 | 0.0 | 0.0 | 0.0 | 0.0 | 0.0 | -0.2 | 0.0 |
| 2002/03 | 0.0 | 0.0 | 0.0 | 0.0 | 0.0 | 0.0 | -0.1 | 0.0 |
| 2003/04 | 0.0 | 0.0 | 0.0 | 0.0 | 0.0 | 0.0 | -0.1 | 0.0 |
| 2004/05 | 0.0 | 0.0 | 0.0 | 0.0 | 0.0 | 0.0 | -0.2 | 0.0 |
| 2005/06 | 0.0 | 0.0 | 0.0 | 0.0 | 0.0 | 0.0 | -0.2 | 0.0 |
| 2006/07 | 0.0 | 0.0 | 0.0 | 0.0 | 0.0 | 0.0 | -0.1 | 0.0 |
| 2007/08 | 0.0 | 0.0 | 0.0 | 0.0 | 0.0 | 0.0 | -0.1 | 0.0 |
| 2008/09 | 0.0 | 0.0 | 0.0 | 0.0 | 0.0 | 0.0 | -0.4 | 0.0 |
| 2009/10 | 0.0 | 0.0 | 0.0 | 0.0 | 0.0 | 0.0 | -0.3 | 0.0 |
| 2010/11 | 0.0 | 0.0 | 0.0 | 0.0 | 0.0 | 0.0 | -0.3 | 0.0 |
| 2011/12 | 0.0 | 0.0 | 0.0 | 0.0 | 0.0 | 0.0 | -0.4 | 0.0 |
| 2012/13 | 0.0 | 0.0 | 0.0 | 0.0 | 0.0 | 0.0 | -0.5 | 0.0 |
| 2013/14 | 0.0 | 0.0 | 0.0 | 0.0 | 0.0 | 0.0 | -0.7 | 0.0 |
| 2014/15 | 0.0 | 0.0 | 0.1 | 0.0 | 0.1 | 0.0 | -0.7 | 0.0 |
| 2015/16 | 0.1 | 0.0 | 0.0 | 0.0 | 0.1 | 0.0 | -0.9 | 0.0 |
| 2016/17 | 0.0 | 0.4 | 0.3 | 0.0 | 0.6 | 0.2 | -1.2 | 0.3 |
| 2017/18 ytd10 | -0.9 | -0.1 | -0.4 | -0.2 | -1.5 | -6.9 | -1.5 | 0.0 |
| 2017 April | 0.1 | 0.0 | 0.0 | -0.1 | -0.1 | 0.2 | -1.1 | -0.1 |
| 2017 May | -0.2 | 0.0 | 0.0 | 0.0 | -0.2 | 0.1 | -1.1 | -0.1 |
| 2017 June | 0.0 | 0.0 | 0.0 | 0.0 | -0.1 | -0.1 | -1.1 | -0.1 |
| 2017 July | 0.0 | 0.0 | -0.2 | 0.0 | -0.2 | 0.0 | -1.2 | 0.0 |
| 2017 August | -0.8 | 0.0 | -0.1 | 0.0 | -1.0 | -6.9 | -1.5 | 0.3 |
| Source: Office for National Statistics | ||||||||
| Notes: | ||||||||
| 1. Unless otherwise stated. | ||||||||
| 2. Central government. | ||||||||
| 3. Local government. | ||||||||
| 4. Non-financial public corporations. | ||||||||
| 5. Bank of England. | ||||||||
| 6. Public sector net borrowing excluding public sector banks. | ||||||||
| 7. Public sector net debt excluding public sector banks. | ||||||||
| 8. Public sector net cash requirement excluding public sector banks. | ||||||||
| 9. 2016/17 represents financial year ending 2017 (April 2016 to March 2017). | ||||||||
| 10. Ytd equals year-to-date, April to August 2017. | ||||||||
Download this table Table 2: Revisions to main aggregates since the previous public sector finances bulletin (published 21 September 2017), UK
.xls (36.9 kB)Revisions to net borrowing in the current financial year
Figure 11 compares the latest estimate of public sector net borrowing excluding public sector banks (PSNB ex) for the period April to August 2017, with that presented in the previous bulletin (21 September 2017).
This presentation splits PSNB ex into each of its four sub-sectors: central government, local government, public corporations and Bank of England (BoE).
Given that, in the latest full financial year, £38.3 billion of the £45.7 billion borrowed by the public sector was borrowed by central government, a further breakdown of central government current receipts and current expenditure is presented to reflect the significance of these components.
Revisions to net borrowing in the previous financial years
While central government net borrowing in the financial year ending March 2017 remains largely unchanged since the previous bulletin (21 September 2017), estimates of local government and public corporations’ net borrowing have increased by £0.4 billion and £0.3 billion respectively.
Final capital outturn data for local authorities in England and in Wales covering the financial year ending March 2017 have been made available since our last publication. Further, quality assurance work has highlighted that we had not updated our estimate of Scottish local authorities’ capital receipts with the latest published data. These have all been incorporated in our latest dataset with the overall impact of these amendments being an increase in local government net borrowing of £0.4 billion.
The revisions to public corporations’ net borrowing in the financial year ending March 2017 are a combination of the incorporation of newly available gross fixed capital formation data and updated English Housing Associations data (based on Office for Budget Responsibility (OBR) estimates), both of which increased public corporations’ net borrowing by £0.1 billion each.
Revisions to net debt
Public sector net debt excluding public sector banks (PSND ex) at the end of September 2017, has been revised downwards by £6.9 billion compared with that presented in the previous bulletin (21 September 2017), though this revision has little affect on the net debt position at the end of September 2017.
This change is largely the result of a revision of £7.2 billion to the estimate of the Bank of England’s contribution to net debt at the end of August 2017, due to a change in the timing of the recording of cash transactions within the Asset Purchase Facility fund. Previously these transactions were recorded as split between both August and September 2017, this has now been revised to record the entire transaction in September, meaning that the net debt position at the end of September 2017 is unaffected by this change.
Gross domestic product
On the 29 September 2017, we published the Quarterly national accounts: April to June 2017. These re-stated estimates of gross domestic product (GDP) have been incorporated into this release resulting in historic revisions to all aggregates presented as a proportion of GDP.
Figure 11: Latest estimate of public sector net borrowing (excluding public sector banks) over the period April to August 2017, compared with that presented in the previous bulletin (21 September 2017), UK
£ billion
Source: Office for National Statistics
Notes:
- PSNBex - Public sector net borrowing excluding public sector banks.
- CGNB - Central government net borrowing.
- LGNB - Local government net borrowing.
- PCNB - Non-financial public corporations' net borrowing.
- BoENB - Bank of England net borrowing.
- L&P - Land and property.
- I&W - Income and wealth.
- NICs - National insurance contributions.
- Contributions to EU - UK VAT, GNI and abatement contributions to the EU budget.
Download this image Figure 11: Latest estimate of public sector net borrowing (excluding public sector banks) over the period April to August 2017, compared with that presented in the previous bulletin (21 September 2017), UK
.png (123.2 kB) .xls (68.6 kB)
The reporting of errors in the public sector finance dataset
It is important to note that revisions do not occur as a result of errors; errors lead to corrections and are identified as such when they occur. There are no errors reported in this month’s bulletin.
Nôl i'r tabl cynnwys10. International comparisons of borrowing and debt
The UK government debt and deficit for Eurostat statistical bulletin is published quarterly (in January, April, July and December each year), to coincide with when the UK and other EU member states are required to report on their deficit (or net borrowing) and debt to the European Commission.
On 17 October 2017, we published the latest UK government debt and deficit for Eurostat statistical bulletin, consistent with the August 2017 public sector finances bulletin (published on 21 September 2017). In this publication we stated that:
general government gross debt was £1,720.0 billion at the end of March 2017, equivalent to 86.8% of gross domestic product (GDP); an increase of £68.1 billion on March 2016
general government deficit (or net borrowing) was £45.5 billion in the financial year ending March 2017 (April 2016 to March 2017), equivalent to 2.3% of GDP; a decrease of £30.3 billion on March 2016
This bulletin reports a largely unchanged estimate of general government gross debt and deficit, compared with those published on 21 September 2017, with debt at the end of March 2017 remaining unchanged and deficit in the financial year ending March 2017 has been revised up by £0.4 billion to £45.9 billion.
It is important to note that the GDP measure, used as the denominator in the calculation of the debt ratios in the UK government debt and deficit for Eurostat statistical bulletin, differs from that used within the public sector finances statistical bulletin.
An article, The use of GDP in public sector fiscal ratio statistics, explains that for debt figures reported in the monthly public sector finances, a 12-month GDP total centred on the month is employed, while in the UK government debt and deficit for Eurostat statistical bulletin, the total GDP for the preceding 12 months is used.
Nôl i'r tabl cynnwys11. Quality and methodology
The public sector finances Quality and Methodology Information report contains important information on:
- the strengths and limitations of the data and how it compares with related data
- uses and users of the data
- how the output was created
- the quality of the output including the accuracy of the data
Immigration Skills Charge
In April 2017, the government introduced the Immigration Skills Charge, levied on employers of non-European Economic Area (EEA) migrants who apply under Tier 2 (General) or Tier 2 (Intra-company Transfer) for a visa to work in the UK. The levy has been set at £1,000 per employee per year, and a reduced rate of £364 for small or charitable organisations.
This charge affects employers across the public and private sectors, and has been classified by Office for National Statistics (ONS) as a tax on production collected by central government.
Any additional central government income has the effect of reducing central government net borrowing (CGNB) and subsequently public sector net borrowing (PSNB).
An exemption to the charge will mean that it won’t apply to PhD-level jobs and international students switching from student visas to working visas.
This tax will be included within public sector finances at the earliest opportunity.
UK Statistics Authority assessment of public sector finances
On 20 June 2017, the UK Statistics Authority published a letter confirming the designation of the monthly public sector finances bulletin as a National Statistic. This letter completes the 2015 assessment of public sector finances.
In order to meet the requirements of this assessment we published an article, Quality assurance of administrative data used in the UK public sector finances. This report provides an assessment of the administrative data sources used in the compilation of the public sector finances statistics in accordance with the UK Statistics Authority’s Administrative Data Quality Assurance Toolkit.
How classification decisions are made?
Each quarter we publish a forward workplan outlining the classification assessments we expect to undertake over the coming 12 months. To supplement this, each month a classifications update is published, which announces classification decisions made and includes expected implementation points (for different statistics) where possible.
Classification decisions are reflected in the public sector finances at the first available opportunity and, where necessary, outlined in this section of the statistical bulletin.
The Monthly statistics on the public sector finances: a methodological guide was last updated in August 2012. We are currently working to update this publication in 2017.
Pre-release access to ONS statistics
On 15 June 2017, the National Statistician announced that from 1 July 2017 pre-release access to Office for National Statistics (ONS) statistics would cease. While there is no longer any pre-release access granted to the public sector finances bulletin, it should be noted that this bulletin remains jointly produced by members of the Government Statistical Service (GSS) working in both ONS and HM Treasury.
GSS staff will continue to work together to produce the bulletin but ministers and those officials not directly involved in the production and release of statistics will not have access to them in advance of publication.
Time series data
We recently reviewed and improved the content of our downloadable time series data file consistent with the data underlying each public sector finance statistical bulletin and the accompanying public sector finances borrowing by sub-sector presentation.
All data contained within these publications are available to download via the Public sector finances time series dataset. From April 1997 to date, where available, time series are presented as monthly data; with series extending further back in time, generally presented on a quarterly or financial year basis.
Time series exclusive to the public sector finances borrowing by sub-sector presentation are only available as quarterly time series, though these extend back to 1946.
Supporting documentation
Documentation supporting this publication is available in appendices to the bulletin.
- Public sector finances Tables 1 to 10 – Appendix A
- Large impacts on public sector fiscal measures excluding financial intervention (one-off events) – Appendix B
- Revisions analysis on several main components of the central government account (current receipts, current expenditure, net borrowing and net cash requirement) – Appendix C
- Public sector current receipts table – Appendix D
- Impact of the reclassification of housing associations into the public sector: the financial year ending March 2009 to the financial year ending March 2017 - Appendix E
- Supplementary fiscal measures – Appendix F
- Revisions to the first reported estimate of financial-year-end public sector net borrowing (excluding public sector banks) by sub-sector – Appendix G
Public sector borrowing by sub-sector
Each month, at 9.30am on the working day following the public sector finances statistical bulletin, we publish Public sector finances borrowing by sub-sector.This release contains an extended breakdown of public sector borrowing in a matrix format and also estimates of Total Managed Expenditure (TME).
Nôl i'r tabl cynnwys