Cynnwys
- Main points
- The impact of the coronavirus on the public finances
- Government measures to address the impact of the coronavirus pandemic
- Borrowing in May 2020
- Central government net cash requirement
- Debt
- Revisions
- Public sector finances data
- Glossary
- Measuring the data
- Strengths and limitations
- Related links
1. Main points
Debt (public sector net debt excluding public sector banks, PSND ex) at the end of May 2020 was 100.9% of gross domestic product (GDP), the first time that debt as a percentage of GDP has exceeded 100% since the financial year ending March 1963.
Debt (PSND ex) at the end of May 2020 was £1,950.1 billion, an increase of £173.2 billion (or 20.5 percentage points) compared with May 2019, the largest year-on-year increase in debt as a percentage of GDP on record (monthly records began in March 1993).
Central government net cash requirement (excluding UK Asset Resolution Ltd, Network Rail and the COVID Corporate Financing Facility) in May 2020 was £62.7 billion, £46.1 billion more than in May 2019, the highest cash requirement in any May on record (records began in 1984).
Central government net cash requirement in the current financial year-to-date (April to May 2020) was £126.2 billion, £119.4 billion more than in the same period last year; the highest cash requirement in any April to May period on record (records began in 1984).
Borrowing (public sector net borrowing excluding public sector banks, PSNB ex) in May 2020 is estimated to have been £55.2 billion, roughly nine times (or £49.6 billion) more than in May 2019, the highest borrowing in any month on record (records began in 1993).
Borrowing in the current financial year-to-date (April to May 2020) is estimated to have been £103.7 billion, £87.0 billion more than in the same period last year, the highest borrowing in any April to May period on record (records began in 1993).
Borrowing estimates are subject to greater than usual uncertainty; borrowing in April 2020 was revised down by £13.6 billion to £48.5 billion, largely because of stronger than previously estimated tax receipts and National Insurance contributions and lower expenditure than previously estimated associated with the Coronavirus Job Retention Scheme.
2. The impact of the coronavirus on the public finances
The coronavirus (COVID-19) pandemic has had an unprecedented impact on borrowing. The £55.2 billion borrowed by the public sector in May 2020 is the highest monthly total on record (records began in January 1993).
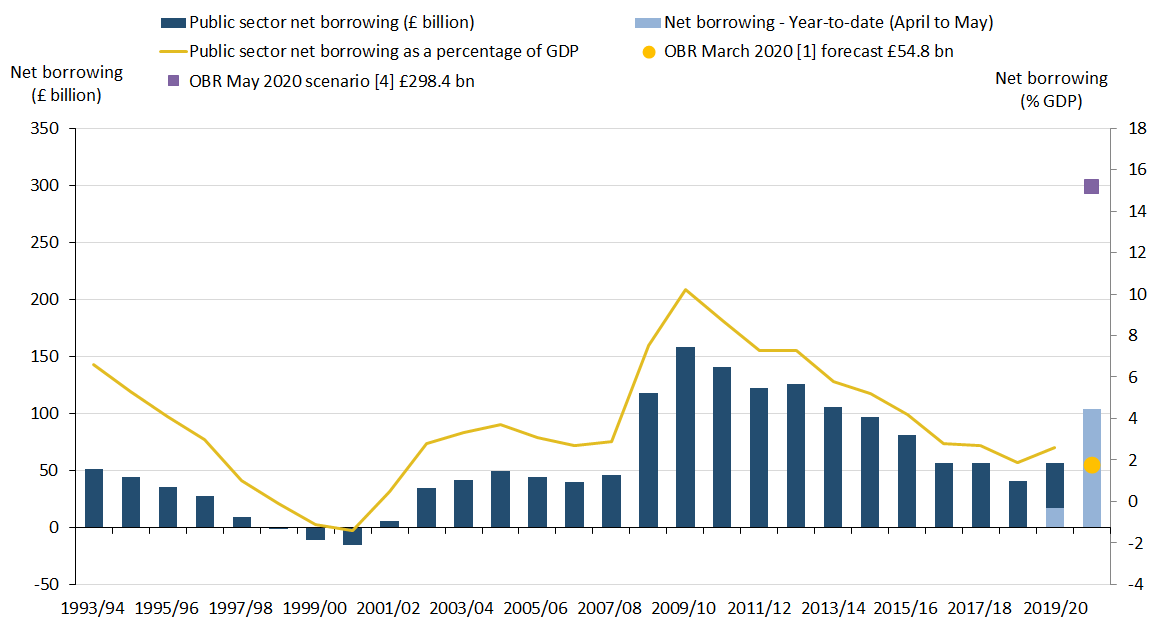
Latest published figures from the Office for Budget Responsibility's (OBR) coronavirus reference scenario suggest that borrowing in the current financial year (April 2020 to March 2021) could be £298.4 billion, around five times the amount borrowed in the latest full financial year (April 2019 to March 2020).
Figure 1: Latest published data from Office for Budget Responsibility1 suggests borrowing could increase to £298.4 billion for the financial year ending March 2021
Public sector net borrowing excluding public sector banks, UK, cumulative financial year-to-date (April to May 2020) compared with official borrowing estimates for the financial year ending March 2021 (April 2020 to March 2021)
Source: Office for National Statistics – Public Sector Finances
Notes:
- OBR Coronavirus Reference Scenario originally published 14 April 2020. This chart uses the updated fiscal data published 14 May 2020.
Download this chart Figure 1: Latest published data from Office for Budget Responsibility^1^ suggests borrowing could increase to £298.4 billion for the financial year ending March 2021
Image .csv .xlsAlthough the impact of the pandemic on the public finances is becoming clearer, its effects are not fully captured in this release, meaning that estimates of national accounts-based (accrued) tax receipts, borrowing and GDP in particular are subject to greater than usual uncertainty. Given this uncertainty, we place a greater emphasis than usual on our leading cash measure, the central government net cash requirement (CGNCR), the amount of cash needed immediately for the UK government to meet its obligations. See Section 5.
Nôl i'r tabl cynnwys4. Borrowing in May 2020
In May 2020, the public sector spent more money than it received in taxes and other income. Over this period, the public sector borrowed £55.2 billion, £49.6 billion more than it borrowed in May 2019. The substantial increases in borrowing in recent months reflect the emerging effects of government coronavirus (COVID-19) policies.
Figure 2: Borrowing in the current financial year-to-date is substantially higher than in the same period last year
Public sector net borrowing excluding public sector banks, UK, cumulative financial year-to-date (April to May 2020) compared with the financial year ending March 2020 (April 2019 to March 2020)
Source: Office for National Statistics – Public Sector Finances
Download this chart Figure 2: Borrowing in the current financial year-to-date is substantially higher than in the same period last year
Image .csv .xlsEstimates of accrued receipts, expenditure and borrowing for the latest month of every release contain some forecast data. The initial outturn estimates for the early months of the financial year also contain more forecast data than other months, as profiles of tax receipts, along with departmental and local government spending are still provisional. The degree of provisionality has been amplified by the uncertainty of the full impact of the coronavirus, meaning that the data for these months are even more prone to revision than other months and can be subject to sizeable revisions in later months.
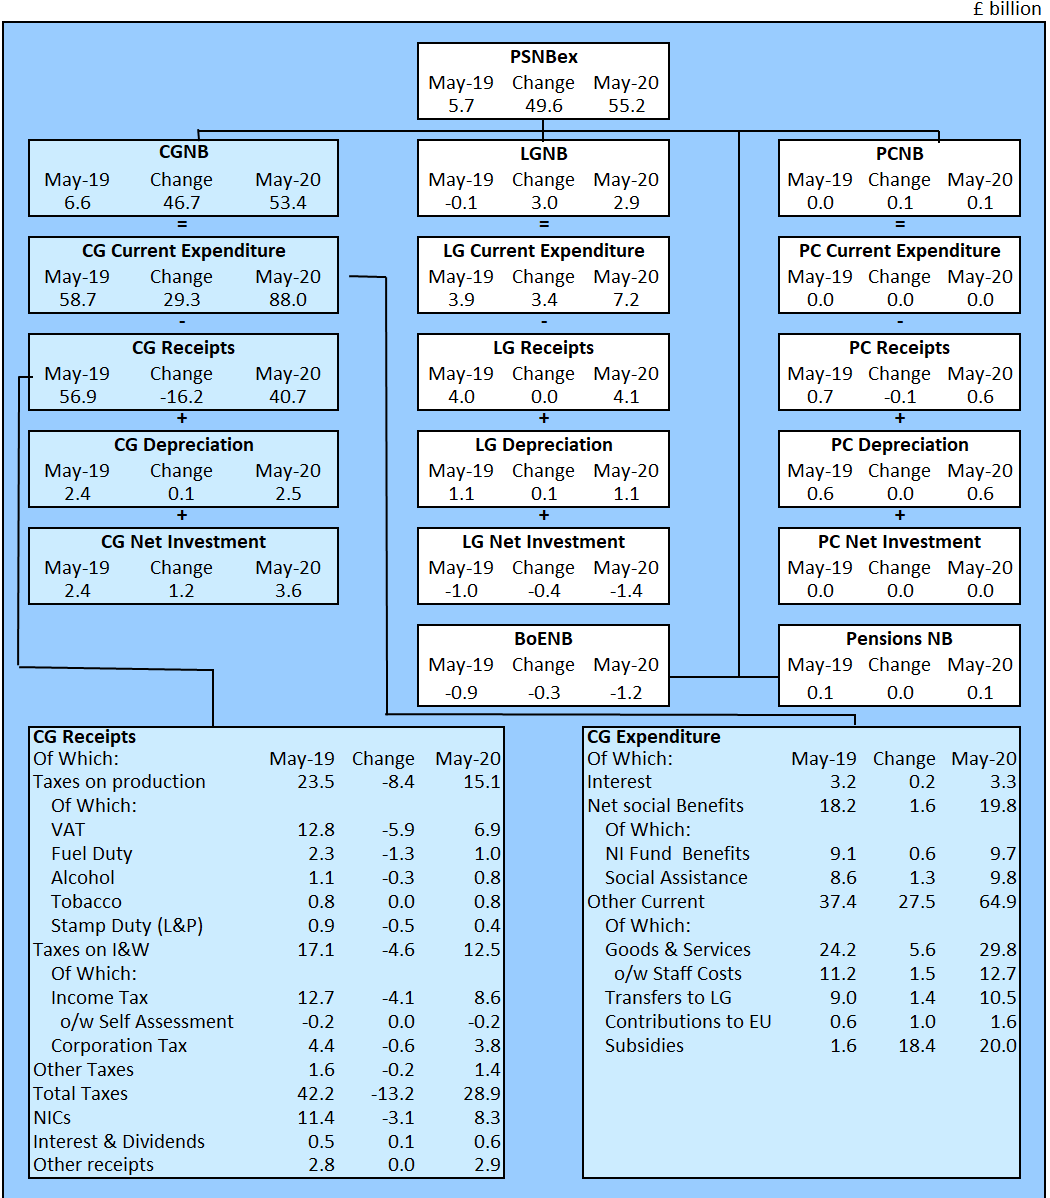
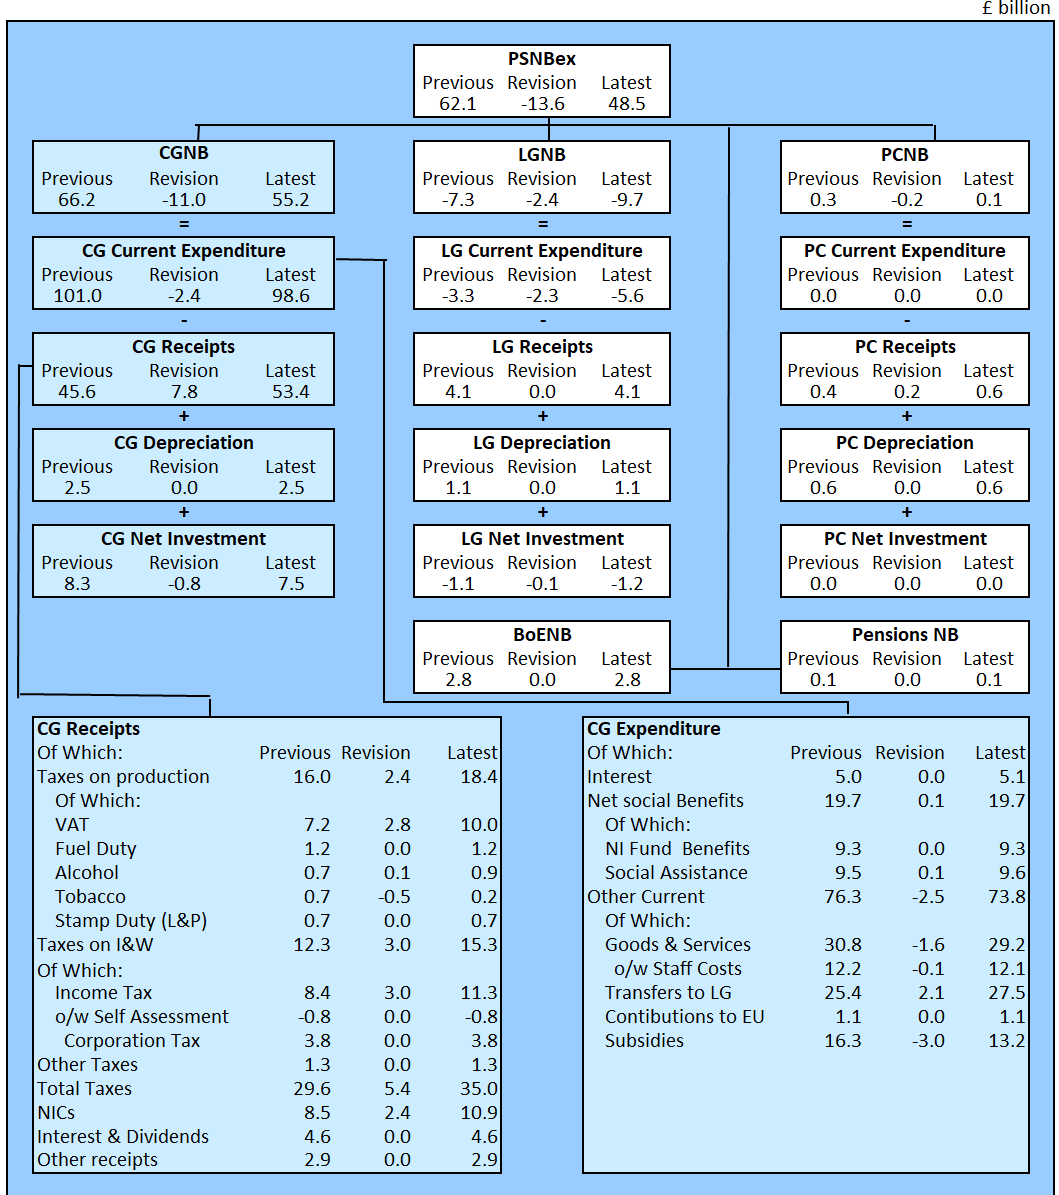
Figure 3 summarises how each of the five sub-sectors (central government, local government, non-financial public corporations, public sector pensions and the Bank of England (BoE)) contribute to the overall growth in monthly borrowing in May 2020 and compares this with the equivalent measures in the same month a year earlier (May 2019).
Figure 3: How each sector contributes to the growth in monthly borrowing
Public sector net borrowing by sub-sector, UK, May 2020, compared with May 2019
Source: Office for National Statistics – Public Sector Finances
Notes:
- PSNBex – Public sector net borrowing excluding public sector banks.
- CGNB – Central government net borrowing.
- LGNB – Local government net borrowing.
- PCNB – Non-financial public corporations: net borrowing.
- BoENB – Bank of England net borrowing.
- L&P – Land and property.
- I & W – Income and wealth.
- Contributions to EU – UK VAT, GNI and abatement contributions to the EU budget.
- NICs – National Insurance contributions.
- o/w – Of which.
Download this image Figure 3: How each sector contributes to the growth in monthly borrowing
.png (92.1 kB) .xls (85.5 kB)
Central government receipts
In May 2020, central government receipts fell by 28.4% compared with May 2019 to £40.7 billion, including £28.9 billion in taxes.
This month, tax revenue on a national accounts basis fell by 31.3% compared with May last year, with Value Added Tax (VAT), Pay As You Earn (PAYE) Income Tax and Corporation Tax receipts falling by 46.0%, 29.4% and 14.0% respectively.
These figures are always subject to some uncertainty, as many taxes such as VAT, PAYE and Corporation Tax contain some forecast cash receipts data and are liable to revision when actual cash receipts data are received.
Our article Recent and upcoming changes to public sector finance statistics: May 2020 explains the ongoing challenges faced in measuring the effects of the coronavirus pandemic on tax receipts on a national accounts (accruals) basis. These assumptions and exceptional adjustments remain the same as those reported last month, with the exception of those applied to Pay As You Earn (PAYE) income tax, where we have included a 7% adjustment to reduce expected PAYE receipts to account for possible non-payment.
Central government expenditure
In May 2020, central government spent £91.6 billion, an increase of 49.8% on May 2019.
Of this amount, around three-quarters was spent by central government on providing services and grants (for example, related to education, defence, and health and social care), with the remainder spent on social benefits (such as pensions, unemployment payments, Child Benefit and Statutory Maternity Pay), capital investment and interest on the government's outstanding debt.
Departmental expenditure on goods and services
Departmental expenditure on goods and services in May 2020 increased by £5.6 billion compared with May 2019, including a £1.5 billion increase in expenditure on staff costs and a £3.8 billion increase in the purchase of goods and services. This increase in pay and procurement partially reflects expenditure by the Department of Health and Social Care to respond to the coronavirus pandemic.
Subsidies paid by central government
In May 2020, subsidies paid by central government include both the Coronavirus Job Retention Scheme (CJRS) and Self Employment Income Support Scheme (SEISS).
These temporary schemes are designed to help employers pay wages and salaries to those employees who would otherwise be made redundant and to support self-employed workers.
In May 2020, central government subsidy expenditure was £20.0 billion, of which £10.5 billion were CJRS payments and £6.8 billion were SEISS payments.
Estimates of accrued CJRS payments are currently based on the Office for Budget Responsibility (OBR) Coronavirus policy monitoring database, while SEISS payments are based on HM Revenue and Customs' (HMRC's) coronavirus (COVID-19) statistics.
UK contributions to the European Union
The UK contributions to the European Union (EU) in May 2020 were £1.6 billion, an increase of £1.0 billion on May 2019. This increase is largely because of the monthly profile of 2020 payments made to the EU, rather than a reflection of any budgetary increase or in response to the pandemic.
Interest payments on the government's outstanding debt
Interest payments on the government's outstanding debt in May 2020 were £3.3 billion, a £0.2 billion increase compared with May 2019. Changes in debt interest are largely a result of movements in the Retail Prices Index to which index-linked bonds are pegged.
Local government and public corporations data
Both the local government and public corporations data for May 2020 are initial estimates, largely based on the OBR's Coronavirus Reference Scenario published 14 May 2020.
This month we include the Transport for London (TfL) extraordinary funding and financing grant for the first time. This grant of £1.1 billion, recorded as a subsidy from central government has been spread equally (accrued) across May to October 2020, meaning that public corporations' gross operating surplus has been increased by £0.2 billion this month.
Current and capital transfers between these sectors and central government are based on administrative data supplied by HM Treasury and have no impact at the public sector level.
Borrowing in the current financial year-to-date
In the current financial year-to-date (April to May 2020), the public sector borrowed £103.7 billion, £87.0 billion more than in the same period last year. This unprecedented increase largely reflects the impact of the pandemic on the public finances.
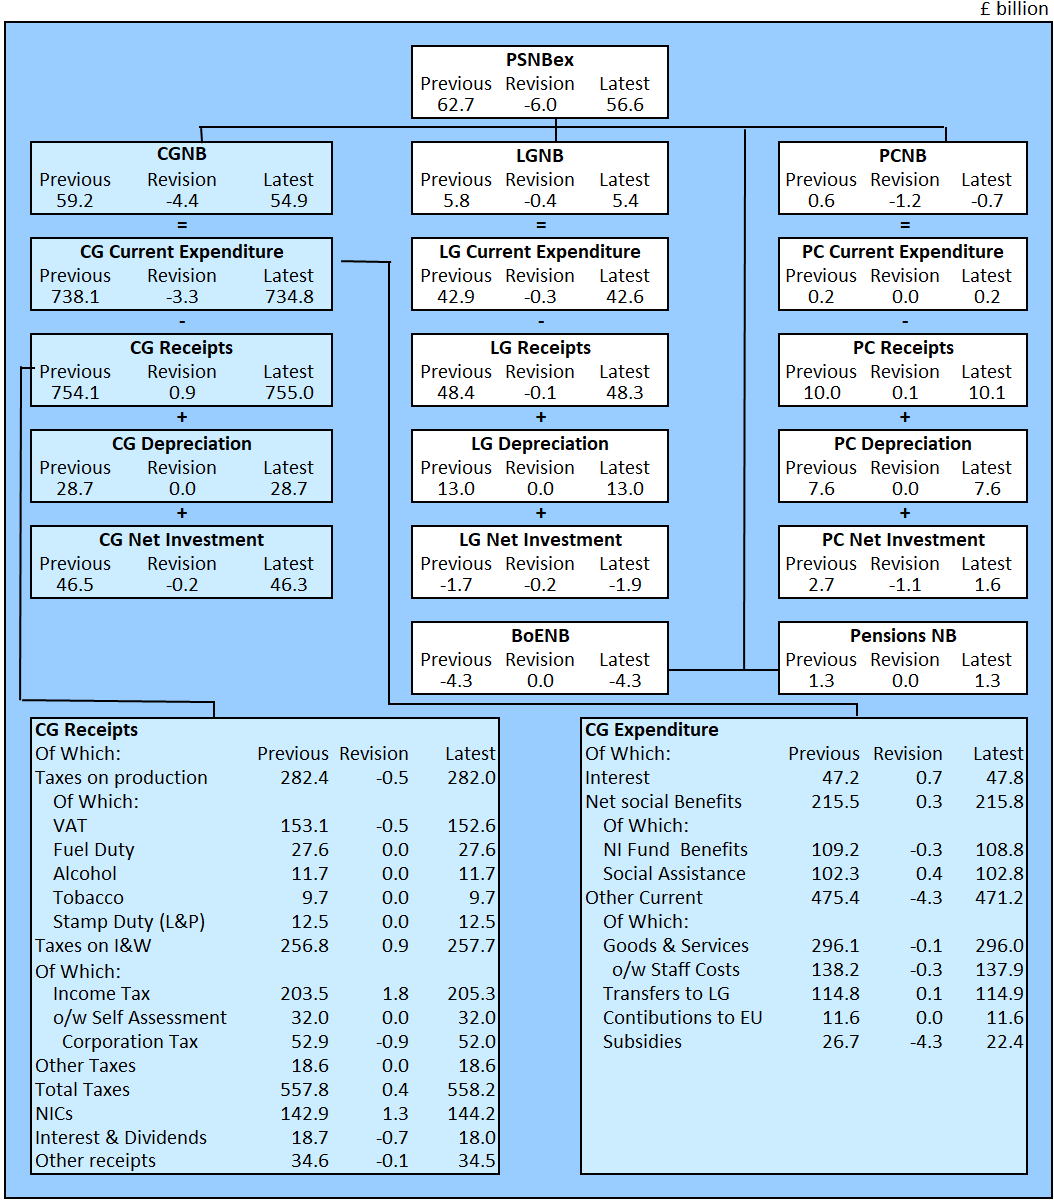
Figure 4 summarises how each of the five sub-sectors (central government, local government, non-financial public corporations, public sector pensions and the Bank of England (BoE)) contribute to the overall growth in monthly public sector net borrowing excluding public sector banks (PSNB ex) in the latest financial year-to-date (April to May 2020) and compares this with the equivalent measures in the same period a year earlier.
Figure 4: How each sector contributes to the growth in borrowing
Public sector net borrowing by sub-sector, UK, latest financial year-to-date (April to May 2020) compared with the financial year ending March 2019

Source: Office for National Statistics – Public Sector Finances
Notes:
- PSNBex – Public sector net borrowing excluding public sector banks.
- CGNB – Central government net borrowing.
- LGNB – Local government net borrowing.
- PCNB – Non-financial public corporations net borrowing.
- BoENB – Bank of England net borrowing.
- L&P – Land and property.
- I & W – Income and wealth.
- Contributions to EU – UK VAT, GNI and abatement contributions to the EU budget.
- NICs – National Insurance contributions.
- o/w – Of which.
Download this image Figure 4: How each sector contributes to the growth in borrowing
.png (96.8 kB) .xls (85.0 kB)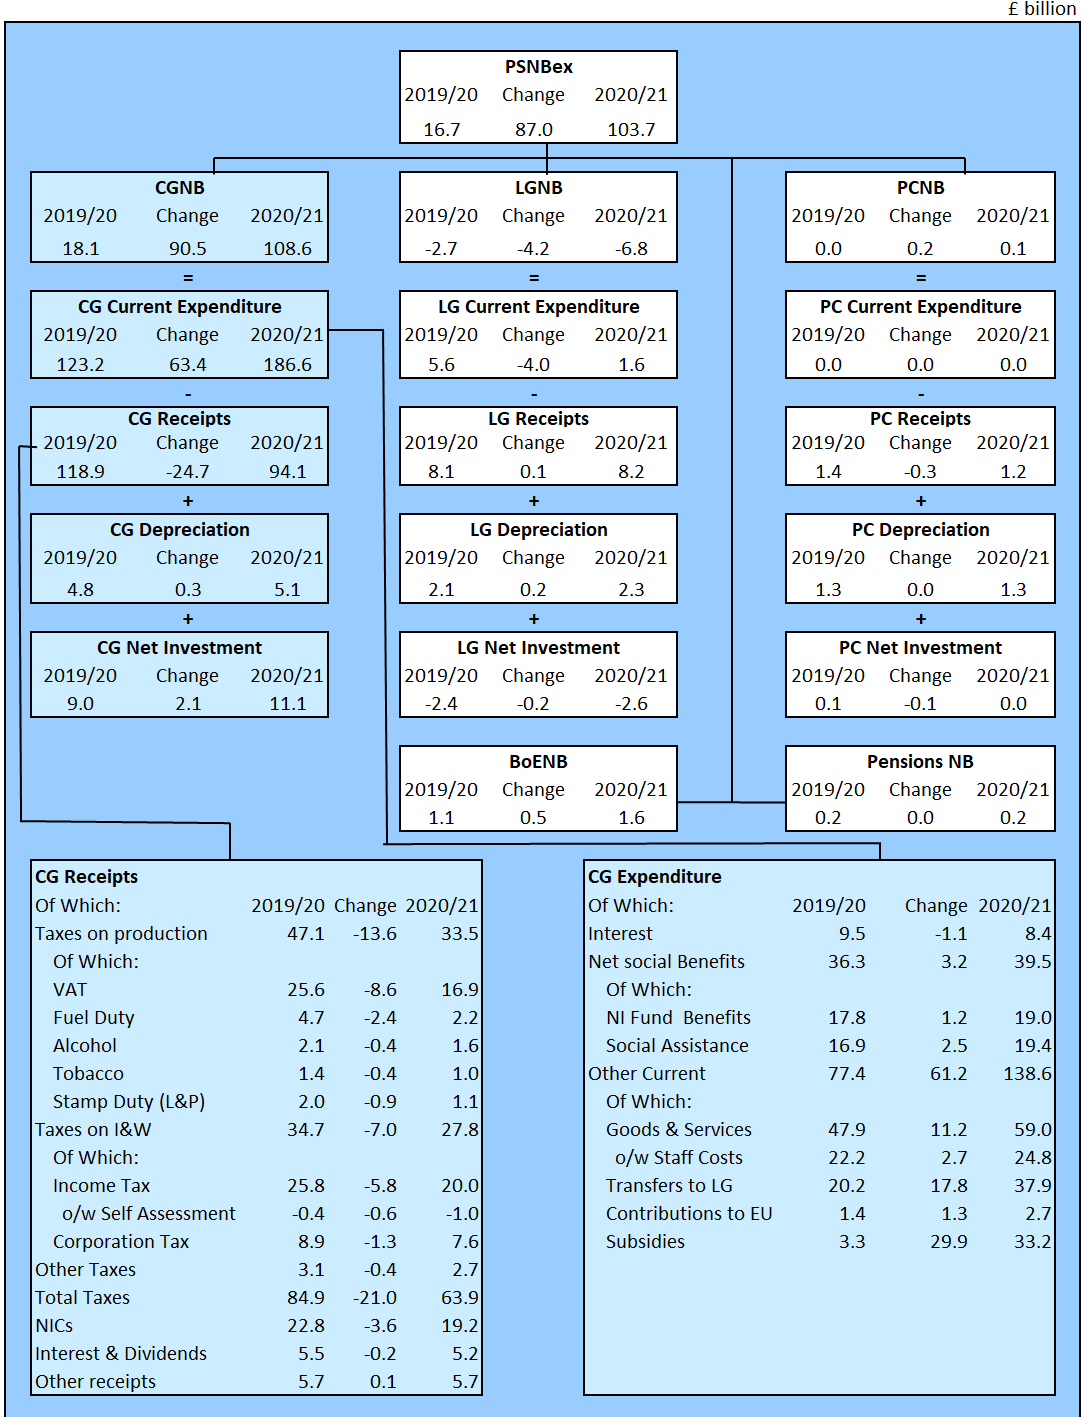
Borrowing in the latest full financial year
This month we publish the third provisional estimate of borrowing for the full financial year ending March 2020. Since the first estimate published on 23 April 2020, we have revised borrowing upwards by £7.9 billion from £48.7 billion to £56.6 billion. This revision reflects the provisional nature of the data under normal circumstances as provisional data estimates are replaced by improved forecasts (and eventually outturn data). More notably this revision reflects updated data being made available as the effects of the coronavirus pandemic on the public finances become clearer.
Borrowing has generally been falling since its peak in the financial year ending March 2010. However, borrowing in the latest full financial year (April 2019 to March 2020) was £56.6 billion, £16.1 billion more than in the previous financial year, largely because of the impact of the pandemic in March.
Figure 5: Borrowing in the latest financial year was around one-third (35.8%) of the amount borrowed in the financial year ending March 2010
Public sector net borrowing excluding public sector banks, UK, April 1993 to May 2020
Source: Office for National Statistics – Public Sector Finances
Notes:
- The Office for Budget Responsibility (OBR) full financial year forecast of PSNB ex for the financial year ending (FYE) March 2021, taken from the 13 March 2020 EFO.
- Financial year 2019 to 2020 represents the FYE 2020 (April 2019 to March 2020).
- Financial year-to-date represents April to May.
- OBR Coronavirus Reference Scenario originally published 14 April 2020. This chart uses the updated fiscal data published 14 May 2020.
Download this image Figure 5: Borrowing in the latest financial year was around one-third (35.8%) of the amount borrowed in the financial year ending March 2010
.png (40.7 kB) .xls (69.1 kB)
5. Central government net cash requirement
The central government net cash requirement excluding UK Asset Resolution Ltd, Network Rail and COVID Corporate Facility Fund (CGNCR) is the amount of cash needed immediately for the UK government to meet its obligations. To obtain cash, the UK government sells financial instruments, gilts or Treasury Bills.
The amount of cash required will be affected by changes in the timing of tax payments by individuals and businesses but does not depend on forecast tax receipts in the same way as our national accounts-based (accrued) measures.
The CGNCR consequently contains the most timely information and is less susceptible to revision. However, as for any cash measure, the CGNCR does not reflect the overall amount for which government is liable or the point at which any liability is incurred -- it only reflects when cash is received and spent.
Table 1 demonstrates how central government's net cash requirement is calculated from its cash receipts and cash outlays. This presentation focuses on the central government's own account and excludes cash payments to both local government and public non-financial corporations.
On 20 March 2020, the government introduced a Value Added Tax (VAT) payment deferral policy to support UK business during the coronavirus (COVID-19) pandemic by enabling them to pay VAT due between 20 March 2020 and 30 June 2020 at a later date (though before 31 March 2021). This policy has substantially lowered VAT cash receipts.
Similarly to April 2020, in May VAT cash receipts were negative at minus £0.6 billion, because normal VAT cash repayments to businesses exceeded VAT cash receipts.
| £ billion | ||||||||
|---|---|---|---|---|---|---|---|---|
| May | Financial year-to-date¹³ | |||||||
| 2019 | 2020 | Change | % change | 2019/20 | 2020/21 | Change | % change | |
| Total paid over¹ | 41.6 | 24.3 | -17.4 | -41.7 | 100.1 | 57.0 | -43.0 | -43.0 |
| Of which: Income tax² | 13.4 | 11.3 | -2.1 | -15.4 | 31.7 | 25.9 | -5.8 | -18.4 |
| NICs³ | 10.7 | 9.2 | -1.5 | -13.9 | 24.2 | 20.3 | -3.9 | -16.1 |
| VAT⁴ | 11.0 | -0.6 | -11.6 | -105.8 | 24.0 | -1.5 | -25.5 | -106.4 |
| Corporation tax⁵ | 2.2 | 0.8 | -1.4 | -61.7 | 9.9 | 4.4 | -5.5 | -55.5 |
| Interest and dividends | 0.7 | 0.6 | 0.0 | -6.9 | 5.4 | 5.3 | -0.1 | -1.5 |
| Other receipts⁶ | 1.8 | -0.4 | -2.2 | -124.1 | 1.2 | 1.1 | 0.0 | -2.4 |
| Total cash receipts | 44.1 | 24.5 | -19.6 | -44.5 | 106.6 | 63.5 | -43.2 | -40.5 |
| Interest payments | 0.3 | 0.1 | -0.2 | -71.9 | 1.0 | 11.0 | 10.0 | 1,018.6 |
| Net acquisition of company securities⁷ | 0.0 | 0.0 | 0.0 | 100.0 | -4.3 | 0.0 | 4.3 | 100.0 |
| Net department outlays⁸ | 59.8 | 87.2 | 27.3 | 45.6 | 115.7 | 178.5 | 62.9 | 54.3 |
| Of which: CJRS⁹ | 0.0 | 9.8 | 9.8 | - | 0.0 | 14.9 | 14.9 | - |
| Of which: SEISS¹⁰ | 0.0 | 6.8 | 6.8 | - | 0.0 | 6.8 | 6.8 | - |
| Total cash outlays | 60.1 | 87.2 | 27.1 | 45.1 | 112.3 | 189.5 | 77.1 | 68.7 |
| Own account NCR¹¹ | 16.0 | 62.7 | 46.7 | 291.8 | 5.7 | 126.0 | 120.3 | 2,105.1 |
| NRAM and B&B | -0.4 | 0.0 | 0.4 | 106.2 | 2.5 | 0.0 | -2.5 | -98.6 |
| Network Rail | 0.0 | 0.0 | 0.0 | 0.0 | -0.1 | -0.1 | 0.0 | 0.0 |
| COVID Corporate Facility Fund | 0.0 | 3.1 | 3.1 | - | 0.0 | 19.0 | 19.0 | - |
| Own account NCR¹² | 15.6 | 65.8 | 50.2 | 322.3 | 8.1 | 144.9 | 136.8 | 1,682.2 |
Download this table Table 1: Central government net cash requirement on own account
.xls .csvOn the same day as we release the public sector finances, HM Revenue and Customs (HMRC) publish a Summary of HMRC tax receipts, National Insurance contributions (NICs), Tax Credit expenditure and Child Benefit for the UK containing a detailed list of cash receipts.
Nôl i'r tabl cynnwys6. Debt
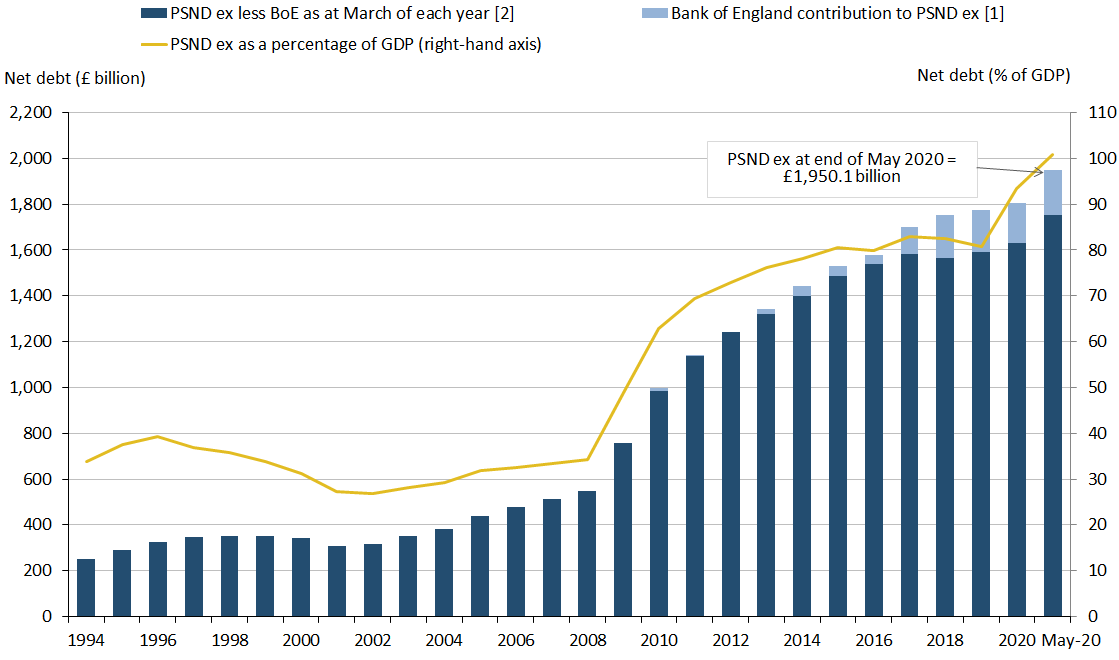
At the end of May 2020, the amount of money owed by the public sector to the private sector was just under £2.0 trillion (or £1,950.1 billion), which equates to 100.9% of gross domestic product (GDP).
This is the first time that debt as a percentage of GDP has exceeded 100% since the financial year ending March 1963. However, it is important to note that while our estimate of debt is largely based on outturn data and is unlikely to be significantly revised over time, the current estimate of GDP used to calculate this ratio uses forecasts based on expectations published in the Office for Budget Responsibility's (OBR's) Coronavirus Reference Scenario published 14 May 2020 and may be revised substantially over time as these estimates are replaced by outturn data.
On 23 April 2020, the Debt Management Office (DMO) published April 2020: Revision to the DMO's 2020 to 2021 Financing Remit for May to July 2020 (PDF, 264KB), in which it announced that it will raise £180 billion during the May to July 2020 (inclusive) period, exclusively through issuance of conventional and index-linked gilts.
In May 2020, the DMO issued £56.7 billion in gilts at nominal value, raising £62.6 billion in cash. This continues the substantial month-on-month increase in gilts issuance (at nominal value) in the current financial year.
The Bank of England's contribution to debt
The Bank of England's contribution to debt is largely a result of its quantitative easing activities via the Bank of England Asset Purchase Facility Fund and Term Funding Schemes.
Bank of England Asset Purchase Facility Fund
In March 2020, the Bank of England announced the expansion of its Asset Purchase Facility Fund (APF) by £200 billion to a total of £645 billion in total, made up of £190 billion in gilts and £10 billion in corporate bonds.
At the end of May 2020, the gilt holdings of the APF have increased by £46.7 billion (at nominal value) compared with the end of April 2020, to £475.1 billion in total. This increase is of a similar order of magnitude to the new issuance by the DMO in May 2020, which means that gilt holdings by units other than the APF have changed very little since April 2020.
As a result of these gilt holdings, the impact of the APF on public sector net debt stands at £95.7 billion, the difference between the nominal value of its gilt holdings and the market value it paid at the time of purchase. Note that the final debt impact of the APF depends on the disposal of the gilts at the end of the scheme.
Term Funding Scheme and Term Funding Scheme with additional incentives for Small and Medium-sized Enterprises
In March 2020, the Bank of England announced the expansion of its Term Funding Scheme with the introduction of the Term Funding Scheme with additional incentives for Small and Medium-sized Enterprises (TFSME).
In May 2020, an additional £3.7 billion of loans were made under the TFSME scheme, bringing the total stock of loans under the TFS umbrella to £119.0 billion and so adding an equivalent amount to public sector net debt.
If we were to remove the temporary debt impact of APF and TFS, public sector net debt (excluding public sector banks) at the end of May 2020 would reduce by £195.5 billion (or 10.1% percentage points of GDP) to £1,754.6 billion (or 90.8% of GDP).
Figure 6: Debt as a percentage of gross domestic product (GDP) has been falling in recent financial years; however, the measures introduced to address the COVID-19 pandemic have increased this proportion considerably
Public sector net debt excluding public sector banks, UK, March 1994 to the end of May 2020
Source: Office for National Statistics – Public Sector Finances
Notes:
- Includes Asset Purchase Facility (APF) which includes the Term Funding Scheme (TFS) and TFS incentives for small and medium-sized enterprises (TFSME).
- Public sector net debt excluding public sector banks (PSND ex) is the combination of PSND ex Bank of England (BoE) plus the BoE’s contribution to PSND ex.
- Public sector net debt excluding public sector banks (PSND ex) shown at the end of each financial year (March), unless otherwise stated.
Download this image Figure 6: Debt as a percentage of gross domestic product (GDP) has been falling in recent financial years; however, the measures introduced to address the COVID-19 pandemic have increased this proportion considerably
.png (38.0 kB) .xls (73.7 kB)
COVID Corporate Financing Facility Fund
In April 2020, we recorded the COVID Corporate Financing Facility Fund (CCFF) for the first time. The CCFF is a scheme under which the Bank of England (BoE), acting for HM Treasury, buys commercial paper issued by larger, non-financial corporations, in order to help with their cashflow position. Our recording of the CCFF remains provisional and based on the information currently available.
At the end of May 2020, the CCFF increased the level of central government debt by £19.0 billion, reflecting the loan liability to the BoE. However, since the BoE owns the counterpart loan asset there is an equal and offsetting reduction in the Bank's contribution to debt, meaning that there is no net impact on public sector net debt.
Nôl i'r tabl cynnwys7. Revisions
The data for the latest months of every release contain a degree of forecasts; subsequently these are replaced by improved forecasts as further data are available and finally outturn.
The coronavirus (COVID-19) pandemic has had an unprecedented impact on both tax receipts and expenditure. These impacts are likely to be revised further as the full effects of the coronavirus on the public finances continue to become clearer.
The revisions presented in this section are largely the result of new tax data received from our data suppliers and incorporating updated estimates of the expenditure associated with the Coronavirus Job Retention Scheme (CJRS).
Table 2 shows the revisions to the headline statistics presented in this bulletin compared with those presented in the previous bulletin (published on 22 May 2020), while Figures 7 and 8 show how each element of the public sector contributes to the revisions in April 2020 and in the latest full financial year net borrowing (public sector net borrowing excluding public sector banks, PSNB ex).
| £ billion¹ (not seasonally adjusted) | |||||||||
|---|---|---|---|---|---|---|---|---|---|
| Net borrowing | |||||||||
| Period | CG² | LG³ | NFPCs⁴ | PSP⁵ | BoE⁶ | PSNB ex⁷ | PSND ex⁸ | PSND % of GDP⁹ | PSNCR ex¹⁰ |
| 2018/19 | 0.4 | 0.0 | 0.0 | 0.0 | 0.0 | 0.4 | 0.0 | 0.0 | 0.0 |
| 2019/20 | -4.4 | -0.4 | -1.2 | 0.0 | 0.0 | -6.0 | 2.3 | 0.2 | 0.0 |
| Apr 2020 | -11.0 | -2.4 | -0.2 | 0.0 | 0.0 | -13.6 | -10.0 | -0.6 | -15.6 |
Download this table Table 2: Revisions to main aggregates
.xls .csvThis month we have reduced the estimate of borrowing in April 2020 by £13.6 billion to £48.5 billion, largely because of an increase in the previous estimate of central government tax receipts and National Insurance contributions, along with a reduction in the expenditure associated with the CJRS. These revisions reflect the uncertainty of the impact of the coronavirus on both future cash tax receipts and central government expenditure. Further revisions are likely.
Central government tax receipts and National Insurance contributions for April 2020 have been increased by £5.4 billion and £2.4 billion respectively compared with those published in our previous bulletin (published 22 May 2020). Within tax receipts, Pay As You Earn income tax has been increased by £3.0 billion and Value Added Tax has been increased by £2.8 billion, both because of updated data. These estimates remain uncertain and may be revised again as further information becomes available.
To estimate borrowing, tax receipts are recorded on a national accounts (accrued) rather than on a cash receipt basis. In other words, we attempt to record receipts at the point where the liability arose, rather than when the tax is actually paid. This process means many receipts are provisional for the latest period(s) as they depend on both actual cash payments and on projections of future tax receipts (currently based on the Office for Budget Responsibility's (OBR's) Coronavirus Reference Scenario published 14 May 2020), which are "accrued" (or time adjusted) back to the current month(s).
Central government current expenditure for April 2020 has been reduced by £2.4 billion compared with that published in our previous bulletin (published 22 May 2020).
On 4 June 2020, the OBR published an update to its Coronavirus analysisin which it reduced previous estimates of CJRS expenditure. As a result of these data revisions, subsidies paid by central government in April 2020 have been reduced by £3.5 billion. Further, the previous estimate of CJRS subsidies paid in March 2020 has been reduced by £4.5 billion, to £2.5 billion.
This month we have increased the previous estimate (published 22 May 2020) of current grants paid by central to local government by £2.1 billion in April 2020. These payments net out at a public sector level and so have no impact on public sector borrowing.
Figure 7: How each element of the public sector contributes to the revision in April 2020 net borrowing (PSNB ex)
Revisions to borrowing since the previous public sector finances bulletin (published on 22 May 2020), UK
Source: Office for National Statistics – Public Sector Finances
Notes:
- PSNBex – Public sector net borrowing excluding public sector banks.
- CGNB – Central government net borrowing.
- LGNB – Local government net borrowing.
- PCNB – Non-financial public corporations net borrowing.
- BoENB – Bank of England net borrowing.
- L&P – Land and property.
- I & W – Income and wealth.
- Contributions to EU – UK VAT, GNI and abatement contributions to the EU budget.
- NICs – National Insurance contributions
- o/w – Of which.
Download this image Figure 7: How each element of the public sector contributes to the revision in April 2020 net borrowing (PSNB ex)
.png (87.4 kB) .xls (94.7 kB)
Figure 8: How each element of the public sector contributes to the revision in full financial year (April 2019 to March 2020) net borrowing (PSNB ex)
Revisions to borrowing since the previous Public sector finances bulletin (published on 22 May 2020), UK
Source: Office for National Statistics – Public Sector Finances
Notes:
- PSNBex – Public sector net borrowing excluding public sector banks.
- CGNB – Central government net borrowing.
- LGNB – Local government net borrowing.
- PCNB – Non-financial public corporations net borrowing.
- BoENB – Bank of England net borrowing.
- L&P – Land and property.
- I & W – Income and wealth.
- Contributions to EU – UK VAT, GNI and abatement contributions to the EU budget.
- NICs – National Insurance contributions.
- o/w – Of which.
Download this image Figure 8: How each element of the public sector contributes to the revision in full financial year (April 2019 to March 2020) net borrowing (PSNB ex)
.png (90.2 kB) .xls (94.7 kB)
8. Public sector finances data
Public sector finances borrowing by sub-sector
Dataset | Released 19 June 2020
An extended breakdown of public sector borrowing in a matrix format and estimates of total managed expenditure (TME).
Public sector finances tables 1 to 10: Appendix A
Dataset | Released 19 June 2020
The data underlying the public sector finances statistical bulletin are presented in the tables PSA 1 to 10.
Public sector finances revisions analysis on main fiscal aggregates: Appendix C
Dataset | Released 19 June 2020
Revisions analysis for central government receipts, expenditure, net borrowing and net cash requirement statistics for the UK over the last five years.
Public sector current receipts: Appendix D
Dataset | Released 19 June 2020
A breakdown of UK public sector income by latest month, financial year-to-date and full financial year, with comparisons with the same period in the previous financial year.
Impact of student loans, public sector-funded pension scheme changes and capital consumption changes introduced in September 2019: Appendix G
Dataset | Released 19 June 2020
Latest estimates of public sector net borrowing (PSNB) (and further into current budget deficit and net investment spending), net debt and net financial liabilities, with the impacts of changes to the accounting for student loans, public sector pensions and capital consumption introduced in September 2019.
HMRC tax receipts and National Insurance contributions for the UK
Dataset | Released 19 June 2020
Summary of HM Revenue and Customs tax receipts, National Insurance contributions, tax credit expenditure and Child Benefit for the UK on a cash basis.
All datasets related to this publication are available on our website.
9. Glossary
The public sector
In the UK, the public sector consists of six sub-sectors: central government, local government, public non-financial corporations, public sector pensions, the Bank of England and public financial corporations (or public sector banks).
Public sector current budget deficit
Public sector current budget is the difference between revenue (mainly from taxes) and current expenditure, on an accrued basis; it is the gap between current expenditure and current receipts (having taken account of depreciation). The current budget is in surplus when receipts are greater than expenditure.
Public sector net investment
Net investment refers to the balance of acquisition less disposals of capital assets and liabilities.
Public sector net borrowing
Public sector net borrowing excluding public sector banks (PSNB ex) measures the gap between revenue raised (current receipts) and total spending (current expenditure plus net investment (capital spending less capital receipts)). Public sector net borrowing (PSNB) is often referred to by commentators as "the deficit".
Public sector net cash requirement
The public sector net cash requirement (PSNCR) represents the cash needed to be raised from the financial markets over a period of time to finance the government's activities. This can be close to the deficit for the same period; however, there are some transactions, for example, loans to the private sector, that need to be financed but do not contribute to the deficit. It is also close but not identical to the changes in the level of net debt between two points in time.
Public sector net debt
Public sector net debt excluding public sector banks (PSND ex) represents the amount of money the public sector owes to private sector organisations including overseas institutions, largely as a result of issuing gilts and Treasury Bills, minus the amount of cash and other short-term assets it holds. Public sector net debt (PSND) is often referred to by commentators as "the national debt".
Debt interest to revenue ratio
The debt interest to revenue ratio (DIR) represents the proportion of net interest paid (gross interest paid less interest received) by the public sector (excluding public sector banks), compared with the non-interest receipts it receives in a given period.
Other important terms commonly used to describe public sector finances are listed in the Public sector finances glossary.
Nôl i'r tabl cynnwys10. Measuring the data
The Monthly statistics on the public sector finances: a methodological guide provides comprehensive contextual and methodological information concerning the monthly public sector finances statistical bulletin. The guide sets out the conceptual and fiscal policy context for the bulletin, identifies the main fiscal measures, and explains how these are derived and interrelated. Additionally, it details the data sources used to compile the monthly estimates of the fiscal position.
More quality and methodology information on strengths, limitations, appropriate uses, and how the data were created is available in the Public sector finances QMI.
The possible impact of coronavirus on our publishing timetable
The coronavirus (COVID-19) pandemic presents a significant challenge. We are working hard to ensure the UK government has the vital information needed to respond to the impact of this pandemic on our economy and society. But, inevitably, the disruption caused by the pandemic means we may need a little extra time to quality assure some of our data before publication.
We will review our publication dates and announce any future short delays in due course. We have released a public statement on COVID-19 and the production of statistics.
Gross domestic product (GDP) impact
Estimates of gross domestic product (GDP) used to present debt and other headline measures are partly based on provisional and official forecast data.
The first quarter of 2020 (January to March 2020) is based on the first published provisional estimate GDP first quarterly estimate, UK: January to March 2020. It is likely that this provisional estimate of GDP will be revised in future months.
Estimates of GDP for the subsequent three quarters are based on expectations published in the Office for Budget Responsibility's (OBR's) Coronavirus Reference Scenario published 14 May 2020. These data do not represent official forecasts but are the latest published estimates made by the OBR of the impact of the coronavirus on future GDP.
On 6 May 2020, we published Coronavirus and the effects on UK GDP, which explains how the global pandemic and the wider containment efforts are expected to impact on UK GDP as well as some of the challenges that national statistical institutes are currently facing.
Comparisons with official forecasts
The independent OBR is responsible for the production of official forecasts for government. These forecasts are usually produced twice a year, in spring and autumn.
The most recent official forecasts, presented in the OBR's Supplementary forecast (13 March 2020) were made before the full effects of the pandemic were apparent. It was widely recognised that these forecasts are likely to overstate future revenues. In turn, this made future downward revisions to revenues and upward revisions to borrowing more likely.
In May 2020, we updated our presentations to reflect the OBR's Coronavirus Reference Scenario published 14 May 2020. The reference scenario assumes a three-month lockdown period followed by a gradual return to normal over the subsequent three months. These data do not represent official forecasts but are the latest published estimates made by the OBR of the impact of the coronavirus on future tax receipts.
Table 3 presents the headline public sector finance fiscal aggregates published in both OBR's Supplementary forecast (13 March 2020) and Coronavirus Reference Scenario published 14 May 2020.
| £ billion, unless otherwise stated (not seasonally adjusted) | |||||
|---|---|---|---|---|---|
| Current Budget Deficit | Net investment | Net borrowing | Net debt¹ | Net debt % of GDP | |
| Outturn 2019/20 | 9.0 | 47.6 | 56.6 | 1,806.3 | 93.5 |
| OBR Forecast 2019/20² | -1.7 | 49.1 | 47.4 | 1,798.9 | 79.5 |
| Difference | 10.7 | -1.5 | 9.2 | 7.4 | 14.0 |
| OBR Forecast 2020/21² | -4.9 | 59.7 | 54.8 | 1,818.3 | 77.4 |
| OBR Scenario 2020/21³ | - | - | 298.4 | 2,230.3 | 95.8 |
| Outturn May 2020 | 52.9 | 2.3 | 55.2 | 1,950.1 | 100.9 |
| OBR Scenario May 2020³ | - | - | 50.9 | 1,948.7 | 100.5 |
| Difference | - | - | 4.3 | 1.4 | 0.4 |
Download this table Table 3: How the latest outturn public sector figures compare with official Office for Budget Responsibility forecasts for the financial year ending March 2020, UK
.xls .csvDeparture from the EU
As the UK leaves the European Union (EU), it is important that our statistics continue to be of high quality and are internationally comparable. During the transition period, those UK statistics that align with EU practice and rules will continue to do so in the same way as before 31 January 2020.
These statistics, and our sector classification process, draw on the European System of Accounts (ESA) 2010, the Manual on Government Deficit and Debt, and associated guides.
After the transition period, we will continue to produce our public sector finance statistics in line with the UK Statistics Authority's Code of Practice for Statistics and in accordance with internationally agreed statistical guidance and standards.
To ensure comparability with other countries, the statistical aggregates within the Public sector finances release will continue to be produced according to the existing definitions and standards until further notice or those standards are updated.
Nôl i'r tabl cynnwys11. Strengths and limitations
National Statistics status for public sector finances
On 20 June 2017, the UK Statistics Authority published a letter confirming the designation of the monthly Public sector finances bulletin as a National Statistic. This letter completes the 2015 assessment of public sector finances.
Local government
Local government data for the financial year ending (FYE) March 2020 are mainly based on budget data for England, Wales and Scotland, and estimates for Northern Ireland.
In recent years, planned expenditure initially reported in local authority budgets has been systematically higher than the final outturn expenditure reported in the audited accounts. We therefore include adjustments to reduce the amounts reported at the budget stage.
For the FYE March 2020, we include a £2.0 billion downward adjustment to England's current expenditure on goods and services, along with £0.7 billion, £0.6 billion and £0.2 billion adjustments to Scotland's, England's and Wales' capital expenditure respectively. We apply a further £3.0 billion downward adjustment to current expenditure on benefits in the FYE March 2020, to reflect the most recently available data for housing benefits. Further information on these and additional adjustments can be found in the Public sector finances QMI.
Local government data for the FYE March 2021 are initial estimates, based on the Office for Budget Responsibility (OBR) forecasts. We have reflected our estimation of impact of the coronavirus (COVID-19) in these data.
Current and capital transfers between local and central government are based on administrative data supplied by HM Treasury.
Non-financial public corporations
Public corporations data for the FYE March 2021 are initial estimates, based on the OBR forecasts. Current and capital transfers between public corporations and central government are based on administrative data supplied by HM Treasury.
Public sector funded pensions
Pensions data for the FYE March 2020 and 2021 are our estimates based on the latest available data. Some of these estimates rely on actuarial modelling; this is a complex process that most public sector schemes conduct every three to four years. Until such valuations become available, we forecast the change in pension liability using our knowledge of the economic climate. Pensions in the public sector finances: a methodological guide outlines both the theory and practice behind our calculation of pension scheme estimates.
Public sector banks
Unless otherwise stated, the figures quoted in this bulletin exclude public sector banks (that is, currently only Royal Bank of Scotland, RBS). The reported position of debt, and to a lesser extent borrowing, would be distorted by the inclusion of RBS' balance sheet (and transactions). This is because the government does not need to borrow to fund the debt of RBS, nor would surpluses achieved by RBS be passed on to the government, other than through any dividends paid as a result of the government equity holdings.
Nôl i'r tabl cynnwys