Cynnwys
- Main points
- Things you need to know about public sector finances
- What’s changed in this release?
- How much is the public sector borrowing?
- How much does the public sector owe?
- Revisions since previous release
- How do our figures compare with official forecasts?
- International comparisons of borrowing and debt
- Quality and methodology
- Looking ahead
- Links to data and related publications
1. Main points
Borrowing (Public sector net borrowing excluding public sector banks (PSNB ex)) in August 2018 was £6.8 billion, £2.4 billion more than in August 2017; this was the largest August borrowing for two years (since 2016).
Borrowing (PSNB ex) in the current financial year-to-date (YTD) was £17.8 billion: £7.8 billion less than in the same period in 2017; the lowest year-to-date for 16 years (since 2002).
Borrowing (PSNB ex) in the financial year ending (FYE) March 2018 was £39.9 billion: £5.6 billion less than in FYE March 2017; the lowest financial year for 11 years (since FYE 2007).
Debt (Public sector net debt excluding public sector banks (PSND ex)) at the end of August 2018 was £1,781.9 billion (or 84.3% of gross domestic product (GDP)); an increase of £15.9 billion (or a decrease of 1.8 percentage points) on August 2017.
Debt (PSND ex) at the end of August 2018 excluding Bank of England (mainly quantitative easing) was £1,588.7 billion (or 75.2% of GDP); a decrease of £28.7 billion (or a decrease of 3.7 percentage points) on August 2017.
Central government net cash requirement (CGNCR) in the current financial YTD was £5.3 billion (£0.4 billion less than YTD 2017) or £5.8 billion excluding both UK Asset Resolution Ltd and Network Rail (£0.5 billion less than in financial YTD 2017).
2. Things you need to know about public sector finances
In the UK, the public sector consists of five sub-sectors: central government, local government, public non-financial corporations, Bank of England and public financial corporations (or public sector banks).
Unless otherwise stated, the figures quoted in this bulletin exclude public sector banks (that is, currently only Royal Bank of Scotland (RBS)), as the reported position of debt (and to a lesser extent borrowing) would be distorted by the inclusion of RBS's balance sheet (and transactions). This is because government does not need to borrow to fund the debt of RBS, nor would surpluses achieved by RBS be passed on to government, other than through any dividends paid as a result of government equity holdings.
Public sector net borrowing excluding public sector banks (PSNB ex) measures the gap between revenue raised (current receipts) and total spending (current expenditure plus net investment (capital spending less capital receipts)). Public sector net borrowing is often referred to by commentators as “the deficit”.
The public sector net cash requirement (PSNCR) represents the cash needed to be raised from the financial markets over a period of time to finance the government’s activities. This can be close to the deficit for the same period but there are some transactions, for example, loans to the private sector, which need to be financed but do not contribute to the deficit. It is also close but not identical to the changes in the level of net debt between two points in time.
Public sector net debt excluding public sector banks (PSND ex) represents the amount of money the public sector owes to private sector organisations including overseas institutions, largely as a result of issuing gilts and Treasury Bills, less the amount of cash and other short-term assets it holds. Public sector net debt is often referred to by commentators as “national debt”.
While borrowing (or the deficit) represents the difference between total spending and receipts over a period of time, debt represents the total amount of money owed at a point in time.
The debt has been built up by successive government administrations over many years. When the government borrows (that is, runs a deficit), this normally adds to the debt total. So reducing the deficit is not the same as reducing the debt.
Nôl i'r tabl cynnwys3. What’s changed in this release?
This section presents information on aspects of data or methodology that have been introduced or improved since the publication of the previous bulletin, along with supporting information users may find useful.
Self-assessed Income Tax
In both January and July, accrued receipts are particularly high due to receipts from self-assessed Income Tax. The revenue raised through self-assessed Income Tax, as well as primarily affecting January and July receipts, also tends to lead to higher receipts in the following month (February and August respectively), although to a lesser degree.
In August 2018, receipts from self-assessed Income Tax were £1.3 billion, equivalent to those in August 2017.
It is advisable to look at the combined self-assessed Income Tax receipts for both July and August (or January and February) together when drawing conclusions from year-on-year comparisons.
Combined receipts from self-assessed Income Tax (July and August 2018) were £10.4 billion, an increase of £1.0 billion on the same period in 2017. This is the highest level of July and August self-assessed Income Tax receipts on record (records began in 1999).
The impact of improved local government data on our previous estimates
This month we have replaced our initial estimates of local government data for the current financial year-to-date with budget forecasts for England, Scotland and Wales, published by the Ministry of Housing, Communities and Local Government, the Scottish Government and the Welsh Government. Previously, these data were largely initial estimates, with most components calculated by Office for National Statistics (ONS) based on Office for Budget Responsibility (OBR) forecasts.
As a result, our estimate of local government net borrowing for the period April to July 2018 has reduced by £1.4 billion compared with figures presented in the previous bulletin (published on 21 August 2018). The reported reduction in public sector net debt excluding public sector banks (PSND ex) at the end of July 2018 of £1.3 billion was also largely due to the inclusion of improved local government data.
Nôl i'r tabl cynnwys4. How much is the public sector borrowing?
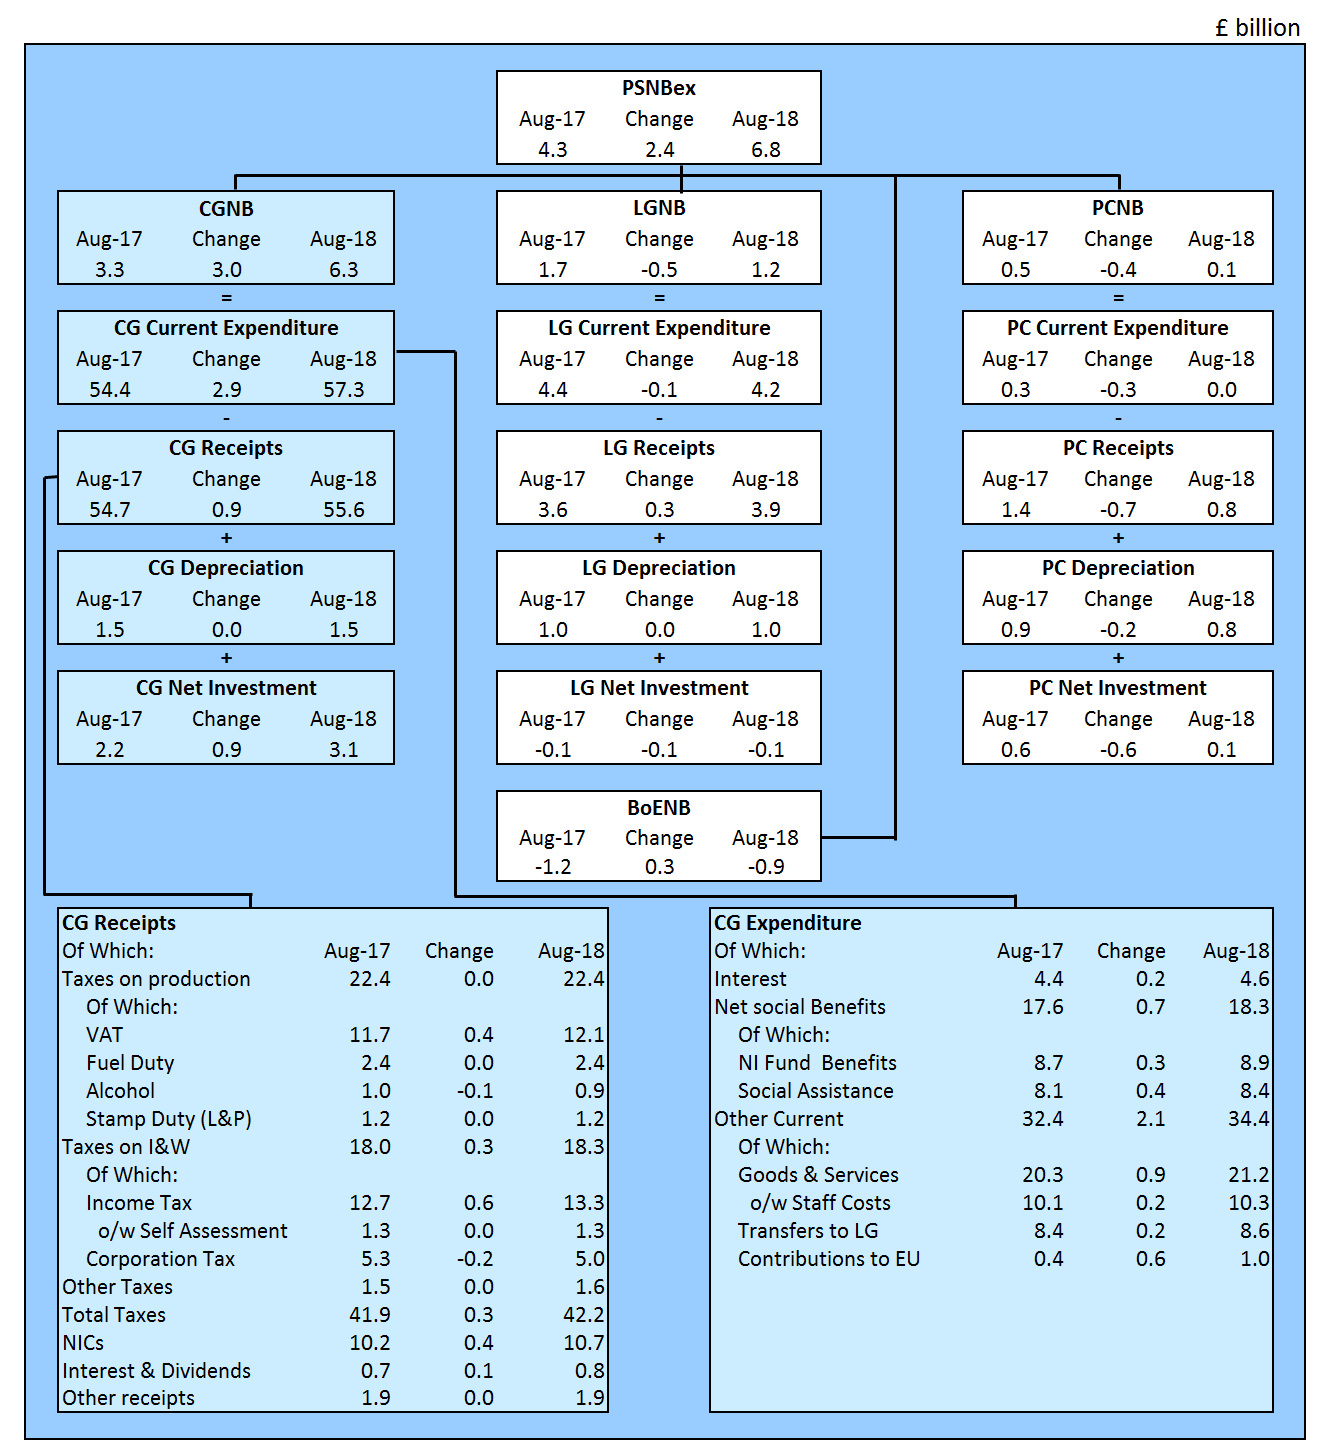
In August 2018, the public sector spent more money than it received in taxes and other income. This meant it had to borrow £6.8 billion; that is, £2.4 billion more than the same period in August 2017. This is the first year-on-year increase in August net borrowing for three years (August 2015 on August 2014).
While current receipts in August have increased by 1.6%, to £55.6 billion compared with August 2017, total expenditure increased by 6.9% to £60.4 billion.
Much of the annual growth in receipts came from Value Added Tax (VAT), National Insurance contributions and Income Tax, while other taxes such as duties on both tobacco and alcohol have fallen on August 2017.
This month, much of the increase in spending was in the current account, with notable growth in both the expenditure on goods and services as well as net social benefits.
This increase in net social benefits compared with last year partly reflects the uprating of various social security benefits, normally based on inflation in the preceding September. The basic State Pension is being uprated by 3.0% this year, in line with the government commitment to the “triple-guarantee” (or “triple lock”), while disability benefits will also see a 3.0% increase. The “triple lock” was introduced in the FYE March 2013. This ensures that it increases by the highest of the increase in earnings, price inflation (as measured by the Consumer Prices Index (CPI)) or 2.5%. For the purposes of the FYE March 2019 uprating, 3.0% (the CPI) was the highest of these three benchmarks.
Due to the volatility of the monthly data, the cumulative financial year-to-date borrowing figures often provide a better indication of the position of the public finances than the individual months.
The UK contributions to the EU in August 2018 (originally published error of August 2008 corrected) were £1.0 billion; a £0.6 billion increase on August 2017, seeing a return to a similar level as 2016 after a low 2017 due to an EU Budget surplus distributed to member states. EU contributions in the current financial year-to-date were £0.2 billion lower than the same period in 2017. Monthly transactions are often affected by the timings of payments and so caution should be taken when drawing conclusions from monthly data.
In addition to the increase in current spending, an increase in gross capital formation was an important factor in the year-on-year growth in the capital account.
Figure 1 summarises public sector borrowing by sub-sector in August 2018 and compares this with the equivalent measures in the same month a year earlier (August 2017). This presentation splits public sector net borrowing excluding public sector banks (PSNB ex) into each of its four sub-sectors: central government, local government, public corporations and Bank of England.
While local government data for August 2018 are based on budget forecasts for England, Wales and Scotland; public corporations data remain initial estimates, with most components calculated by Office for National Statistics (ONS) based on Office for Budget Responsibility (OBR) forecasts. In both cases, additional administrative source data are used to estimate transfers to each of these sectors from central government.
Figure 1: Contributions to public sector net borrowing (excluding public sector banks) by sub-sector
August 2018, compared with August 2017, UK
Source: Office for National Statistics
Download this image Figure 1: Contributions to public sector net borrowing (excluding public sector banks) by sub-sector
.png (110.4 kB) .xls (87.6 kB)
In the financial year-to-date (April to August 2018), the public sector spent more money than it received in taxes and other income. This meant it had to borrow £17.8 billion; that is, £7.8 billion less than the same period in 2017. Borrowing so far this financial year was the lowest for any April to August period for 16 years.
Of this £17.8 billion borrowed by the public sector in this period, £6.2 billion related to the cost of the “day-to-day” activities of the public sector (the current budget deficit), while £11.6 billion was capital spending (or net investment), such as on infrastructure.
Figure 2 presents both monthly and cumulative public sector net borrowing (excluding public sector banks) in the current financial year-to-date (April to August 2018) and compares these with the previous financial year.
Figure 2: Public sector net borrowing (excluding public sector banks)
Cumulative financial year-to-date (April to August 2018) compared with the financial year ending March 2018 (April 2017 to March 2018), UK
Source: Office for National Statistics
Notes:
- OBR forecast for public sector net borrowing excluding public sector banks from March 2018 Economic and Fiscal Outlook (EFO).
Download this chart Figure 2: Public sector net borrowing (excluding public sector banks)
Image .csv .xlsFigure 3 summarises the contributions of each sub-sector to public sector net borrowing (excluding public sector banks) in the current financial year-to-date (April to August 2018) and compares these with the same period in the previous financial year.
The difference between central government's income and spending makes the largest contribution to the amount borrowed by the public sector. In the latest financial year-to-date (April to August 2018), of the £17.8 billion borrowed by the public sector, £22.0 billion was borrowed by central government, while local government borrowing was in surplus by £5.1 billion.
In the current financial year-to-date, central government received £292.8 billion in income, including £219.1 billion in taxes. This was around 4% more than in the same period in 2017.
Over the same period, central government spent £307.1 billion, around 2% more than in the same period in 2017. Of this amount, just below two-thirds was spent by central government departments (such as health, education and defence), around one-third on social benefits (such as pensions, unemployment payments, Child Benefit and Maternity Pay), with the remaining being spent on capital investment and interest on government’s outstanding debt.
Figure 3: Contributions to public sector net borrowing (excluding public sector banks) by sub-sector
Current financial year-to-date (April to August 2018), UK

Source: Office for National Statistics
Notes:
- PSNBex – Public sector net borrowing excluding public sector banks.
- CGNB – Central government net borrowing.
- LGNB – Local government net borrowing.
- PCNB Non-financial public corporations net borrowing.
- BoENB – Bank of England net borrowing.
- L&P – Land and property.
- I & W – Income and wealth.
- Contributions to EU – UK VAT, GNI and abatement contributions to the EU budget.
- NICs – National Insurance contributions.
Download this image Figure 3: Contributions to public sector net borrowing (excluding public sector banks) by sub-sector
.png (120.1 kB) .xls (87.6 kB)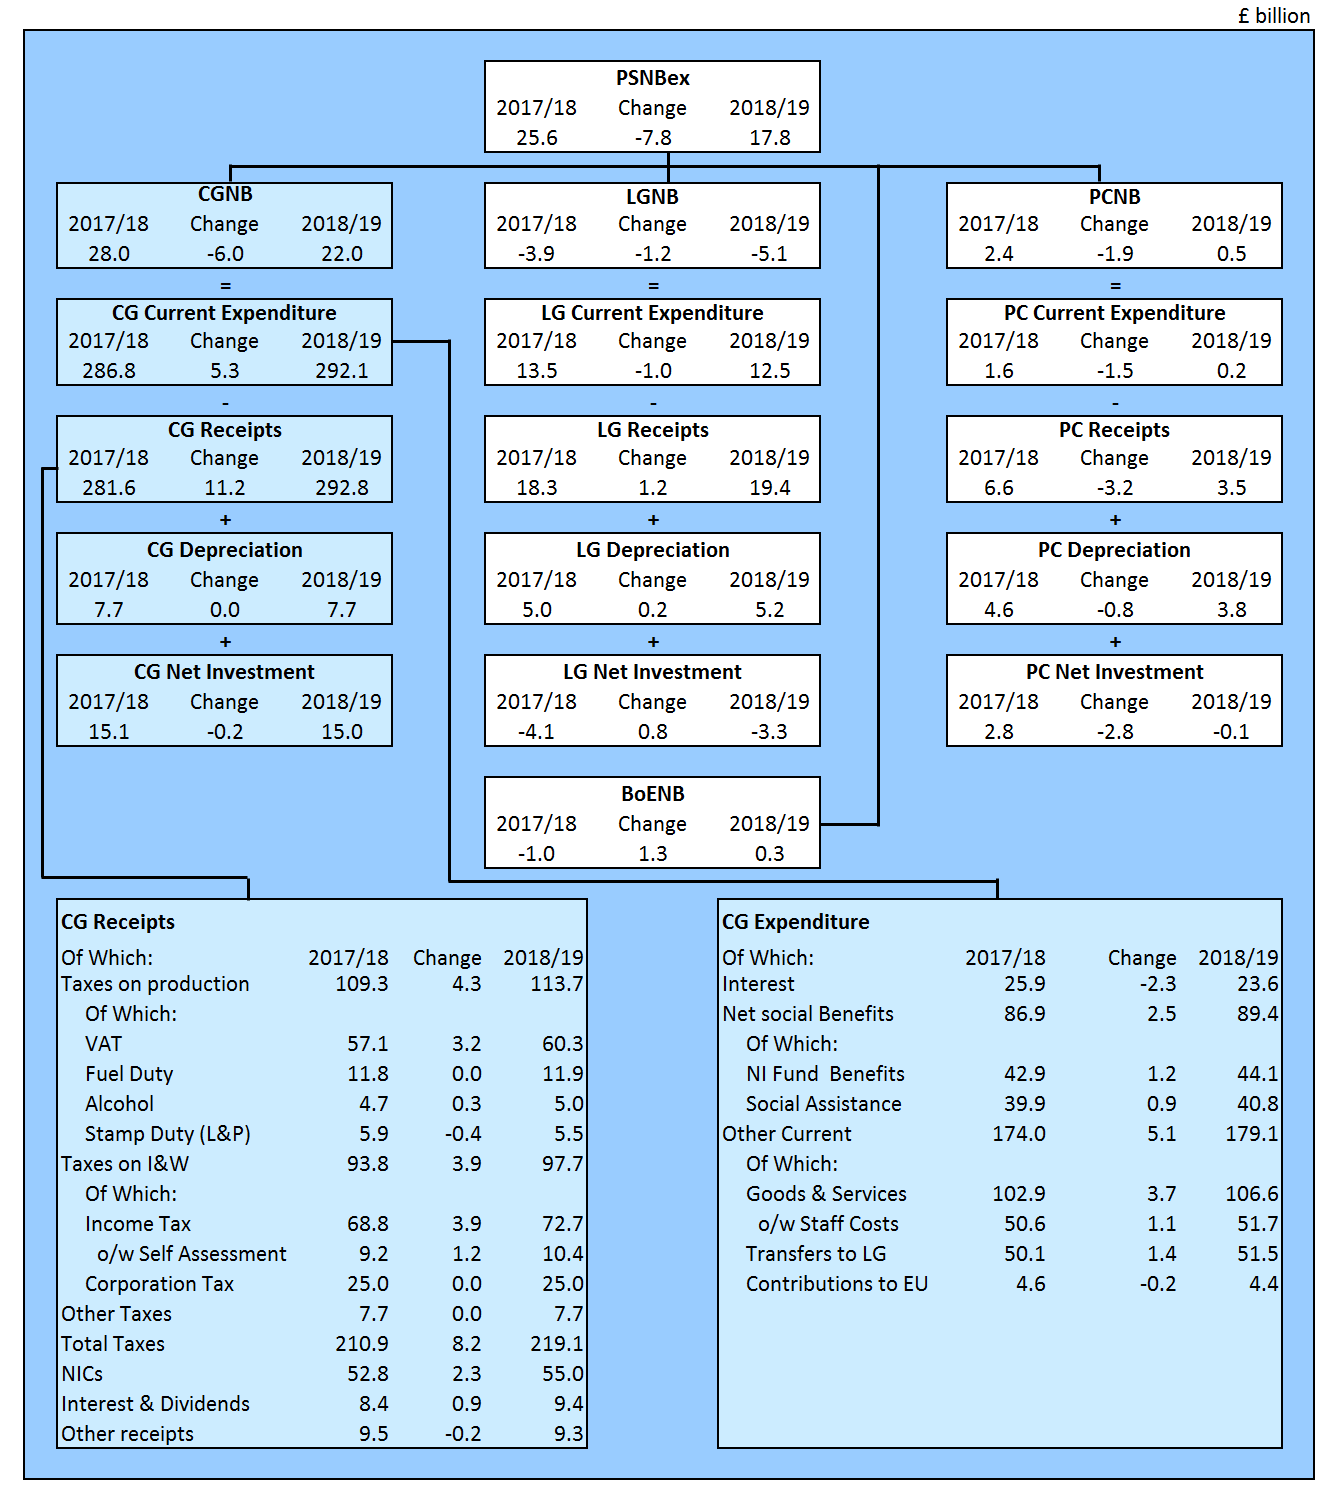
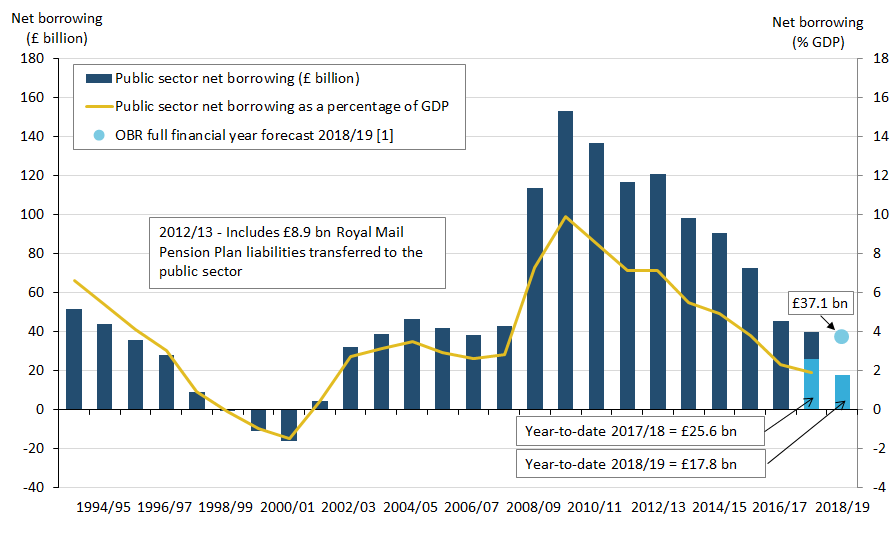
Figure 4 illustrates that annual borrowing has been generally falling since the peak in the financial year ending (FYE) March 2010 (April 2009 to March 2010).
In the latest full financial year (April 2017 to March 2018), the £39.9 billion (or 1.9% of gross domestic product (GDP)) borrowed by the public sector was around one-quarter of PSNB ex in the FYE March 2010, when borrowing was £153.1 billion (or 9.9% of GDP).
Figure 4: Public sector net borrowing (excluding public sector banks)
April 1993 to August 2018, UK
Source: Office for National Statistics
Notes:
- Financial year 2017/18 represents the financial year ending 2018 (April 2017 to March 2018).
- Office for Budget Responsibility (OBR) full financial year forecast of £37.1 billion for public sector net borrowing excluding public sector banks (March 2018 Economic and Fiscal Outlook).
- Year-to-date (April to August).
Download this image Figure 4: Public sector net borrowing (excluding public sector banks)
.png (42.8 kB) .xls (86.0 kB)
5. How much does the public sector owe?
Public sector net debt (PSND ex) represents the amount of money the public sector owes to private sector organisations (including overseas institutions), that has built up by successive government administrations over many years.
When the government borrows, this normally adds to the debt total, but it is important to remember that reducing the deficit is not the same as reducing the debt.
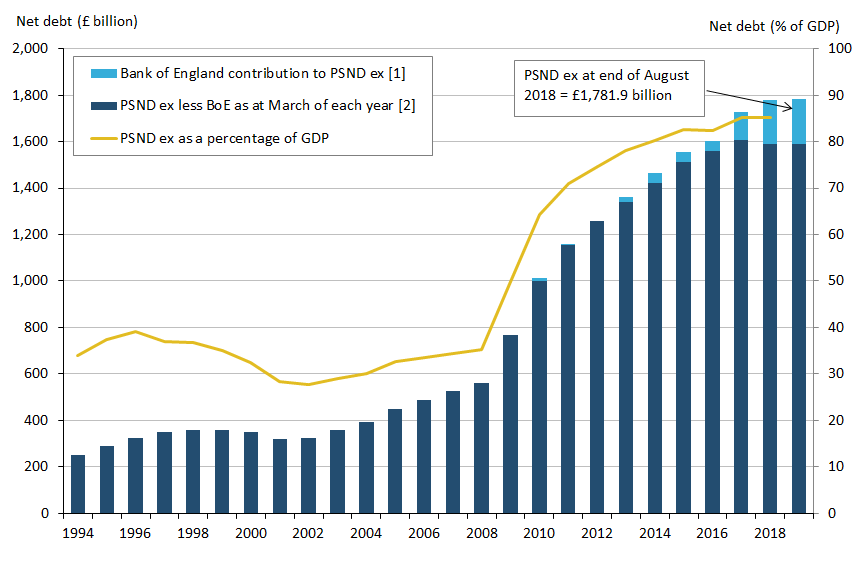
At the end of August 2018, the amount of money owed by the public sector to the private sector stood at around £1.8 trillion, which equates to 84.3% of the value of all the goods and services currently produced by the UK economy in a year (or gross domestic product (GDP)).
Figure 5: Public sector net debt (excluding public sector banks)
March 1994 to the end of August 2018, UK
Source: Office for National Statistics
Notes:
- Includes Asset Purchase Facility (APF), which includes the Term Funding Scheme (TFS).
- Public sector net debt excluding public sector banks (PSND ex) is the combination of PSND ex Bank of England (BoE) plus BoE contribution to PSND ex.
Download this image Figure 5: Public sector net debt (excluding public sector banks)
.png (43.3 kB) .xls (67.1 kB)
The introduction of the Term Funding Scheme (TFS) in September 2016 led to an increase in net debt, as the loans provided under the scheme are not liquid assets and therefore do not net off in public sector net debt (against the liabilities incurred in providing the loans).
Since August 2017, the net debt associated with the Bank of England (BoE) increased by £44.6 billion to £193.2 billion. Nearly all of this growth was due to the activities of the Asset Purchase Facility Fund, of which the TFS is a part.
The TFS closed for drawdowns of further loans on 28 February 2018 with a loan liability of £127.0 billion. The TFS loan liability at the end of August 2018 was £126.5 billion.
If we were to exclude the activities of the BoE in the estimation of public sector net debt (excluding public sector banks), it would reduce by £193.2 billion, from £1,781.9 billion to £1,588.7 billion, or from 84.3% of GDP to 75.2%.
Figure 6 breaks down outstanding public sector net debt at the end of August 2018 into the sub-sectors of the public sector. In addition to public sector net debt excluding public sector banks (PSND ex), this presentation includes the effect of public sector banks on debt.
Figure 6: Contributions to public sector net debt by sub-sector at the end of August 2018, UK
Source: Office for National Statistics
Notes:
- PSND – Public sector net debt.
- PSBsND – Public sector Banks net debt.
- PSNDex – Public sector net debt excluding public sector banks.
- BoEND – Bank of England's contribution to net debt.
- PSND ex less BoE – Public sector net debt excluding both public sector banks and Bank of England.
- NFPCND – Non-financial public corporations' net debt.
- GGND – General government net debt.
Download this chart Figure 6: Contributions to public sector net debt by sub-sector at the end of August 2018, UK
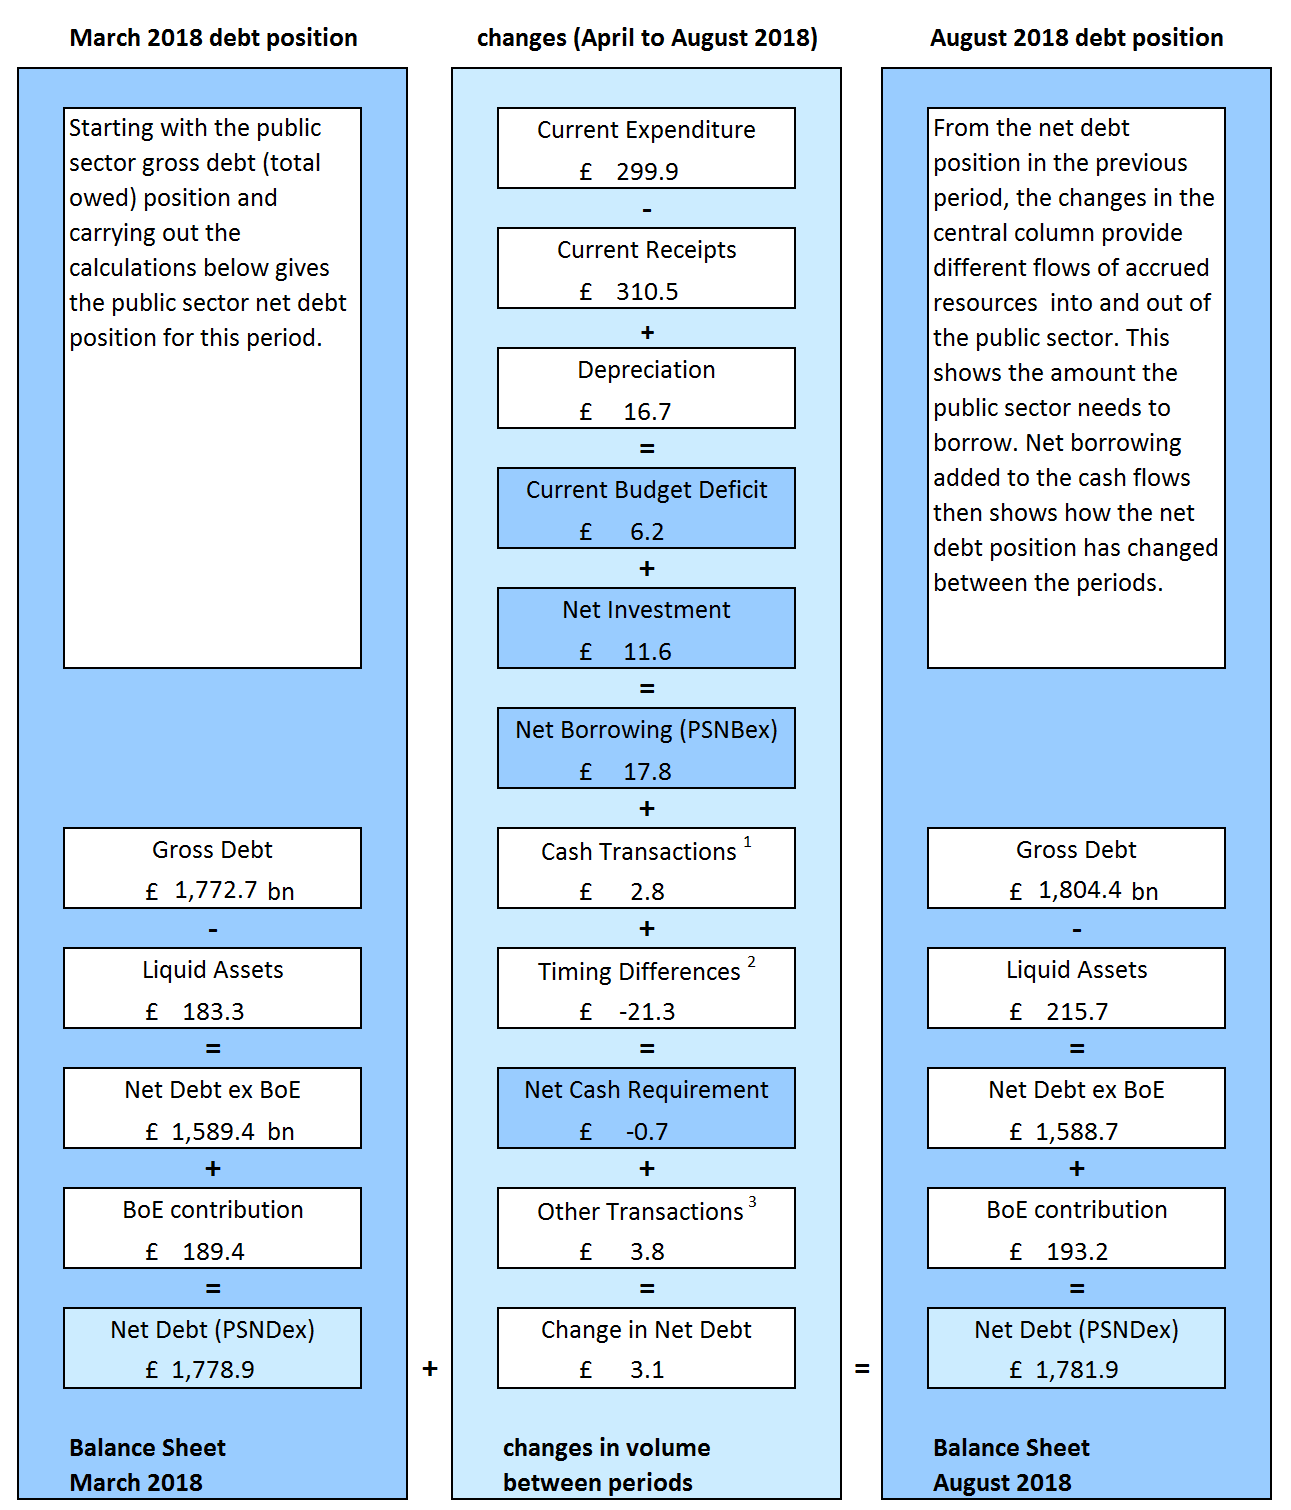
Image .csv .xlsFigure 7 incorporates the borrowing components detailed in Figure 2 to illustrate how the differences between income and spending (both current and capital) have led to the accumulation of debt in the current financial year-to-date (April to August 2018).
The reconciliation between public sector net borrowing and net cash requirement is presented in more detail in Table REC1 in the Public sector finances Tables 1 to 10: Appendix A dataset.
Figure 7: Components of net debt
How the difference in expenditure and receipts affect public sector net debt (excluding public sector banks), UK
Source: Office for National Statistics
Notes:
- Cash transactions in (non-financing) financial assets, which do not impact on net borrowing.
- Timing differences between cash and accrued data.
- Revaluation of foreign currency debt (for example, foreign currency). Debt issuances or redemptions above or below debt valuation (for example, bond premia and discounts and capital uplifts). Changes in volume of debt not due to transactions (for example, sector reclassification)
Download this image Figure 7: Components of net debt
.png (132.0 kB) .xls (60.4 kB)
6. Revisions since previous release
Revisions can be the result of both updated data sources and methodology changes. This month, the reported revisions are as a result of updated data sources only.
It is important to note that revisions do not occur as a result of errors; errors lead to corrections and are identified as such when they occur. This month we have no errors to report.
Table 1 presents the revisions to the headline statistics presented in this bulletin compared with those presented in the previous publication (published on 21 August 2018).
Table 1: Revisions to main aggregates
| Revisions since the previous public sector finances bulletin (published 21 August 2018), UK | |||||||||
| £ billion1 (not seasonally adjusted) | |||||||||
|---|---|---|---|---|---|---|---|---|---|
| Net borrowing | |||||||||
| Period | CG2 | LG3 | NFPCs4 | BoE5 | PSNB ex6 | PSND ex7 | PSND % of GDP | PSNCR ex8 | |
| 2011/12 | 0.0 | 0.1 | 0.0 | 0.0 | 0.1 | 0.0 | 0.0 | 0.0 | |
| 2012/13 | 0.0 | 0.0 | 0.0 | 0.0 | 0.0 | 0.0 | 0.0 | 0.0 | |
| 2013/14 | 0.0 | 0.0 | 0.0 | 0.0 | 0.0 | 0.0 | 0.0 | 0.0 | |
| 2014/15 | 0.0 | 0.0 | 0.0 | 0.0 | 0.0 | 0.0 | 0.0 | 0.0 | |
| 2015/16 | 0.0 | 0.0 | 0.0 | 0.0 | 0.0 | 0.0 | 0.0 | 0.0 | |
| 2016/17 | -0.3 | 0.0 | 0.0 | 0.0 | -0.3 | 0.0 | 0.0 | 0.0 | |
| 2017/18 | 0.5 | -0.1 | 0.1 | 0.0 | 0.5 | 0.0 | 0.0 | 0.0 | |
| 2018/19 YTD | -0.4 | -1.4 | 0.0 | 0.0 | -1.8 | -1.3 | -0.1 | 0.3 | |
| 2018 April | 0.4 | -0.4 | 0.0 | 0.0 | 0.1 | -0.4 | -0.1 | 0.0 | |
| 2018 May | 0.1 | -0.3 | 0.0 | 0.0 | -0.2 | -0.7 | 0.0 | 0.0 | |
| 2018 Jun | -0.3 | -0.3 | 0.0 | 0.0 | -0.5 | -1.1 | -0.1 | 0.0 | |
| 2018 Jul | -0.7 | -0.4 | 0.1 | 0.0 | -1.1 | -1.3 | -0.1 | 0.3 | |
| Source: Office for National Statistics | |||||||||
| Notes: | |||||||||
| 1. Unless otherwise stated. | |||||||||
| 2. Central government. | |||||||||
| 3. Local government. | |||||||||
| 4. Non-financial public corporations. | |||||||||
| 5. Bank of England. | |||||||||
| 6. Public sector net borrowing excluding public sector banks. | |||||||||
| 7. Public sector net debt excluding public sector banks. | |||||||||
| 8. Public sector net cash requirement excluding public sector banks. | |||||||||
| 9. 2017/18 represents financial year ending 2018 (April 2017 to March 2018). | |||||||||
| 10. 2018/19 YTD refers to the current financial year-to-date (April to July 2018). | |||||||||
Download this table Table 1: Revisions to main aggregates
.xls (52.2 kB)Revisions to public sector net borrowing (excluding public sector banks) in the current financial year-to-date (April to July 2018)
The data for the latest month of every release contain some forecast data. The initial outturn estimates for the early months of the financial year, particularly April, contain more forecast data than other months, as profiles of tax receipts, along with departmental and local government spending are still provisional. This means that the data for these months are typically more prone to revision than other months and can be subject to sizeable revisions in later months.
Public sector net borrowing excluding public sector banks (PSNB ex) has been revised down by £1.8 billion compared with figures presented in the previous bulletin (published on 21 August 2018).
Of this £1.8 billion downward revision to PSNB ex, there was a £1.4 billion reduction in local government’s contribution to net borrowing, coupled with a £0.4 billion reduction in the estimate of central government net borrowing.
Local government
This month we have replaced our initial estimates of local government data for the current financial year-to-date with budget forecasts for England, Scotland and Wales. However, in recent years, planned expenditure initially reported in local authority budgets has systematically been higher than the final outturn expenditure reported in the audited accounts. We therefore include adjustments to reduce the amounts reported at the budget stage. Our adjustments for the whole financial year ending (FYE) March 2019 are £1.0 billion for current expenditure and £0.7 billion for capital expenditure. Further information can be found in the public sector finances methodological guide.
These updates have resulted in revisions to our estimates of local government net borrowing.
Central government
Central government receipts were revised upwards by £0.2 billion; with increases in previous estimates of Value Added Tax and National Insurance contributions of £0.3 billion and £0.2 billion respectively; partially offset by a decrease in the previous estimates of Income Tax and interest (and dividends) of £0.1 billion and £0.7 billion respectively. The improvements to our estimate of interest (and dividends) were partially due to new cash data received from HM Treasury (£0.3 billion) and new data received from the compilation of the quarterly national accounts (£0.3 billion).
Over the same period, estimates for central government current expenditure were increased by £0.4 billion (largely expenditure on goods and services) and estimates for capital expenditure were revised downwards by £0.7 billion (largely transfers to central government).
Figure 8 breaks down this revision to PSNB ex by each of its four sub-sectors: central government, local government, non-financial public corporations and Bank of England (BoE).
Figure 8: Revisions to net borrowing
Latest data covering April to July 2018, compared with that presented in the previous bulletin (21 August 2018), UK

Source: Office for National Statistics
Notes:
- PSNBex – Public sector net borrowing excluding public sector banks.
- CGNB – Central government net borrowing.
- LGNB – Local government net borrowing.
- PCNB Non-financial public corporations net borrowing.
- BoENB – Bank of England net borrowing.
- L&P – Land and property.
- I & W – Income and wealth.
- Contributions to EU – UK VAT, GNI and abatement contributions to the EU budget.
- NICs – National Insurance contributions.
Download this image Figure 8: Revisions to net borrowing
.png (145.1 kB) .xls (88.6 kB)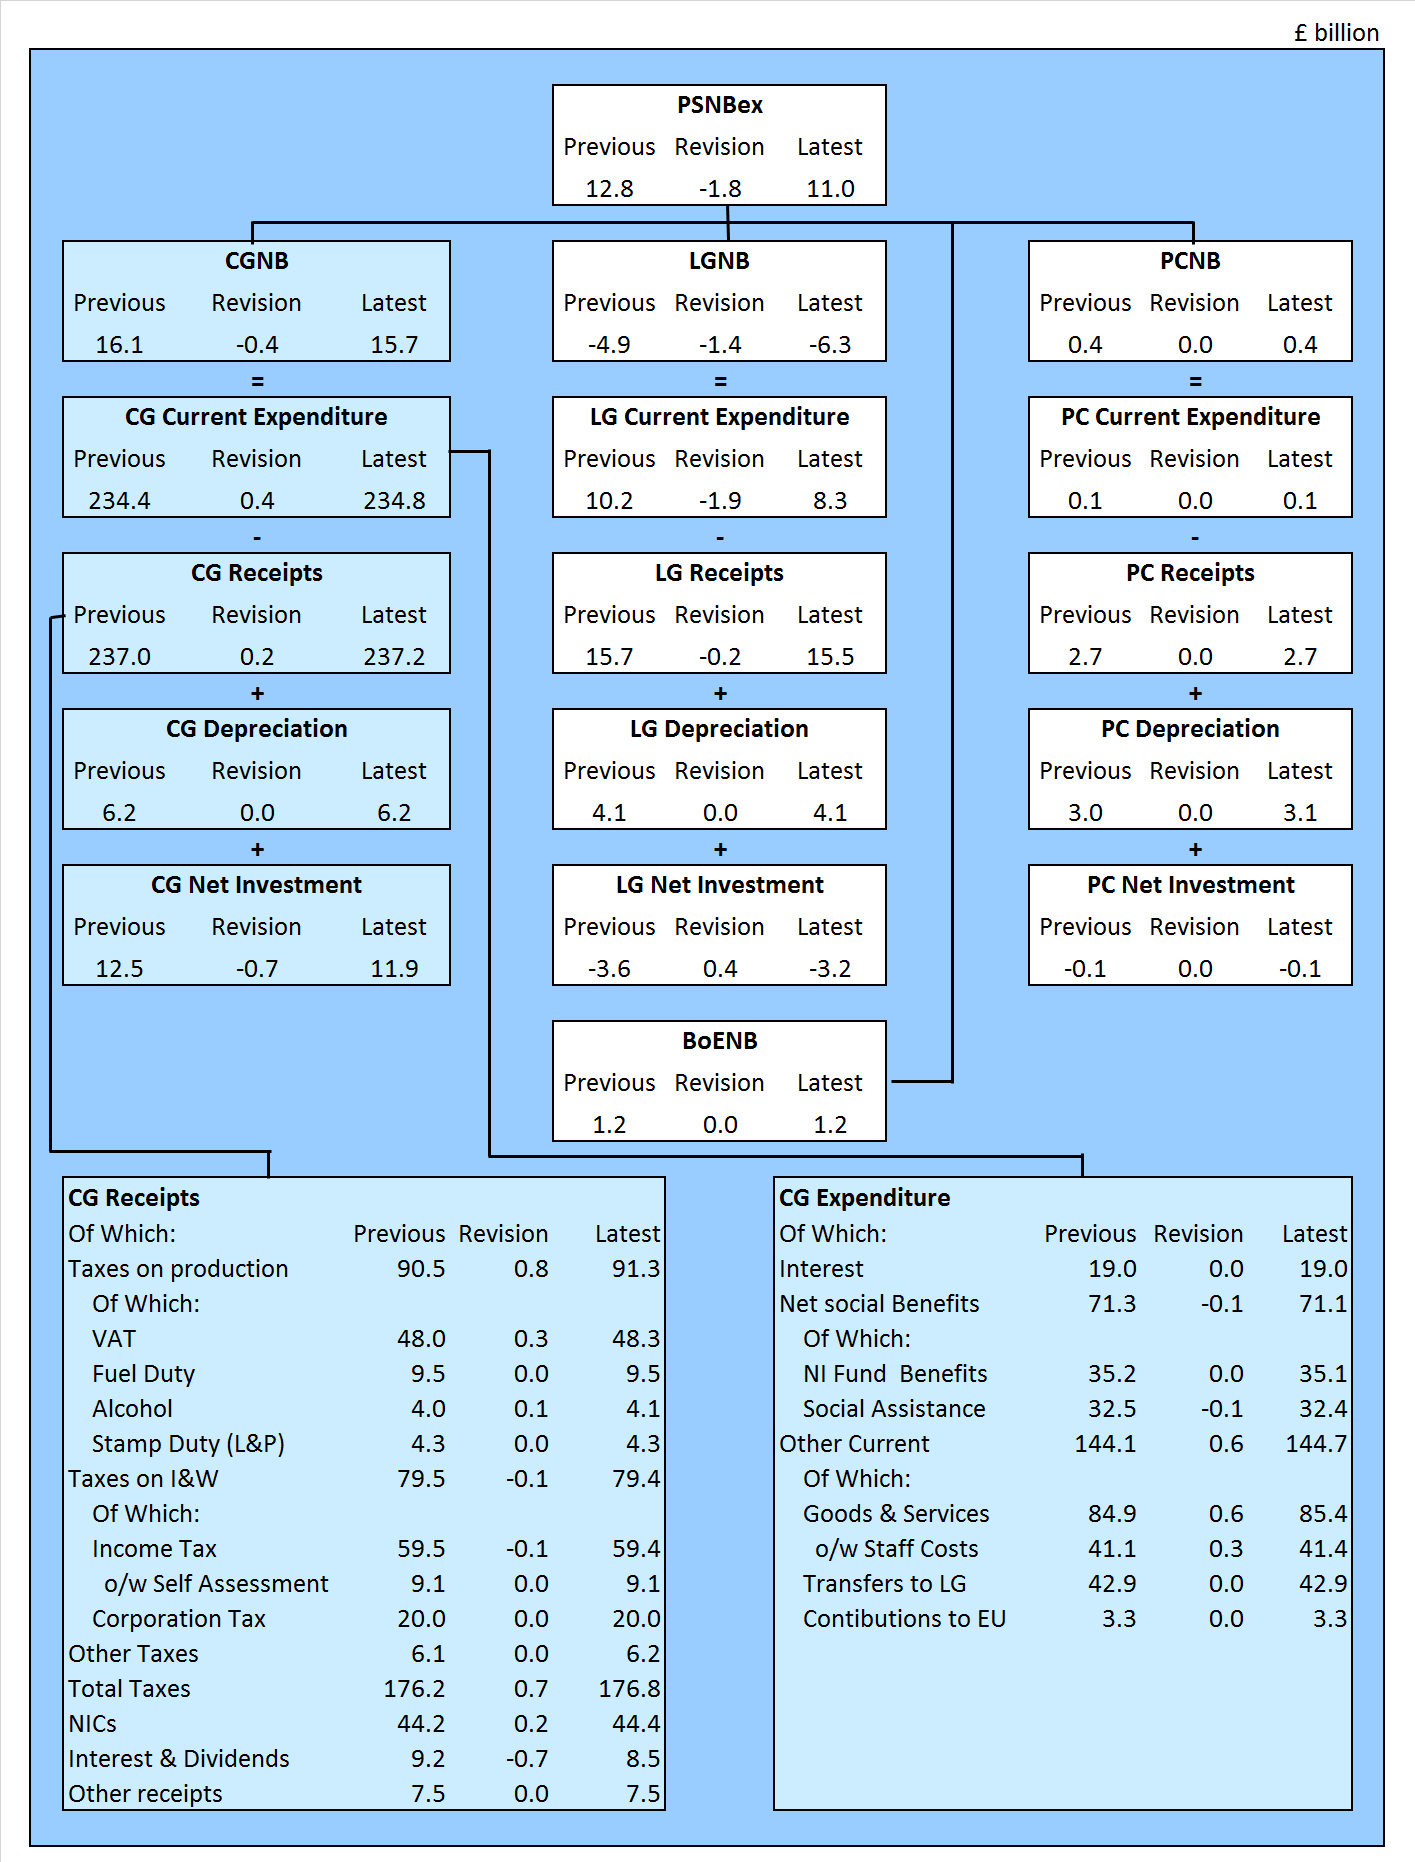
Revisions to public sector net borrowing (excluding public sector banks) in earlier financial years
Each quarter (March, June, September and December), we take advantage of the extensive data used to compile the quarterly national accounts to improve our estimates of public sector finance measures.
This month we incorporated central government resource account data replacing provisional outturn estimates, for the financial year ending (FYE) March 2018.
In the FYE March 2018, the estimate of borrowing increased by £0.5 billion; with an increase in the estimate of central government receipts of £0.2 billion being offset by increases in both current and capital expenditure of £0.4 billion and £0.2 billion respectively.
Improved estimates of central government expenditure on goods (and services) and debt interest of £0.3 billion each were partially offset with a reduction in our estimate of net social benefits of £0.2 billion. Further, our estimate of central government gross capital formation increased by £0.3 billion.
Local government budget forecast data for England and Scotland in the FYE March 2018 has been replaced with provisional outturn data, resulting in a reduction to the estimate of local government net borrowing of £0.1 billion across the year.
In the FYE March 2017, the estimate of borrowing decreased by £0.3 billion; largely due to improvements to our estimation of National Insurance contributions.
Revisions to public sector net debt (excluding public sector banks)
Public sector net debt excluding public sector banks (PSND ex) at the end of July 2018 has been revised down by £1.3 billion compared with figures presented in the previous bulletin (published on 21 August 2018). This revision is almost entirely the result of improvements to our local government data.
Revisions to public sector net cash requirement (excluding public sector banks) in the current financial year-to-date (April to July 2018)
Public sector net cash requirement excluding public sector banks (PSNCR ex) has been revised up by £0.3 billion compared with figures presented in the previous bulletin (published on 21 August 2018), again due to the inclusion of initial local government estimates with budget forecast data.
Nôl i'r tabl cynnwys7. How do our figures compare with official forecasts?
The independent Office for Budget Responsibility (OBR) is responsible for the production of official forecasts for government. These forecasts are usually produced twice a year (currently in March and November).
OBR forecasts used in this bulletin are based on those published on 13 March 2018.
Table 2 compares the current outturn estimates for each of our main public sector (excluding public sector banks) aggregates for the latest full financial year with corresponding OBR forecasts for the following financial year. Further, it compares the current financial year-to-date (April to August 2018) outturn estimates with those of the previous financial year.
Caution should be taken when comparing public sector finances data with OBR figures for the full financial year. Data are not finalised until some time after the financial year ends, with initial estimates made soon after the end of the financial year often subject to sizeable revisions in later months as forecasts are replaced with audited outturn data.
There may also be known methodological differences between OBR forecasts and outturn data.
Table 2: Latest outturn estimates compared with Office for Budget Responsibility forecasts
| Office for Budget Responsibility (OBR) forecasts in the current financial year-to-date (April to August 2018) compared with the latest full financial year (April 2017 to March 2018), UK | ||||||
| Excluding public sector banks | £ billion1 (not seasonally adjusted) | |||||
| Financial year-to-date7 | Full financial year8 | |||||
|---|---|---|---|---|---|---|
| 2017/18 | 2018/19 | % change | 2017/18 Outturn | 2018/19 OBR Forecast9 | % change | |
| Current budget deficit2 | 11.8 | 6.2 | -47.4 | -1.4 | -1.9 | 36.4 |
| Net investment3 | 13.8 | 11.6 | -16.0 | 41.2 | 39.0 | -5.4 |
| Net borrowing 4 | 25.6 | 17.8 | -30.5 | 39.9 | 37.1 | -7.1 |
| Net debt 5 | 1,766.0 | 1,781.9 | 0.9 | 1,778.9 | 1,835.0 | 3.2 |
| Net debt as a percentage of GDP6 | 86.1 | 84.3 | NA | 85.3 | 85.5 | NA |
| Source: Office for National Statistics | ||||||
| Notes: | ||||||
| 1. Unless otherwise stated. | ||||||
| 2. Current budget deficit is the difference between current expenditure (including depreciation) and current receipts. | ||||||
| 3. Net investment is gross investment (net capital formation plus net capital transfers) less depreciation. | ||||||
| 4. Net borrowing is current budget deficit plus net investment. | ||||||
| 5. Net debt is financial liabilities (for loans, deposits, currency and debt securities) less liquid assets. | ||||||
| 6. GDP at current market price. | ||||||
| 7. Financial year-to-date refers to the period from April to August. | ||||||
| 8. 2018/19 refers to financial year ending in March 2019 and 2017/18 refers to financial year ending in March 2018. | ||||||
| 9. All OBR figures are from the OBR Economic and Fiscal Outlook published in March 2018. | ||||||
| 10. NA means "not applicable". | ||||||
Download this table Table 2: Latest outturn estimates compared with Office for Budget Responsibility forecasts
.xls (50.2 kB)8. International comparisons of borrowing and debt
The UK government debt and deficit statistical bulletin is published quarterly (in January, April, July and December each year), to coincide with when the UK and other EU member states are required to report on their deficit (or net borrowing) and debt to the European Commission.
On 17 July 2018, we published UK government debt and deficit: March 2018, consistent with Public sector finances, UK: May 2018 (published on 21 June 2018). In this publication we stated that:
general government gross debt was £1,763.8 billion at the end of March 2018, equivalent to 85.8% of gross domestic product (GDP); 25.8 percentage points above the Maastricht reference value of 60.0%
general government deficit (or net borrowing) was £40.7 billion in the financial year ending (FYE) March 2018, equivalent to 2.0% of GDP; 1.0 percentage point below the Maastricht reference value of 3.0%
The UK general government debt and deficit data we published on 17 July 2018 were published by Eurostat on 20 July 2018 in context with the other 27 EU member states.
This bulletin presents largely unchanged figures compared with those published on 17 July 2018, with general government deficit (or net borrowing) in the FYE March 2018, increasing by £0.3 billion to £41.0 billion.
It is important to note that the GDP measure, used as the denominator in the calculation of the debt ratios in the UK government debt and deficit statistical bulletin, differs from that used within the Public sector finances statistical bulletin.
Nôl i'r tabl cynnwys9. Quality and methodology
The public sector finances Quality and Methodology Information (QMI) report contains important information on:
the strengths and limitations of the data and how it compares with related data
uses and users of the data
how the output was created
the quality of the output including the accuracy of the data
The public sector finances methodological guide provides a comprehensive contextual and methodological information concerning the monthly Public sector finances statistical bulletin.
The guide sets out the conceptual and fiscal policy context for the bulletin, identifies the main fiscal measures and explains how these are derived and inter-related. Additionally, it details the data sources used to compile the monthly estimates of the fiscal position.
Nôl i'r tabl cynnwys10. Looking ahead
This section presents information on aspects of data or methodology that are planned but not yet included in the public sector finances.
Further, in our article Looking ahead: developments in public sector finance statistics, we provide users with early sight of those areas where the fiscal statistics may be significantly impacted upon by methodological or classification changes during the coming 24 months.
VAT refunds
We are currently reviewing our recording of Value Added Tax (VAT) refund data (Table 3), in collaboration with both HM Revenue and Customs (HMRC) and HM Treasury (HMT). VAT refunds provide an estimate of the amount of VAT claimed back by local authorities and central government departments. Given that this tax is also included in local government or central government expenditure, any updates to VAT refunds data have no impact on public sector net borrowing. The expected impact on each component series is shown in Table 3. Figures may not sum due to rounding.
Table 3: A summary of the expected impact of our improvements to the recording of VAT refund data by sector
| For the financial year ending March 2018 | ||||||||
| £ billion | ||||||||
| 2017/18 | CG2 | LG3 | PS4 | |||||
|---|---|---|---|---|---|---|---|---|
| Taxes on production | 3.4 | 0.0 | 3.4 | |||||
| Total current receipts | 3.4 | 0.0 | 3.4 | |||||
| Current expenditure on goods and services | 2.7 | 0.5 | 3.2 | |||||
| Subsidies | 0.0 | 0.0 | 0.0 | |||||
| Current grants (net) within general government | 0.5 | -0.5 | 0.0 | |||||
| Total current expenditure | 3.3 | 0.0 | 3.3 | |||||
| Saving, gross plus capital taxes | 0.1 | 0.0 | 0.1 | |||||
| Current budget deficit | -0.1 | 0.0 | -0.1 | |||||
| Gross fixed capital formation | 0.0 | 0.1 | 0.1 | |||||
| Capital grants (net) within public sector | 0.1 | -0.1 | 0.0 | |||||
| Total net investment | 0.1 | 0.0 | 0.1 | |||||
| Net Borrowing | 0.0 | 0.0 | 0.0 | |||||
| Source: Office for National Statistics | ||||||||
| Notes: | ||||||||
| 1. 2017/18 – Financial year ending March 2018 | ||||||||
| 2. CG - Central government | ||||||||
| 3. LG - Local government | ||||||||
| 4. PS - Public sector | ||||||||
Download this table Table 3: A summary of the expected impact of our improvements to the recording of VAT refund data by sector
.xls (45.6 kB)We plan to introduce the VAT refund data improvements for FYE March 2018 and FYE March 2019 in the September Public sector finance bulletin to be published on 19 October 2018. OBR has been informed of these expected data changes and they will also be reflected in their Autumn Budget forecasts.
We are currently compiling improved VAT refund data for periods prior to FYE March 2018 and these will be implemented in the statistics at a future point.
Fines and penalties
We are currently investigating our recording of fines and penalties for the late payment of taxes to HMRC.
Any additional revenue identified and recorded by the inclusion of such payments will increase central government receipts and so reduce public sector net borrowing.
Based on our ongoing investigation, we expect borrowing to reduce by around £0.7 billion in the financial year ending (FYE) March 2018 due to this revenue increase.
We plan to introduce these changes in the September Public sector finance bulletin published on 19 October 2018. OBR have been informed of these expected data changes and they will be reflected in their Autumn Budget forecasts.
Any revisions to fines and penalties data for periods prior to FYE March 2018 will not be implemented next month but at a future point once our investigations are concluded.
The treatment of pensions in public sector finances
On 31 August 2018, our consultation concerning the treatment of pensions within the public sector finances closed. We are currently considering the feedback we received and will publish a response within the next three months.
The Sale of railway arches
On 11 September 2018, Network Rail announced they had agreed terms for the sale of its Commercial Estate business in England and Wales, the majority of the properties in which are railway arches. We are currently investigating the nature of the transaction in order to ensure that the impacts will be fully reflected in the public sector finances.
Housing associations
In recent weeks, the Housing (Amendment) (Scotland) Bill passed Stage 3 of the Scottish Parliament. As such, ONS is currently reviewing the classification status of registered social landlords in Scotland.
Recent announcements concerning the Term Funding Scheme
On 21 June 2018, the government published a new Memorandum of Understanding between HM Treasury and the Bank of England (BoE), which sets out the financial relationship between the two institutions.
This memorandum announced that during the current financial year (April 2018 to March 2019), the £127 billion liabilities of the Term Funding Scheme (TFS) (PDF, 1.4MB) will be transferred from the Bank of England Asset Purchase Facility Fund (APF) to the BoE’s own balance sheet and that the HM Treasury indemnity for it was being removed.
TFS was introduced in 2016, as a quantitative easing measure under the APF umbrella, to enable financial institutions to cut the time in passing on interest rate reductions to consumers and businesses.
This change will have no impact on public sector net debt (both including and excluding public sector banks).
Further, to enable the BoE to take TFS on balance sheet without an indemnity from the Treasury, a capital injection of £1.2 billion from HM Treasury to the BoE has been announced. The nature of the capital injection will be formally discussed at a classifications meeting and announced in due course.
East Coast Mainline
On 16 May 2018, the government announced that from 24 June 2018, London North Eastern Railway (LNER) will take over the running of East Coast Mainline services. On 31 August 2018, we announced that LNER would be classified to the Public Non-Financial Corporations sub-sector, effective from 14 February 2018. We are currently investigating the implications of this decision and our conclusions will be announced in due course.
EU withdrawal agreement
On 8 December 2017, the government published a joint report on progress during phase 1 of negotiations between the European Union and the UK (PDF, 383KB), under Article 50 of the Treaty on European Union (TEU) on the UK’s orderly withdrawal from the EU.
Although the Office for Budget Responsibility (OBR) discusses the EU settlement in Annex B (PDF, 2.5MB) of their Economic and Fiscal Outlook - March 2018, the details in the report are still subject to negotiation and so there is insufficient certainty at this stage for us to complete a formal assessment of impact on the UK public sector finances.
Carillion insolvency
Following Carillion Plc declaring insolvency on 15 January 2018, the UK government announced that it will provide the necessary funding required by the Official Receiver, to ensure continuity of public services through an orderly liquidation. The Official Receiver has been appointed by the court as liquidator, along with partners at PwC that have been appointed Special Managers. The defined benefit pension schemes of former Carillion employees are currently being assessed by the Pension Protection Fund (PPF) prior to any transition into the PPF scheme.
We are currently investigating the various impacts of the liquidation of Carillion on the public sector finances, including in relation to the public-private partnership projects in which Carillion was involved and the additional funding that the government has provided in order to maintain public services. We will announce our findings in due course.
Prior to liquidation, Carillion held approximately 450 contracts with government, representing 38% of Carillion’s 2016 reported revenue.
Nôl i'r tabl cynnwys